

This is a post about Server Timing, a W3C standard. It’s also about the use of HTTP trailers with Server Timing, something Fastly collaborated with Firefox on to bring to the web, and further enhance the mechanism while providing better visibility. Although we’ll talk about the feature from Fastly’s perspective and provide Fastly-specific examples, we thought it’d be important to get Firefox’s point of view and motivations. So, Dragana Damjanovic from Mozilla has contributed to this blog post in order to give us that insight.
Over the past decade, browsers have been gaining more and more insight into key performance metrics. At first, there was Navigation Timing which provided an API to expose important data as to how a page was loaded by the browser. The W3C gave us Resource Timing next, taking things one step further by revealing key metrics related to the loading of each individual asset, including a breakdown of all networking components. Both of these standards are supported by major browsers (https://caniuse.com/#feat=nav-timing and https://caniuse.com/#feat=resource-timing) and are often collected by Real User Monitoring (RUM) tools for reporting and analysis.
Naturally, all this data has made us more and more curious. Even though these metrics give us a pretty good idea of how an end user experiences a web page and its assets, they don’t necessarily always paint the full picture. For example, if the first byte of an image takes 500 msec from the time we send a request to arrive at the browser, all these APIs tell us is that it took 500 msec to see the first byte, but not necessarily why. Maybe it was network latency. Maybe it needed to perform a database lookup. Or maybe it needed to go through server-side optimizations.
To get the full picture, we’ve generally needed to keep server-side logs too, and then correlate user-side metrics with the server-side ones to really see what’s going on — and, of course, this can all become tricky rather quickly.
Server Timing to the rescue
W3C’s relatively recent Server Timing specification fills in this gap by letting servers send arbitrary performance metrics to the browser via standard HTTP headers. The data is then exposed via an API so the same RUM tools that are collecting client-side data can collect and report server-side metrics.
Unlike Navigating Timing and Resource Timing, Server Timing has been defined in a very flexible format, allowing developers to convey pretty much whatever server-side data they may find useful in their applications. The spec is pretty simple, but the gist is this:
The metrics are sent as the value of the
Server-Timingresponse headerEach metric has a name, an optional numeric “duration,” and an optional string “description”
Duration and description are reported by the
duranddescattributes, right after the name, semicolon separatedMetrics are separated by commas
So, for example, imagine the following Server-Timing header:
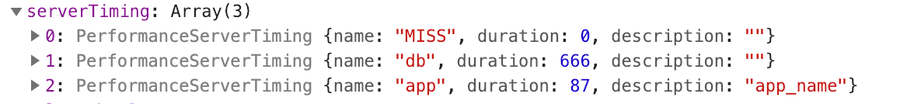
Server-Timing: MISS, db;dur=666, app;dur=87;desc=app_nameThis header presents three metrics, one named MISS, one named db with a duration of 666, and one named app with duration of 87 and description of app_name.
That data is then exposed through the PerformanceServerTiming interface. You can see it in Chrome’s DevTools using, for example, window.performance.getEntries():
You’re allowed to use multiple Server-Timing headers, and the spec allows the same metric name to be used multiple times. Clients should expose all data in all Server-Timing headers, and if a metric name is seen more than once, the client has to expose the attributes for each occurrence. This is very helpful because you can have metrics appended as a request/response goes through the various stages of back-end processing. (Note that the spec doesn’t define any measurement units for “duration,” making it merely a number that’s meaningful to you and/or your application in whatever way you like. Chrome does, however, interpret the number in milliseconds in DevTools, where it also displays per-object bar charts for each Server Timing metric based on this number.)
You can use this mechanism to relay any meaningful metrics about your origin infrastructure to a browser to be consumed by RUM tools (for a little inspiration, check out a recent talk by Fastly’s own Andrew Betts). And by this point, if you’ve ever ventured into the happy place that is the world of VCL variables, you’re already thinking about how to leverage varnish to relay valuable information to a client. There’s a lot of information available through these variables and, until now, logging them was the only way to get the insight they provide. But now, we can also use Server Timing to collect some of that information browser-side. Here’s a simple example:
Here, we’ve put four pieces of information into the Server-Timing header (most of them straight from our documentation): when the request started, how long it took to serve the first byte, which data center served it, and the cache state. Here’s an example of what that response header would look like at the client:
Server-Timing: time-start-msec;dur=1544705663920,time-elapsed;dur=0,fastly-pop;desc=LCY,hit-state;desc=HITAnd this is what it would look like in Firefox’s Developer Tools:
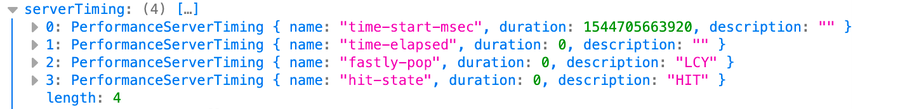
This tells us that the object was served from our LCY POP, and it was a HIT (which is why it took 0 milliseconds to serve, according to time-elapsed). If instead we requested an object that had to be fetched from the origin, things would look a little different:
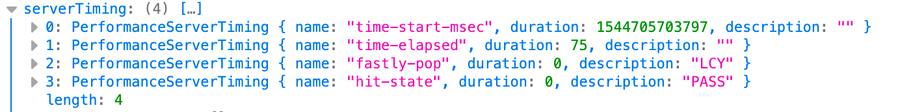
This time, since this is PASS object, it took some time for it to get fetched from the origin (75 msec, in fact). And since we have the start time in epoch milliseconds, we can also calculate when the first byte was served in epoch time (1544705703797 + 75 = 1544705703872).

That’s all valuable and interesting information in and of itself. But, buckle up, it’s going to get even more interesting in two minutes!
This is just one example of how Server Timing and VCL can be used together to send valuable data to the client to be collected at the browser. Since this means you can now collect, browser-side, any VCL variable that you’d normally log with Fastly, I expect many more creative uses will show up as our customers figure out ways to leverage this mechanism. And keep in mind: you can put whatever you like in the Server-Timing header: any metric that’s meaningful to you, whether from VCL or from your own application infrastructure, can be put in the header and collected client-side as long as it’s presented in the correct format for the header value. It’s a pretty powerful mechanism.
As of this writing, basic Server Timing support is available in Chrome, Firefox, and Opera. Hopefully, support will grow with adoption.
Server Timing and trailers: the missing piece
Even though the inclusion of arbitrary metrics can paint a much more holistic picture of application performance, all in one place, there’s still one piece missing.
Since Server Timing is relayed through an HTTP header, the metrics available can only be those known when we start sending the response to a client. But, there’s also valuable information that we only know after we deliver the object to the client, after we’ve finished sending it (e.g., how long it took to send the contents of a response). We’ve already sent the headers, so it’s too late to put them there.
Traditionally, with Fastly, we’ve used logging to track these sorts of metrics. Since vcl_log runs after vcl_deliver, we can log important post-delivery metrics we’re interested in and examine them later. The problem is that this brings us back to having two collection points: Server Timing and logs. If only there were a way to include Server Timing data at the end of a response…
Wait! There is!
Trailers!
If you’re not familiar with HTTP trailers, you’re not alone. Though seldom seen in the wild, they’ve been around since HTTP/1.1 was originally defined. The idea is to be able to send headers after the body has already been sent (this is why they’re sometimes called “trailers” and sometimes called “trailing headers”). In HTTP/1.1 this required chunked-encoded responses with trailing headers after the last chunk. In HTTP/2, since everything is better defined for transport, trailers can be sent by using HEADERS frames after the last DATA frame has been sent on a stream.
And, as it turns out, the Server Timing spec specifically mentions support for HTTP trailers:
The user-agent MAY process Server-Timing header field communicated via a trailer field (see [RFC7230] section 4.1.2) using the same algorithm.As valuable as they may be, the problem with trailers has always been the lack of support in browsers and middleboxes. Some servers can send them, but because most clients don’t really support them, the mechanism hasn’t really been exercised much. Most browsers silently discard them and won’t even show them in their developer tools. And it’s not hard to imagine middleboxes that not only lack support for trailers but may have issues if/when they see them. In fact, that MAY in the snippet of Server Timing specification above used to be a MUST, but the requirement has since been somewhat laxed because of poor client-side support.
Server Timing, though, gives us a new and compelling use case for trailers. And it’d really be a shame if we couldn’t use them to give us further visibility into our systems. So, Fastly got together with Mozilla and we worked on joint support for the mechanism, both on our side and in Firefox. But before we talk about how to send them with Fastly, this is probably a good time to get Firefox’s perspective...
Server Timing support for trailers in Firefox
by Dragana Damjanovic, Mozilla
Clients have been hesitant to implement HTTP trailers for years because of security and consistency concerns with the trailers general case. Browsers seek to render response bytes as soon as possible, but rendering is the result of combining the response data with the semantics of the response headers (e.g., the content-type header informs how a response is displayed). Generic trailers allow header information to be added after the rendering has begun, and this has traditionally created concerns about both correctness and security for supporting trailers.
Server Timing, however, has no semantic value for security or correctness. Additionally, it has an inherent reason for being generated after the rest of the response body. Making this data available to RUM systems enhances the power of JavaScript frameworks and directly empowers web developers. Fastly advocated for the power of additional RUM data for web developers, and helped build test cases and proof of concepts for the idea on the server side, along with the Firefox developers working on the browser code.
Based on all of those arguments Firefox decided to implement whitelisted support for only the Server-Timing trailer instead of all trailers.
Support for Server Timing in trailers for Firefox was introduced in Firefox 64. That version was released in December of 2018.
Server Timing works best with HTTP/2 because that version of HTTP reduces the overhead associated with the headers and trailers through compression. For that version, Firefox will send the suggested TE: trailers header to the server automatically. In order to save bandwidth, that header is not sent on HTTP/1 though the feature will still work if the server sends the trailer as part of the response.
Middleboxes on the internet often have bad interactions with new use patterns, and this is a concern with trailers. That is another reason that Firefox only signals support for them over HTTP/2 which it only supports for https:// based content. Services should avoid using trailers over plain http:// connections to play it safe and avoid running into these middleboxes.
Sending Server Timing trailers with Fastly
As Dragana noted, Firefox’s support for trailers is only intended to expose Server Timing metrics, and only for HTTPS. That’s still a pretty big deal because no other browser does this. And now that a browser can process these trailers, we needed to add a way to generate meaningful trailers with Fastly. Our initial support is a mechanism that allows up to three key metrics to be inserted as a Server-Timing trailer: epoch timestamp (in msec for easy calculation of delta times), measured TCP RTT (round trip time), and the number of TCP packets retransmitted.
To invoke the mechanism, you can use VCL to add the response header X-Trailer-Server-Timing to an object (or send it from origin, either will work). The presence of the header is a signal for Fastly to add one or more of the three metrics in a Server-Timing trailer. The header can have any combination of three values: timestamp, rtt, or retrans — and they need to be comma separated. Here’s an example VCL:
This VCL would add a trailing header at the end of the object that would look something like this:
Server-Timing: rtt; dur=6.308, retrans; dur=3, trailer-timestamp; dur=1544463143861This translates to:
TCP RTT measured at the end of this transmission was 6.308 msec (the equivalent of
client.socket.tcpi_rtt)the total number of retransmits at this point on this connection is 3 (the equivalent of
client.socket.tcpi_total_retrans)the epoch timestamp in milliseconds at the end of this transmission is
1544463143861
Note that the X-Trailer-Server-Timing header itself is removed before the response is sent to the client: it’s merely an internal signal for the addition of the trailers.
These metrics at the end of a response add new context to the delivery of this particular resource. And the best part is that they can be collected at the client (albeit only in Firefox for now). Fastly supports sending Server Timing trailers by default for HTTP/2. We also support sending them for HTTP/1.1 over TLS, but not by default, so contact us if you’re interested in using them with HTTP/1.1 — or if you want to see additional metrics added to the trailer.
Putting it all together
Hopefully it’s getting pretty clear as to how the combination of Server Timing headers and trailers can yield new insight to how an object was delivered.
Imagine that you have a relatively large file that needs to be fetched from origin. The connection between Fastly and your origin is fast but the connection between Fastly and the client is slower, so the file will take longer to send than it did to receive. By combining timestamps and request duration in both headers and trailers, we’ll get a clear view of all the timings involved with fetching and delivering this file to the client, from Fastly’s perspective:
The VCL for generating the right values is a combination of our previous two examples:
Which on the wire, with HTTP/1.1 would look something like this:
HTTP/1.1 200 OK
Server: Some Server
Content-Type: text/html
Transfer-Encoding: chunked
Trailer: Server-Timing
Server-Timing: time-start-msec;dur=1544707555517,time-elapsed;dur=81,fastly-pop=LCY,hit-state;desc=PASS
[response_body]
[response_body]
[response_body]
[response_body]
[response_body]
[response_body]
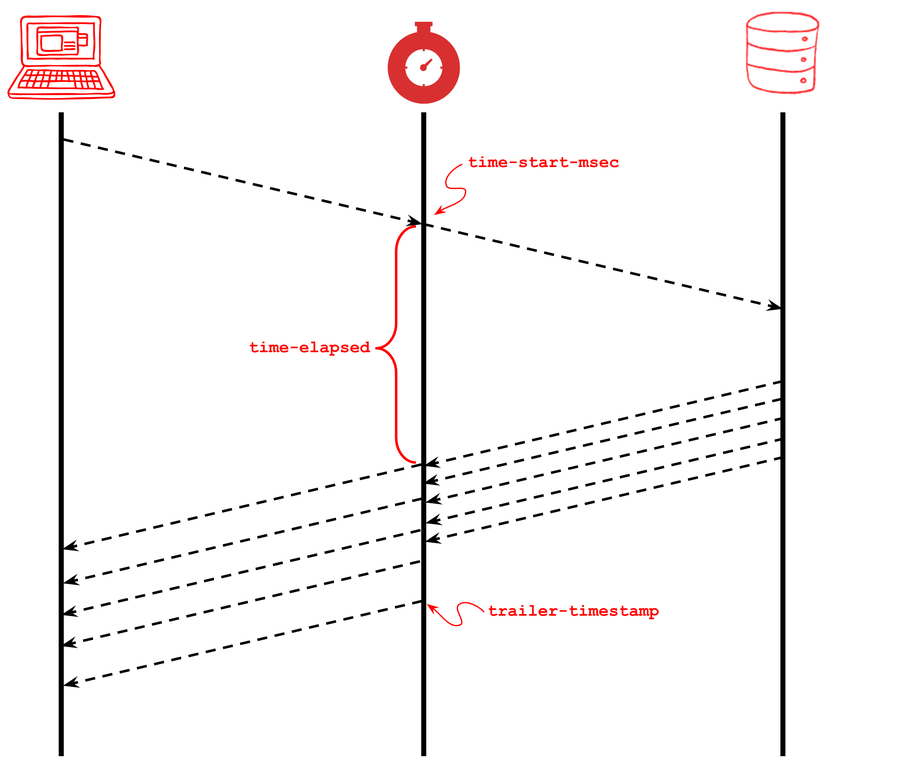
Server-Timing: rtt; dur=10.57, retrans; dur=2, trailer-timestamp; dur=1544707555763And with HTTP/2, this is what the frame flow would look like:

And Firefox would present that information in its developer tools, all in one place, like this:
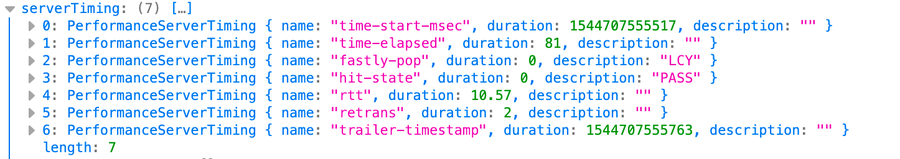
This tells us that:
This request was received at
1544707555517epoch msecIt was served from LCY, was a
PASS, and took 81 msec to fetch it from originThis response started being sent to the client at
1544707555517 + 81 = 1544707555598epoch msecThe cache was finished delivering the response at
1544707555763epoch msec.It took
1544707555763 - 1544707555598 = 165milliseconds to be transmitted to the clientThe observed RTT between the cache and the client at the end of transmission was 10.57msec (we could’ve also collected this at the header and then compared to the trailer)
The TCP connection at this moment has had two retransmitted segments (if we’d also collected this at the header, we could’ve known how many segments were retransmitted on this TCP connection during the sending of this response)
This pattern isn’t just useful for PASS objects. If there was a large cached object being sent to a client, timestamps at the start and end of the transmission will give us a good view of the server-side (or rather, Fastly-side in this case) of the transmission. This data can be collected at the client with JavaScript and compared to the client-side perspective which will be available through standard Resource Timing metrics.
Looking ahead
Mechanisms that expose key performance metrics in the browser have provided some great insight over the last few years. Server Timing enhances those mechanisms with a new way for the server to relay its own key metrics to the browser. This makes collection and reporting easier and also provides new ways for us to have visibility at the client. It’s a powerful and valuable toolset for those of us who are hungry for performance forensics.
Leveraging HTTP trailers for relaying additional information through Server Timing makes them even more powerful and lets us track metrics that we’ve never been able to track at the browser before. At Fastly, we’ve started with some limited support for Server TIming trailers in the form of three predetermined metrics. But, we’re keeping a close eye on adoption and we hope to broaden the support to include arbitrary VCL variables in trailers, just like we do with headers.
Firefox’s support for Server Timing trailers is a big step forward on the client-side. Trailers have traditionally been ignored by browsers: in fact, this is the first time any browser is exposing trailers in any way at all. If (or hopefully when) this surfaces some of their inherent value, we hope other browsers follow suit and that MAY in the spec will turn back into a MUST!