There may be simpler possibilities for installing ElasticSearch on Docker. However, here, we will choose a way that can be easily expanded for production use: the installation of ElasticSearch on Kubernetes via Helm charts.
While installing ElasticSearch using Helm implements best practice rules that make the solution fit for production, the resource needs of such a solution is tremendous. What, if we want to start on a small system with 2 vCPU and 8 GB RAM? In that case, we need to scale down the solution, thus sacrificing the production-readiness. This is, what we will do here: instead of creating a production-ready deployment with three masters, two data nodes and two clients, we will create a scaled-down version of the production solution with only one node each. It is clear that this scaled-down solution is not designed for production use. However, once your Kubernetes infrastructure is large enough, it is simple to remove the command-line options and to follow the defaults that are fit for production use.
References
- The Helm charts can be found in the GIT Repo: https://github.com/helm/charts.
- Installation scripts used in this article can be found on our own GIT repo: https://github.com/oveits/kubernetes-install-elasticsearch-via-helm.git
Prerequisites:
- Tested with: 2 vCPU, 8GB RAM, 40GB + 20GB external disk (however, < 8 GB disk are sufficient for Kubernetes and the ElasticSearch database will need less than 50 MB in this minimalistic hello world test). However, make sure that you have 8 GB RAm available. You can expect the installation to fail if, say, only 4 GB RAM is available.
Step 1: Review the Options
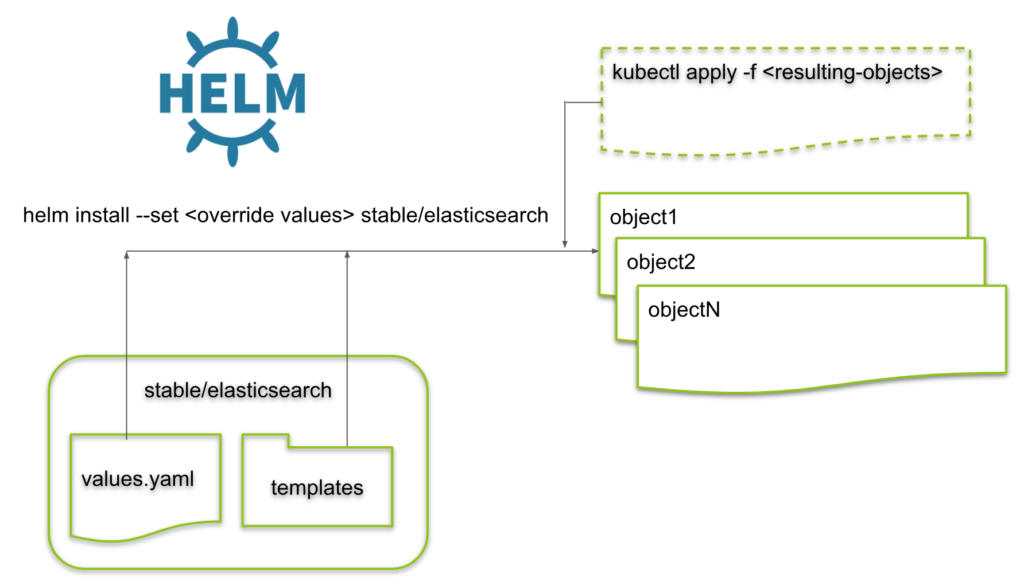
We are following https://github.com/helm/charts/tree/master/stable/elasticsearch:
$ cat 2_create_elasticsearch.sh

# output:
RELEASE=elasticsearch-v2
REPLICAS=1
MIN_REPLICAS=1
STORAGE_CLASS=my-local-storage-class
helm ls --all ${RELEASE} && helm del --purge ${RELEASE}

helm $CMD stable/elasticsearch \
      --name ${RELEASE} \
      --set client.replicas=${MIN_REPLICAS} \
      --set master.replicas=${REPLICAS} \
      --set master.persistence.storageClass=my-local-storage-class \
      --set data.replicas=${MIN_REPLICAS} \
      --set data.persistence.storageClass=${STORAGE_CLASS} \
      --set master.podDisruptionBudget.minAvailable=${MIN_REPLICAS} \
      --set cluster.env.MINIMUM_MASTER_NODES=${MIN_REPLICAS} \
      --set cluster.env.RECOVER_AFTER_MASTER_NODES=${MIN_REPLICAS} \
      --set cluster.env.EXPECTED_MASTER_NODES=${MIN_REPLICAS} \
      --namespace elasticsearch
You most probably will need to adapt the STORAGE_CLASS name to your situation or remove the corresponding storageClass option altogether.
Step 2: Apply the Helm Chart
Now let us apply the file:
$ bash 2_create_elasticsearch.sh
NAME            REVISIONUPDATED                 STATUS CHART               APP VERSIONNAMESPACE
elasticsearch-v2       Fri Feb 22 18:58:36 2019DELETEDelasticsearch-1.17.06.5.4      elasticsearch
release "elasticsearch-v2" deleted
NAME:   elasticsearch-v2
LAST DEPLOYED: Fri Feb 22 19:13:06 2019
NAMESPACE: elasticsearch
STATUS: DEPLOYED

RESOURCES:
==> v1/Service
NAME                        TYPE       CLUSTER-IP     EXTERNAL-IP  PORT(S)   AGE
elasticsearch-v2-client     ClusterIP  10.101.101.91         9200/TCP  1s
elasticsearch-v2-discovery  ClusterIP  None                  9300/TCP  1s

==> v1beta1/Deployment
NAME                     DESIRED  CURRENT  UP-TO-DATE  AVAILABLE  AGE
elasticsearch-v2-client  1        1        1           0          1s

==> v1beta1/StatefulSet
NAME                     DESIRED  CURRENT  AGE
elasticsearch-v2-data    1        1        0s
elasticsearch-v2-master  1        1        0s

==> v1/Pod(related)
NAME                                      READY  STATUS    RESTARTS  AGE
elasticsearch-v2-client-6474858f54-v69xc  0/1    Init:0/1  0         0s
elasticsearch-v2-data-0                   0/1    Pending   0         0s
elasticsearch-v2-master-0                 0/1    Pending   0         0s

==> v1/ConfigMap
NAME              DATA  AGE
elasticsearch-v2  4     1s

==> v1/ServiceAccount
NAME                     SECRETS  AGE
elasticsearch-v2-client  1        1s
elasticsearch-v2-data    1        1s
elasticsearch-v2-master  1        1s


NOTES:
The elasticsearch cluster has been installed.

Elasticsearch can be accessed:

  * Within your cluster, at the following DNS name at port 9200:

    elasticsearch-v2-client.elasticsearch.svc

  * From outside the cluster, run these commands in the same shell:

    export POD_NAME=$(kubectl get pods --namespace elasticsearch -l "app=elasticsearch,component=client,release=elasticsearch-v2" -o jsonpath="{.items[0].metadata.name}")
    echo "Visit http://127.0.0.1:9200 to use Elasticsearch"
    kubectl port-forward --namespace elasticsearch $POD_NAME 9200:9200
Step 3: Check the Solution
Step 3.1: Check the Volumes
If everything goes right, you will see that the persistent volumes are bound:
kubectl get pvc -n elasticsearch

# output:
NAME                             STATUS   VOLUME   CAPACITY   ACCESS MODES   STORAGECLASS             AGE
data-elasticsearch-v1-data-0     Bound    vol51    500Gi      RWO            my-local-storage-class   16m
data-elasticsearch-v1-master-0   Bound    vol54    500Gi      RWO            my-local-storage-class   16m
Step 3.2: Check the PODs
If so, also the PODs should come up after two or three minutes:
kubectl get pods -n elasticsearch

# output:
NAME                                      READY   STATUS    RESTARTS   AGE
elasticsearch-v1-client-79b76549c-prqz8   1/1     Running   0          15m
elasticsearch-v1-data-0                   1/1     Running   0          15m
elasticsearch-v1-master-0                 1/1     Running   0          15m
Step 3.3: Check the Health
Let us check the health of the installation via the cluster health URL. My first test had revealed a red status:
CLUSTER_IP=$(kubectl get svc -n elasticsearch | grep '.*-client' | awk '{print $3}') \
 && curl http://$CLUSTER_IP:9200/_cluster/health?pretty

# output:
{
  "cluster_name" : "elasticsearch",
  "status" : "red",
  "timed_out" : false,
  "number_of_nodes" : 3,
  "number_of_data_nodes" : 1,
  "active_primary_shards" : 0,
  "active_shards" : 0,
  "relocating_shards" : 0,
  "initializing_shards" : 0,
  "unassigned_shards" : 0,
  "delayed_unassigned_shards" : 0,
  "number_of_pending_tasks" : 0,
  "number_of_in_flight_fetch" : 0,
  "task_max_waiting_in_queue_millis" : 0,
  "active_shards_percent_as_number" : "NaN"
}
However, once I got the MIN_REPLICAS value right, the system has shown a yellow state:
CLUSTER_IP=$(kubectl get svc -n elasticsearch | grep '.*-client' | awk '{print $3}') \
  && curl http://$CLUSTER_IP:9200/_cluster/health?pretty

# output:
{
  "cluster_name" : "elasticsearch",
  "status" : "yellow",
  "timed_out" : false,
  "number_of_nodes" : 3,
  "number_of_data_nodes" : 1,
  "active_primary_shards" : 5,
  "active_shards" : 5,
  "relocating_shards" : 0,
  "initializing_shards" : 0,
  "unassigned_shards" : 5,
  "delayed_unassigned_shards" : 0,
  "number_of_pending_tasks" : 0,
  "number_of_in_flight_fetch" : 0,
  "task_max_waiting_in_queue_millis" : 0,
  "active_shards_percent_as_number" : 50.0
}
Note: the documentation says: „
yellowmeans that the primary shard is allocated but replicas are not.“ Since we have installed a single node cluster with no replicas,yellowis the best status value we can expect.
Step 4: Create a DB Entry
Now we can test, whether the ElasticSearch server is functional by adding some data:
CLUSTER_IP=$(kubectl get svc -n elasticsearch | grep '.*-client' | awk '{print $3}') \
  && TEMPLATE='{"testdata": "%s"}'  \
  && INDEX=testindex \
  && TYPE=testtype \
  && TESTVALUE=testvalue \
  && DATA="$(printf "$TEMPLATE" $TESTVALUE)" \
  && curl -X POST \
          -H 'Content-Type: application/json' \
          -d "$DATA" \
          $CLUSTER_IP:9200/$INDEX/$TYPE

# output:
{"_index":"testindex","_type":"testtype","_id":"aQOBSmkBXE6Pc5jNpSJF","_version":1,"result":"created","_shards":{"total":2,"successful":1,"failed":0},"_seq_no":0,"_primary_term":1}
Step 5: Read the DB Entries
We can read all available entries with the following command:
curl $CLUSTER_IP:9200/$INDEX/_search?pretty=true

# output:
{
  "took" : 14,
  "timed_out" : false,
  "_shards" : {
    "total" : 5,
    "successful" : 5,
    "skipped" : 0,
    "failed" : 0
  },
  "hits" : {
    "total" : 1,
    "max_score" : 1.0,
    "hits" : [
      {
        "_index" : "testindex",
        "_type" : "testtype",
        "_id" : "aQOBSmkBXE6Pc5jNpSJF",
        "_score" : 1.0,
        "_source" : {
          "testdata" : "testvalue"
        }
      }
    ]
  }
}
Step 6: Delete the Installation
Now let us delete the installation:
RELEASE=elasticsearch-v2
helm del ${RELEASE}
Note: you can add a
--purgeoption, if you wish to re-use the same RELEASE again. However, better increase the version number for the next version.
Also, note that the helm del command does not touch thee persistent volumes: therefore, you might need to delete persistent volume claims to move the corresponding persistent volumes from Bound state to Released state. Here an example for persistent volume claims that are still bound, and another set, that has been released with kubectl delete commands:
kubectl -n elasticsearch get pv | grep -v Available

# output:
NAME     CAPACITY   ACCESS MODES   RECLAIM POLICY   STATUS      CLAIM                                          STORAGECLASS             REASON   AGE
vol15    500Gi      RWO            Retain           Released    elasticsearch/data-elasticsearch-master-0      my-local-storage-class            12d
vol21    500Gi      RWO            Retain           Released    elasticsearch/data-elasticsearch-data-0        my-local-storage-class            12d
vol51    500Gi      RWO            Retain           Bound       elasticsearch/data-elasticsearch-v1-data-0     my-local-storage-class            4d14h
vol54    500Gi      RWO            Retain           Bound       elasticsearch/data-elasticsearch-v1-master-0   my-local-storage-class            12d
To move all persistent volumes of the node from „Released“ to „Available“ state, you can apply the shell script found on our GIT Repo named kubernetes-retain-released-volumes. It will wipe all data from „Released“ volumes. Use at your own risk.
Appendix: Troubleshooting Helm
If you want to know, which objects a helm install will create, you can perform the following steps:
Step A.1: Download or Clone the Helm Chart
git clone https://github.com/helm/charts
cd charts/stable/elasticsearch
Step A.2: Create Templating Results
Now we can create all YAML files helm will create during an installation process:
helm template charts/stable/elasticsearch \
      --name ${RELEASE} \
      --set client.replicas=${MIN_REPLICAS} \
      --set master.replicas=${REPLICAS} \
      --set master.persistence.storageClass=my-local-storage-class \
      --set data.replicas=${MIN_REPLICAS} \
      --set data.persistence.storageClass=${STORAGE_CLASS} \
      --set master.podDisruptionBudget.minAvailable=${MIN_REPLICAS} \
      --set cluster.env.MINIMUM_MASTER_NODES=${MIN_REPLICAS} \
      --set cluster.env.RECOVER_AFTER_MASTER_NODES=${MIN_REPLICAS} \
      --set cluster.env.EXPECTED_MASTER_NODES=${MIN_REPLICAS} \
      --namespace elasticsearch | less

# output:
---
# Source: elasticsearch/templates/configmap.yaml
apiVersion: v1
kind: ConfigMap
metadata:
  name: elasticsearch-v1
  labels:
    app: elasticsearch-v1
    chart: "elasticsearch-1.21.1"
    release: "elasticsearch-v1"
    heritage: "Tiller"
data:
  elasticsearch.yml: |-
    cluster.name: elasticsearch

    node.data: ${NODE_DATA:true}
    node.master: ${NODE_MASTER:true}
    node.ingest: ${NODE_INGEST:true}
    node.name: ${HOSTNAME}
...
Now the YAML file can be reviewed. Also, you can install the YAML files step by step by applying them as follows:
kubectl create namespace <yournamespace>
kubectl -n <yournamespace> apply -f <YAML-File>
The status of the created objects can be inspected with a describe command:
kubectl -n <yournamespace> describe <kind> <name>
Here, the kind and name can be read from the YAML file or can be taken from the „created“ message after the apply command.
The corresponding objects can be deleted again with:
kubectl -n <yournamespace> delete -f <YAML-File>

One comment