
When dealing with performance, it’s hard to remember all the tools that might help you out during development. For that purpose, we’ve compiled a list of 23 performance tools for your reference. Some you’ll have heard of, others probably not. Some have been covered in detail in our performance month, others are yet to be covered future articles; but all are very useful and should be part of your arsenal.
Client-side Performance Tools
1. Test your Mobile Speed with Google
Google’s Test My Site is an online tool offered by Google and powered by the popular website performance tool WebPageTest.org.

You can either visualize your report on site or have it emailed to you via your email address.
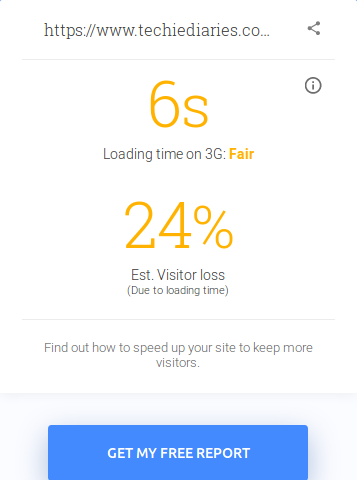
The tool gives you your website loading time (or Speed Index) calculated using a Chrome browser on a Moto G4 device within a 3G network. It also gives you the estimated percentage of visitors lost due to loading time. Among other things it also:
- compares your site speed with the top-performing sites in your industry
- gives you top fixes that can help you speed up your website loading time.
2. SiteSpeed.io
SiteSpeed.io is an open-source tool — or a set of tools — that can help you measure your website performance and improve it.

- Coach: gives you performance advice and fixes for your website based on best practices.
- Browsertime: collects metrics and HAR files from your browser.
- Chrome-HAR: helps you compare HAR files.
- PageXray: extracts different metrics (from HAR files) such as size, number of requests, and so on.
You can install these tool(s) using npm:
npm install sitespeed.io -g
sitespeed.io --help
Or Docker:
docker run --shm-size=1g --rm -v "$(pwd)":/sitespeed.io sitespeedio/sitespeed.io https://www.sitespeed.io/ --video --speedIndex
3. Lighthouse by Google
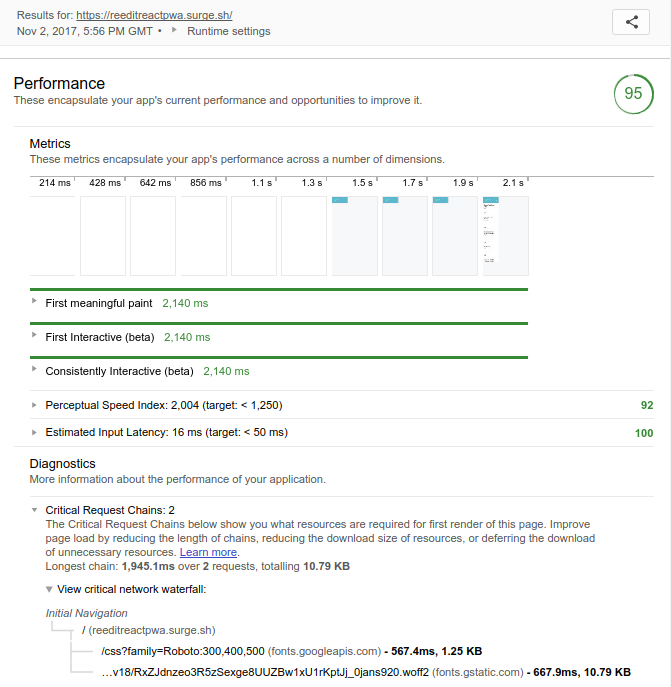
Lighthouse is an open-source tool for running audits to improve web page quality. It’s integrated into Chrome’s DevTools and can be also installed as a Chrome extension or CLI-based tool. It’s an indispensable tool for measuring, debugging and improving the performance of modern, client-side apps (particularity PWAs).
You can find the extension from the Chrome Web Store.
Or you can install Lighthouse, from npm, on your system with:
npm install -g lighthouse
Then run it with:
lighthouse <url>
You can use Lighthouse programmatically to build your own performance tool or for continuous integration.
Make sure to check these Lighthouse-based tools:
- webpack-lighthouse-plugin: a Lighthouse plugin for Webpack
- treo: Lighthouse as a service with a personal free plan.
- calibreapp: a paid service, based on Lighthouse, that helps you track, understand and improve performance metrics using real Google Chrome instances.
- lighthouse-cron: a module which can help you track your Lighthouse scores and metrics overtime.
We’ve got an in-depth look at Lighthouse in our PWA performance month post.
4. Lightcrawler
You can use Lightcrawler to crawl your website then run each page found through Lighthouse.
Start by installing the tool via npm:
npm install --save-dev lightcrawler
Then run it from the terminal by providing the target URL and a JSON configuration file:
lightcrawler --url <url> --config lightcrawler-config.json
The configuration file can be something like:
{
  "extends": "lighthouse:default",
  "settings": {
    "crawler": {
      "maxDepth": 2,
      "maxChromeInstances": 5
    },
    "onlyCategories": [
      "Performance",
    ],
    "onlyAudits": [
      "accesskeys",
      "time-to-interactive",
      "user-timings"
    ]
  }
}
5. YSlow
YSlow is a JavaScript bookmarklet that can be added to your browser and invoked on any visited web page. This tool analyzes web pages and helps you discover the reasons for slowness based on Yahoo’s rules for high-performance websites.
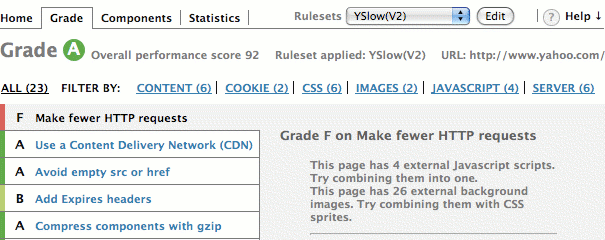
You can install YSlow by dragging and dropping the bookmarklet to your browser’s bookmark bar. Find more information here.
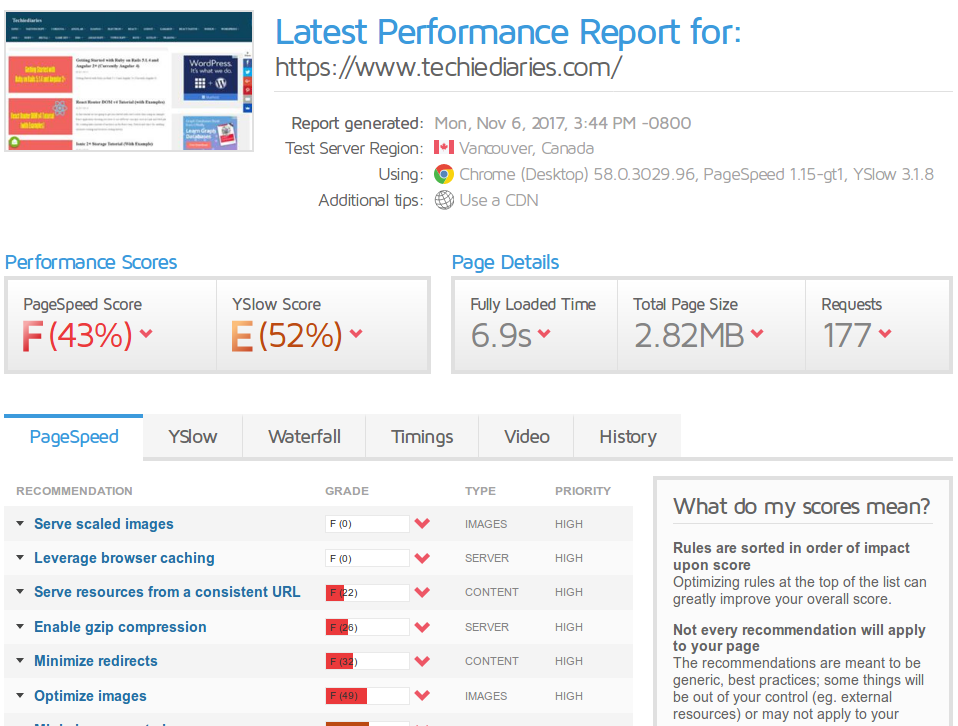
6. GTmetrix
GTmetrix is an online tool that gives you insights into your website performance (fully loaded time, total page size, number of requests etc.) and also practical recommendations on how to optimize it.
7. Page Performance
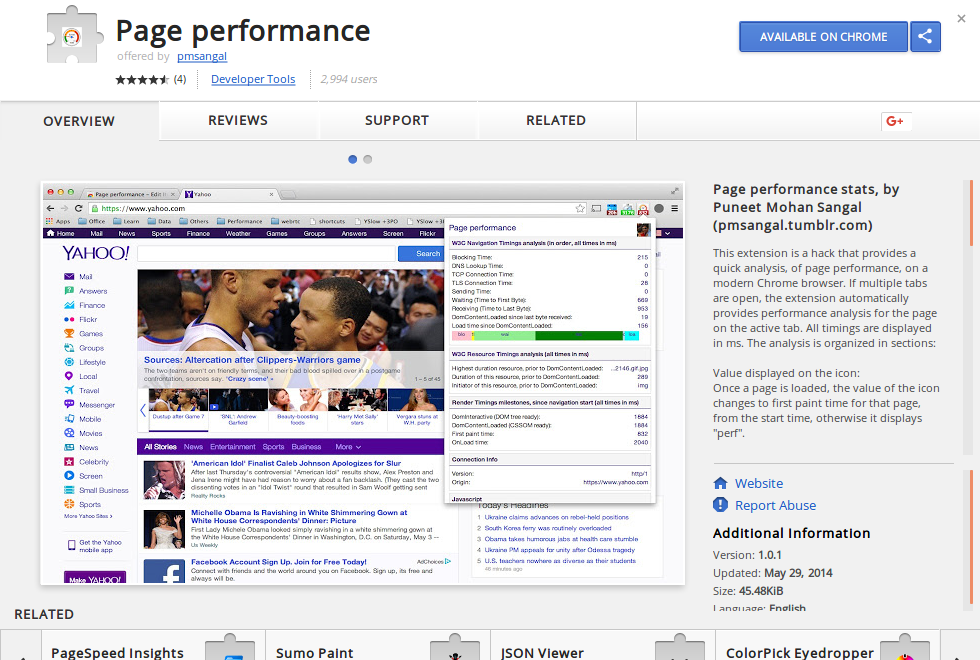
Page performance is a Chrome extension that can be used to run a quick performance analysis. If you have many tabs open, the extension will be invoked on the active tab.
8. The AMP Project
The AMP (Accelerated Mobile Pages) project is an open-source project that aims to make the web faster. The AMP project enables developers to create websites that are fast, high-performing and with great user experiences across all platforms (desktop browsers and mobile devices).

The AMP project is essentially three core components:
- AMP HTML: it’s HTML but with some restrictions to guarantee reliable performance.
- AMP JS: a JavaScript library that takes care of rendering AMP HTML.
- AMP Cache: a content delivery network for caching and delivering valid AMP pages. You can use tools such as AMP Validator or amphtml-validator to check if your pages are valid AMP pages.
Once you add AMP markup to your pages, Google will discover them automatically and cache them to deliver them through the AMP CDN. You can learn from here how to create your first AMP page.
Code-level Performance Tools
9. Dust Me Selectors
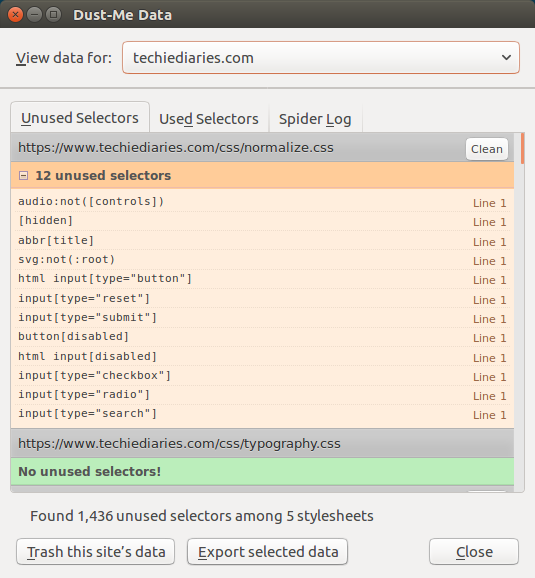
Dust Me Selectors is a browser extension that can help you discover and remove the unused CSS selectors in your web pages. It scans all style sheets, then organizes the found selectors into used and unused selectors, which will tell you exactly what CSS is used or not used on the scanned page.
10. Penthouse
Penthouse is a critical path CSS generator that allows you to get the required CSS for rendering the above-the-fold content of a specified page. You only need to specify your website’s full CSS file and a target page.
You can install Penthouse with npm:
npm install penthouse
There’s also an online version of this tool available.
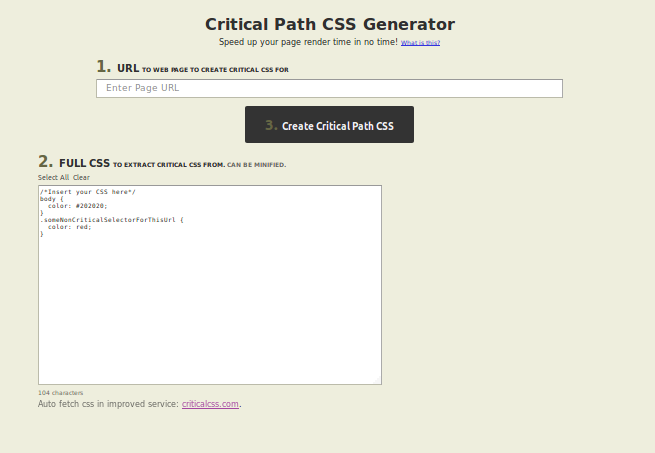
For an improved, paid service for this tool, make sure to check out this one.
11. Critical
Critical is a Node.js tool created by Addy Osmani to help you extract and inline critical-path CSS in your HTML pages. You can install it from npm:
npm install -g critical
critical test/fixture/index.html --base test/fixture > critical.css
Critical can be used as a CLI tool or can be integrated with build systems such as Gulp.
12. Optimize-js
You can use Optimize-js to optimize JavaScript code for faster initial load by wrapping immediately-invoked functions in parentheses.
This tool can be installed from npm:
npm install -g optimize-js
You can then use it via your CLI:
optimize-js input.js > output.js
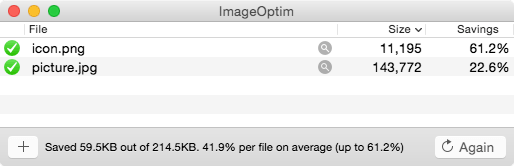
13. Image Optimization Tools
ImageOptim
ImageOptim is a free and open-source app for Mac that optimizes images for size. It’s also available as a paid online service.

Pngcrush
Pngcrush is a free and open-source PNG optimizer available for Windows and Linux.
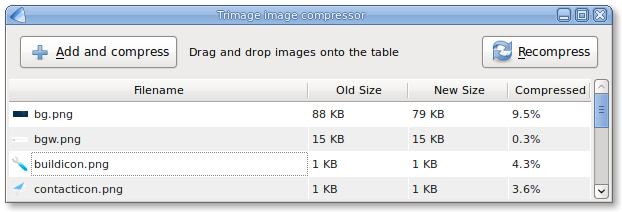
Trimage
Trimage is a cross-platform and free tool for losslessly optimizing PNG and JPG files.

Server-side Performance Tools
14. Apachetop
Apachetop is a tool inspired by top and based on mytop which can be used to monitor the performance of your Apache web server. It can be used to display current numbers of writes, reads and requests processed.
For Debian-based systems you can install apachetop with apt:
sudo apt-get install apachetop
For Red Hat and CentOS-based systems, enable EPEL repository in order to install apachetop, then use yum package manager:
sudo yum -y install epel-release
sudo yum clean all
sudo yum -y update
sudo yum -y install apachetop
You can then use it by providing the log file of your Apache server:
apachetop -f /var/log/apache2/access.log
Make sure you have the permission to read the log file.
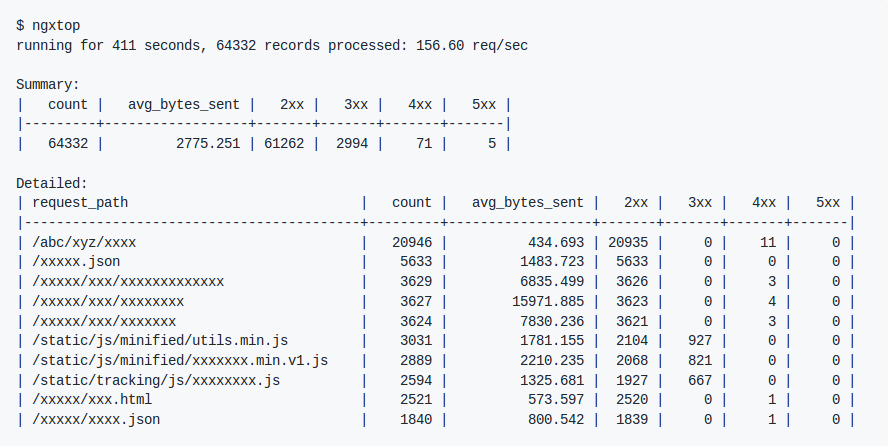
15. Ngxtop
Ngxtop is a top-like tool, based on Python, that parses your Nginx server access log and outputs important metrics such as active request, total requests by status code, top remote IPs and average bytes sent in real time. Ngxtop can also be used to parse Apache access log.
Here an example default output from Ngxtop:
Make sure you have Python and PIP package manager installed on your system, then run the following to install Ngxtop:
pip install ngxtop
ngxtop -h
You can also check out these similar tools:
- Ngx-top: an alternative to Ngxtop built using Haskell.
- Luameter: a commercial Lua module for Nginx that provides key performance metrics for monitoring Nginx in real time.
16. uptime-cli
Uptime-cli is a CLI tool for monitoring your website’s uptime with the Uptime Robot API.
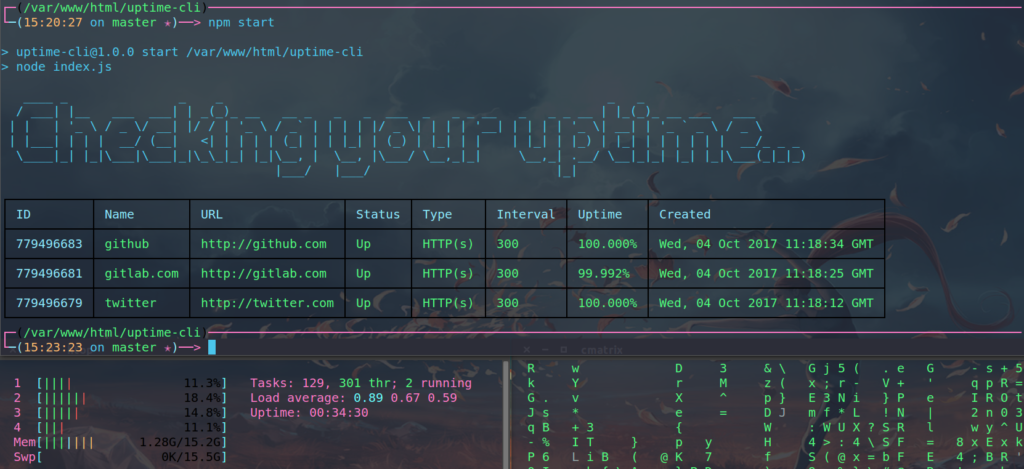
You can install the tool from npm:
npm install -g uptime-cli
SQL Performance Tools
17. Tuning-primer
Tuning-primer is a modern MySQL performance tuning Bash script for MySQL version 5.5 or above.
It’s based on the MySQL performance tuning primer script version 1.6-r1.
wget https://github.com/RootService/tuning-primer/blob/master/tuning-primer.sh
chmod +x tuning-primer.sh
18. MySQLTuner
MySQLTuner is a script written in Perl that analyzes your MySQL server performance, then shows you recommendations based on the information it finds. These recommendations are simply the tuning of the configuration variables (found in /etc/mysql/my.cnf file) to make MySQL’s server work more efficiently.
You can grab the MySQLTuner script from mysqltuner.com using a tool like wget:
wget http://mysqltuner.com/mysqltuner.pl
chmod +x mysqltuner.pl
./mysqltuner.pl --help
19. Mytop
Mytop is a top-like CLI tool for displaying MySQL server performance by connecting to the server and periodically running both show processlist and show status commands. It then summarizes the information.
For Debian-based systems, you can use apt-get to install mytop:
sudo yum -y install epel-release
sudo yum clean all
sudo yum -y update
sudo apt-get install mytop
For Red Hat and Centos-based systems, enable EPEL repository in order to install Mytop, then use yum package manager:
sudo yum install mytop
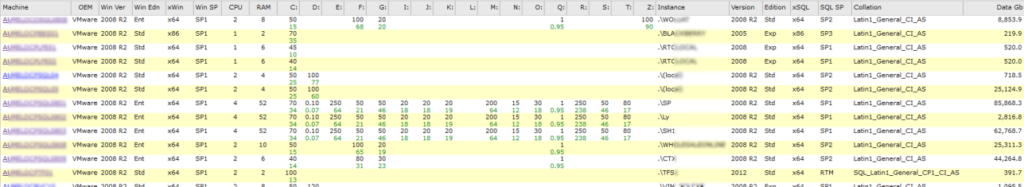
20. SQLBenchmarkPro
SQLBenchmarkPro is a free cloud service that can remotely monitor your database and SQL Servers for small and big businesses. It works by installing an SQLBenchmarkPro agent locally, which continuously monitors the performance and health of your servers.
Load Testing Tools
21. Apache JMeter
Apache JMeter is an open-source tool built with Java by Stefano Mazzocchi of the Apache Software Foundation. It can be used for load testing and for performance measurements.
Since JMeter is built with Java, it’s available under all major platforms such as Windows, Linux and macOS.
Make sure you have Java installed, then head over to this page to download JMeter. You can then start JMeter, either in GUI mode, server mode or command-line mode from different scripts in the bin folder.
22. Grinder
Grinder is a load testing framework built using Java that can be used to run distributed load testings with many load injector machines. It’s an open-source tool available a BSD-style license.
You can use Grinder to load test anything from HTTP servers to SOAP services and REST APIs, but also application servers of CORBA, RMI, JMS and EJBs etc.
You can flexibly write scripts for the Grinder framework using powerful scripting languages such as Jython and Closure. Find more information from the official SourceForge page.
Grinder is available for free download from SourceForge.net.
23. Gatling
Gatling is a load testing tool that you can use to load test your web application by simulating thousands of requests per second using a few machines.
Gatling can be scripted using the Scala language and a simple DSL language that can cover most of your needs.
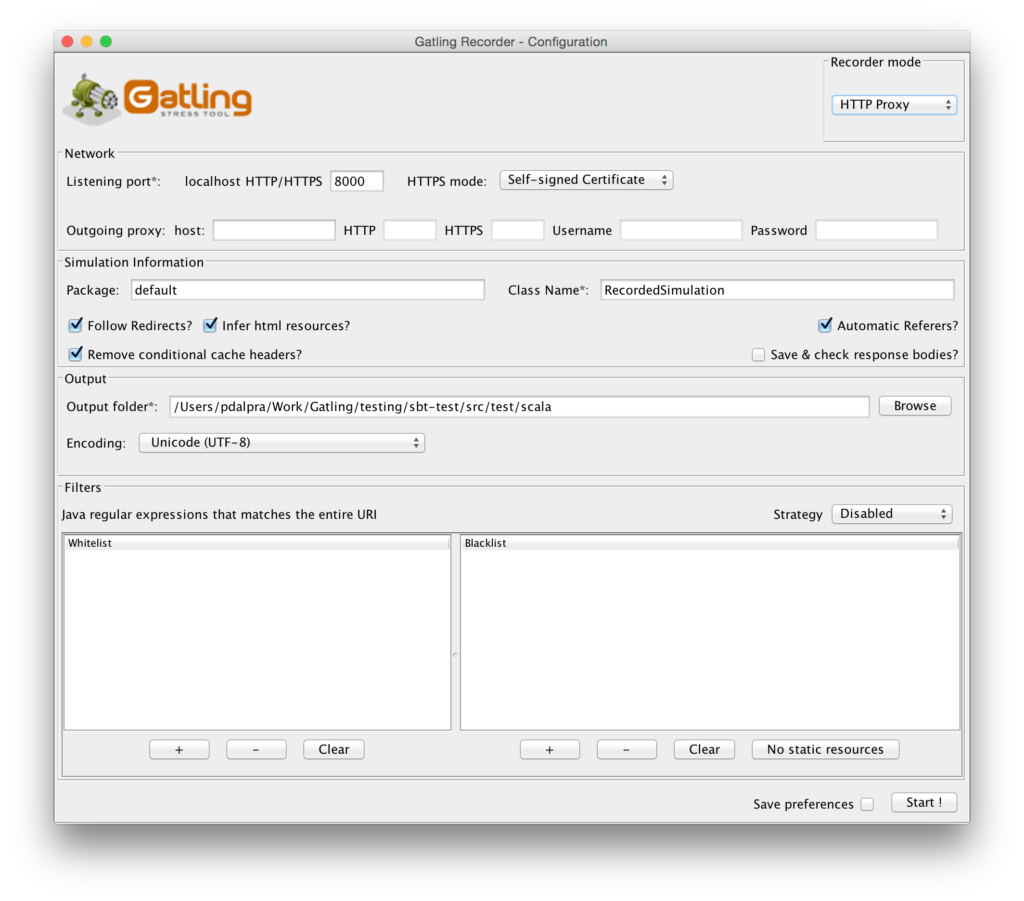
You can download Gatling from the official Gatling website, then simply unzip the bundle and run the tool from the various scripts in the bin folder.
Wrap Up
This list is far from complete, so if you have any preferred tool(s) for analyzing or tuning the performance of your web applications, ping me on Twitter!
Frequently Asked Questions (FAQs) about Development Tools for Boosting Website Performance
What are the key features to look for in a website performance boosting tool?
When choosing a website performance boosting tool, there are several key features to consider. Firstly, the tool should provide comprehensive performance metrics, including page load time, time to first byte, and render-blocking resources. Secondly, it should offer actionable recommendations for improving performance, such as optimizing images, minifying CSS and JavaScript, and leveraging browser caching. Additionally, the tool should support automated performance testing, allowing you to monitor your website’s performance over time and identify any potential issues before they impact your users. Finally, the tool should be easy to use, with a user-friendly interface and clear, understandable reports.
How can Google Lighthouse help improve my website’s performance?
Google Lighthouse is a powerful tool for improving website performance. It provides a detailed performance audit, highlighting areas where your website is performing well and where there’s room for improvement. Lighthouse analyzes various aspects of your website, including load times, accessibility, and SEO. It also provides specific, actionable recommendations for improving performance, such as reducing server response times, eliminating render-blocking resources, and optimizing images. By following these recommendations, you can significantly improve your website’s performance and user experience.
Are there any free alternatives to Google Lighthouse?
Yes, there are several free alternatives to Google Lighthouse. These include GTmetrix, Pingdom, and WebPageTest. These tools offer similar functionality to Lighthouse, providing detailed performance audits and actionable recommendations for improving your website’s performance. However, each tool has its own strengths and weaknesses, so it’s worth trying out a few different options to see which one best meets your needs.
How does website performance impact SEO?
Website performance plays a crucial role in SEO. Google considers page load time as a ranking factor, meaning that faster websites are more likely to rank higher in search results. Additionally, a slow-loading website can lead to a higher bounce rate, as users are likely to leave if a page takes too long to load. This can negatively impact your website’s SEO, as Google considers bounce rate when determining search rankings. By improving your website’s performance, you can enhance your SEO and attract more organic traffic.
How can I automate performance testing for my website?
Automating performance testing can be achieved using tools like Google Lighthouse, GTmetrix, or Pingdom. These tools allow you to schedule regular performance audits and receive reports detailing your website’s performance. This can help you monitor your website’s performance over time, identify any potential issues before they impact your users, and track the effectiveness of your performance optimization efforts.
What is render-blocking JavaScript and CSS, and how can it impact my website’s performance?
Render-blocking JavaScript and CSS are files that prevent a webpage from displaying until they have been fully downloaded and processed. This can significantly slow down page load times, leading to a poor user experience. Tools like Google Lighthouse can help identify any render-blocking resources on your website and provide recommendations for eliminating them, such as inlining critical CSS and deferring non-critical JavaScript.
How can I optimize images to improve my website’s performance?
Image optimization is a crucial aspect of website performance. This can be achieved by compressing images, using the correct image format, and implementing lazy loading. Tools like Google Lighthouse can provide specific recommendations for optimizing your images, helping to reduce page load times and improve user experience.
What is time to first byte (TTFB), and why is it important?
Time to first byte (TTFB) is a measurement of how long it takes for a user’s browser to receive the first byte of data from your server. A high TTFB can indicate server-side issues, such as slow server response times or network latency, which can negatively impact your website’s performance. Tools like Google Lighthouse can help identify and address any issues with your TTFB, helping to improve your website’s performance and user experience.
How can I leverage browser caching to improve my website’s performance?
Browser caching involves storing static files, like CSS, JavaScript, and images, in a user’s browser. This can significantly improve page load times, as the browser doesn’t need to re-download these files each time the user visits your website. Tools like Google Lighthouse can provide recommendations for leveraging browser caching, helping to improve your website’s performance.
What is minification, and how can it improve my website’s performance?
Minification involves removing unnecessary characters, like whitespace and comments, from your code. This can significantly reduce the size of your CSS, JavaScript, and HTML files, leading to faster page load times. Tools like Google Lighthouse can help identify any unminified resources on your website and provide recommendations for minifying them, helping to improve your website’s performance.
 Ahmed Bouchefra
Ahmed is a technical author and web developer living in Morocco with a Master's degree in software development. He authors technical content about JavaScript, Angular and Ionic. He is also a fan of entrepreneurship, poetry, and teaching. You can contact me on my personal website and read my other articles on Techiediaries.


