Evidence-based election campaigning
I was at a hackathon on evidence-based election campaigning yesterday, organized by Campaign Lab.
My previous experience with political oriented hackathons was a Lib Dem hackathon; the event was only advertised to party members and I got to attend because a fellow hackathon-goer (who is a member) invited me along. We spent the afternoon trying to figure out how to extract information on who turned up to vote, from photocopies of lists of people eligible to vote marked up by the people who hand out ballot papers.
I have also been to a few hackathons where the task was to gather and analyze information about forthcoming, or recent, elections. There did not seem to be a lot of information publicly available, and I had assumed that the organization, and spending power, of the UK’s two main parties (i.e., Conservative and Labour) meant that they did have data.
No, the main UK political parties don’t have lots of data, in fact they don’t have very much at all, and make hardly any use of what they do have.
I had a really interesting chat with Campaign Lab’s Morgan McSweeney, about political campaigning, and how they have not been evidence-based. There were lots of similarities with evidence-based software engineering, e.g., a few events (such the Nixon vs. Kennedy and Bill Clinton elections) created campaigning templates that everybody else now follows. James Moulding drew diagrams showing Labour organization and Conservative non-organization (which looked like a Dalek) and Hannah O’Rourke spoiled us with various kinds of biscuits.
An essential component of evidence-based campaigning is detailed knowledge of the outcome, such as: how many votes did each candidate get? Based on past hackathon experience, I thought this data was only available for recent elections, but Morgan showed me that Wikipedia had constituency level results going back many years. Here was a hackathon task; collect together constituency level results, going back decades, in one file.
Following the Wikipedia citations led me to Richard Kimber’s website, which had detailed results at the constituency level going back to 1945. The catch was that there was a separate file for each constituency; I emailed Richard, asking for a file containing everything (Richard promptly replied, the only files were the ones on the website).
Pivot.
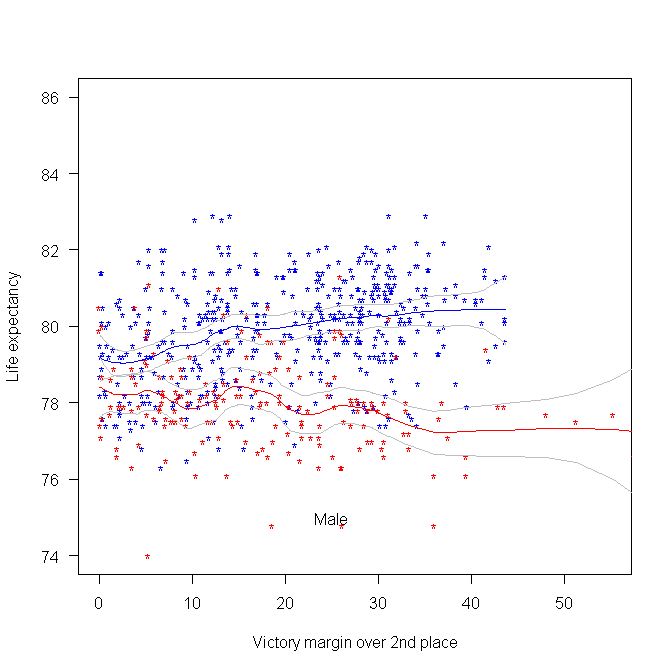
The following plot was created using some of the data made available during a hackathon at the Office of National Statistics (sometime in 2015). We (Pavel+others and me) did not make much use of this plot at the time, but it always struck me as interesting. I showed it to the people at this hackathon, who sounded interested. The plot shows the life-expectancy for people living in a constituency where Conservative(blue)/Labour(red) candidate won the 2015 general election by a given percentage margin, over the second-placed candidate.

Rather than scrape the election data (added to my TODO list), I decided to recreate the plot and tidy up the associated analysis code; it’s now available via the CampaignLab Github repo
My interpretation of the difference in life-expectancy is that the Labour strongholds are in regions where there is (or once was) lots of heavy industry and mining; the kind of jobs where people don’t live long after retiring.
“We spent the afternoon trying to figure out how to extract information on who turned up to vote, from photocopies of lists of people eligible to vote marked up by the people who hand out ballot papers.”
marked up lists of people eligible to vote sounds illegal to me.
@nickj
GDPR has probably made it illegal now. I have never been asked to give permission for anybody to be told I voted.