
Published on 24 Jan 2019
.jpg?width=200&name=Payara%20ECE%202018%20sponsor%20(2).jpg)
Logging is one of the key concepts for successfully running your applications. It tells you what your application and server is doing. And of course, logging is the first place you should look when things go wrong.
In this getting started blog around logging, I will explain you the basic concepts of the Payara Server logging module. This should help you get started in the logging journey. (Click here to read the rest of our Getting Started blog posts).

Server Logging
The blog describes the logging aspects of the Payara Server itself, how the Log service works and how you can configure it to your needs.
When your application uses the java.util.logger package directly or indirectly, through the SLF4J to JUL bridge for example, then the application log entries will be handled by this Log service also.
But you can decide to use a separate logging mechanism, using LogBack or Log4J2 for example, for your application logging which is not discussed here. (Payara support customers can access the Knowledgebase for an article about How to Use Log4J2 with Payara).
Architecture
A few words on the architecture of the Log Service. When the server code writes a log entry, it is first captured in a buffer. A separate thread is then writing these entries to the file on disk.
There are several reasons for this separation:
- It prevents several threads from writing to the file which isn't working at the same time.
- The writing to the file does not impact the server as it is performed in different threads.
You can optimize the number of flushes to the file by setting the parameter `Flush Frequency` (see next section). In the case there are more entries in that buffer, they are flushed in one go to the file which is a bit more optimal than doing this one by one.
The File
The first important thing we need to know is, where is the log file located? So to know the answer to this question, let us have a look at the Administration Console located at URL http://locahost:4848.
So select in the tree menu on the left of the screen, the Logger Settings page (Configurations > server-config > Logger Settings).
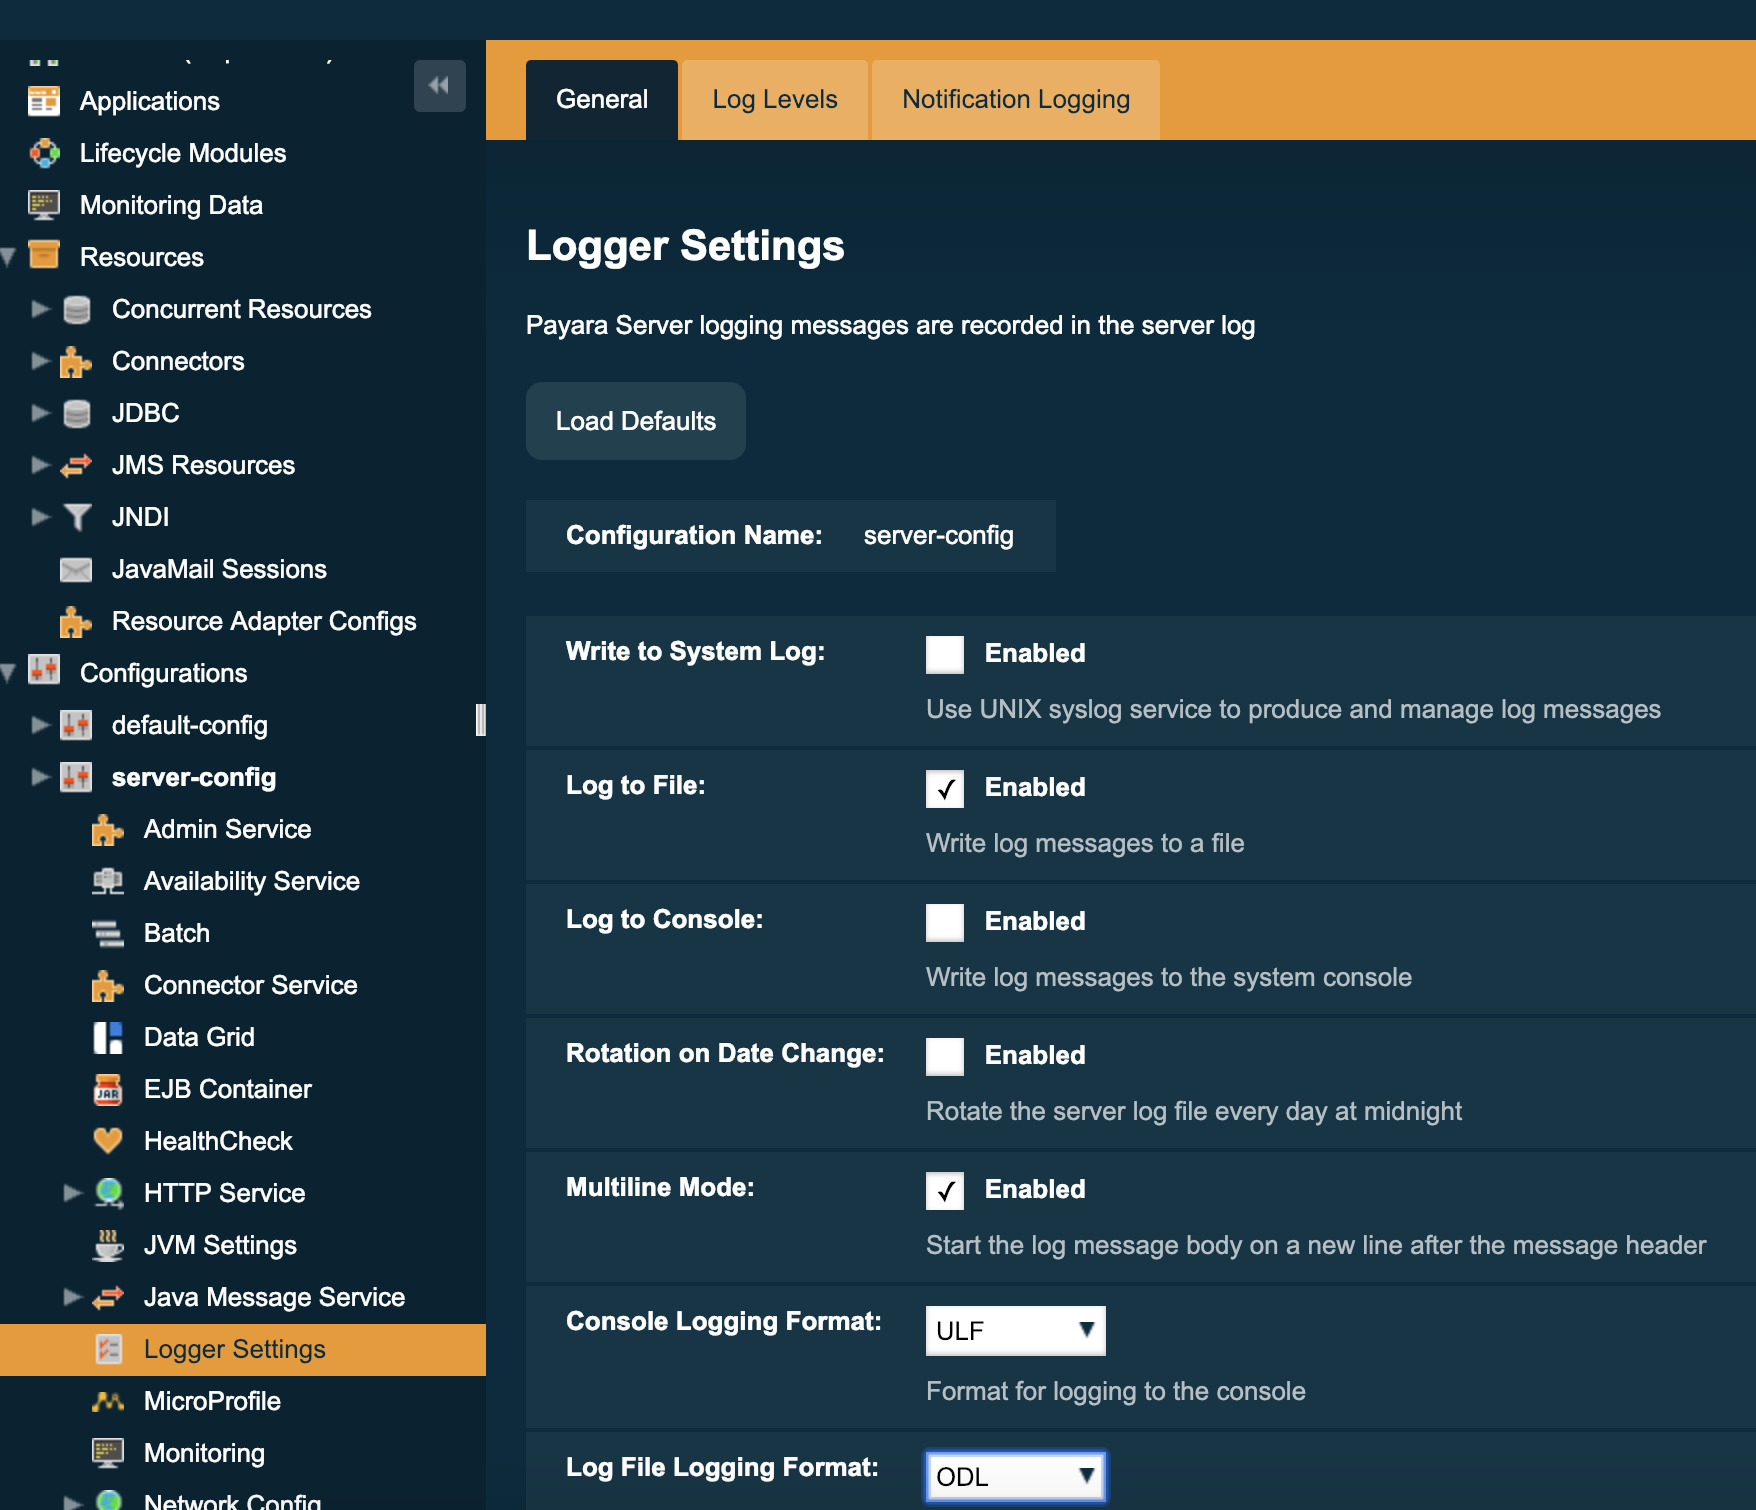
On the General tab you can find the text box which indicates where the log file is written. It should say something like:
Log file : ${com.sun.aas.instanceRoot}/logs/server.log
By default, the log file is written within the domain which we have started and the variable ${com.sun.aas.instanceRoot} contains the reference to this domain. So you can find this server log within the installation directory of Payara <PAYARA-HOME>/glassfish/domains/<DOMAIN>/logs/server.log.
By changing the value of the text box and saving the changes, you can use a different file name or location of this Server Log file.
You can choose a path relative to the domain, as in the default which uses that variable reference, but you can also use any other relative or absolute reference.
Another important aspect of the file is the size of it. It is impractical that this size would grow into several megabytes. Difficult to find something in it, not to mention to open it.
Therefore a rotation based on the size (about 2 Mb) is the default, but other options are possible.
By activating the `Rotation on Date Change` the Log Service creates a log file for each day. The size limitation is still applicable in this daily rotation scheme. So it is possible that you end up with several files for a day unless you disable the size limited rotation (set a value of zero)
Another rotation option is to set the `File Rotation Time Limit` to the number of minutes the rotation must occur.
With the Maximum History Files parameter, we can define how much 'old' server log files we like to keep. The default value is 0, meaning that Payara Server itself doesn't clean up these files. So be careful if you keep this default setting that the disk isn't filled up with log files in production.
The LogViewer
There are several ways you can have a look at the log file.
- Use some tool to look at the file like NotePad, Atom, etc ...
- Use a specialized stack to centralize the log files like the ELK stack.
- Use the LogViewer of the Administration Console
You can have a look at the Server Log files from within the Administration Console. You can do this in either the raw format, the contents as it is, or the Log Viewer where you can search and filter the different log items.
You can find the Log Viewer within the Server page within the Administration Console.
When you click on the `View Log Files` button, you get a popup window where you can specify the following search criteria:
- Containing a certain text
- The time period
- The level, like INFO etc (see further on)
- The instance (Domain server itself or instances when you have a clustered setup)
This is a handy way to view log files if you like to search for errors or what output is generated within a certain time period.
The Format
The log item entries are structured in a certain format. This allows the Log Viewer (or any other tooling like a log aggregation tool) to parse it and understand the log data. There are 3 formats supported; ODL, ULF, and JSON
ODL : Oracle Diagnostic Log Format (Log Working Group in Oracle)
Example
[2019-01-18T13:10:02.420+0100] [Payara 5.184] [INFO] [NCLS-LOGGING-00009] [javax.enterprise.logging] [tid: _ThreadID=31 _ThreadName=RunLevelControllerThread-1547813402253] [timeMillis: 1547813402420] [levelValue: 800] [[ Running Payara Version: Payara Server 5.184.1 #badassfish (build 90)]]
The format uses brackets as delimiter and has a few required fields. The overall format is:
[[timestamp] [organization ID] [Message Type/Level] [Message ID] [Logger Name] [Thread ID] [User ID] [ECID] [Extra Attributes] [Message]]
ULF : Uniform Log Format (Log Working Group in Java Webservices Org.)
Example
[#|2019-01-18T13:10:02.420+0100|INFO|Payara 5.184|javax.enterprise.logging|_ThreadID=31;_ThreadName=RunLevelControllerThread-1547817813642;_TimeMillis=1547817813766;_LevelValue=800;_MessageID=NCLS-LOGGING-00009;| Running Payara Version: Payara Server 5.184.1 #badassfish (build 90)|#]
As you can see, this format is very similar but uses another delimiter. The overall format is
"[#|DATETIME|LOG_LEVEL|PRODUCT_ID|LOGGER NAME|OPTIONAL KEY VALUE PAIRS| MESSAGE|#]\n"
JSON : JavaScript Object Notation
Example
{"Timestamp":"2019-01-18T14:30:25.465+0100","Level":"INFO","Version":"Payara 5.184","LoggerName":"javax.enterprise.logging","ThreadID":"31","ThreadName":"RunLevelControllerThread-1547818225353","TimeMillis":"1547818225465","LevelValue":"800","MessageID":"NCLS-LOGGING-00009","LogMessage":"Running Payara Version: Payara Server 5.184.1 #badassfish (build 90)"}
And also JSON is supported which has the advantage, or disadvantage depending on how you look at it, that the field names are part of the JSON.
The default for mat for the server log file is the ODL format. But it can be changed on the same configuration page within the Administration Console.
The Content
The last concept I want to discuss in this blog are the Log Levels. Not all log messages are written by default to the file. The Payara Server code also contains a lot of log messages which are handy during the development and research for a potential issue. But they will only grow the size of the file and doesn't have any added value. In fact, they make finding the actual information harder because of the vast amount of information.
These Log levels can be set for each part of the server separately. Have a look at the configuration page within the Administration Console. Next to that General tab on the Logger Settings page, you have the Log Levels page (See the screenshot within the `The File` section. There you can see for each logger, the configured Log Level.)
You can change the value which will result than in more or fewer log entries (depending on which log Level you have chosen). You can also add your own logger names used within the application if you decided to use the Log Service of Payara Server to handle your Application logging.
Additional Log Service Items to Consider
Some small things you should also know about the Log Service:
- Besides the usage of the Administration Console, you can also change the configuration using the asadmin Command Line tool. A good starting point for this are the Administering Payara Server 5 with the CLI and Asadmin Recorder - New Payara Server Feature Demo blog.
- The Log System can also be used to write the Notifications from the Monitoring Services. See the online documentation about this feature.
- You can also log each request to the server with the Access Log facilities.
- Logging within Payara Micro is performed by the same Log Service but needs to be configured differently (since there is no Administration Console). Payara Micro can also be adjusted to use other logging frameworks like Logback and Log4J2.
Configure Log Service with Payara Server
With the Payara Server, every aspect of the Log Service can be configured to your needs. You can define where the log file is written, how the rotation of this file is performed (so that it doesn't get too big), which format is used to write the Log entries, and which Levels are written to it.
With the Log Viewer, you can search these log files so that you can find those log entries that you were looking for in a very easy and powerful way.
