
A Short Speed History of Rails "Hello, World"
/I’ve enjoyed working on Rails Ruby Bench, and I’m sure I’ll continue doing so for years yet. At the very least, Ruby 3x3 isn’t done and RRB has more to say before it’s finished. But…
RRB is very “real world.” It’s complicated. It’s hard to set up and run. It takes a very long time to produce results — I often run larger tests all day, even for simple things like how fast Ruby 2.6 is versus 2.5. Setting up larger tests across many Ruby versions is a huge amount of work. Now and then it’s nice to sit back and do something different.
I’m working on a simpler benchmark, something to give quicker results and be easier for other people to run. But that’s not something to just write and call done - RRB has taken awhile, and I’m sure this one will too. Like all good software, benchmarks tend to develop step by step.
So: let’s take some first steps and draw some graphs. I like graphs.
If I’m going to ask how fast a particular operation is across various Rubies… Let’s pick a nice simple operation.
Ruby on Rails “Hello, World”
I’ve been specializing in Rails benchmarks lately. I don’t see any reason to stop. So let’s look at the Ruby on Rails equivalent of “Hello, World” - a controller action that just returns a static string. We’ll use a single version of Rails so that we measure the speed of Ruby, not Rails. It turns out that with minor adjustments, Rails 4.2 will run across all Rubies from 2.0.0p0 up through 2.6’s new-as-I-write-this release candidate. So that’s what we’ll use.
There are a number of fine load-testing applications that the rest of the world uses, while I keep writing my little RestClient-based scripts in Ruby. How about we try one of those out? I’m thinking ApacheBench.
I normally run quick development tests on my Mac laptop and more serious production benchmarks on EC2 large dedicated instances running Ubuntu. By and large, this has worked out very well. But we’ll start out by asking, “do multiple runs of the benchmark say the same thing? Do Mac and Ubuntu runs say the same thing?”
In other words, let’s check basic stability for this benchmark. I’m sure there will be lots of problems over time, but the first question is, does it kind of work at all?
A Basic Setup
In a repo called rsb, I’ve put together a trivial Rails test app, a testing script to run ApacheBench and a few other bits and bobs. There are also initial graphing scripts in my same data and graphing repository that I use for all my Rails Ruby Bench graphs.
First off, what does a simple run-on-my-Mac version of 10,000 tiny Rails requests look like on different Ruby versions? Here’s what I got before I did any tuning.

Ah yes, the old “fast fast fast oh god no” pattern.
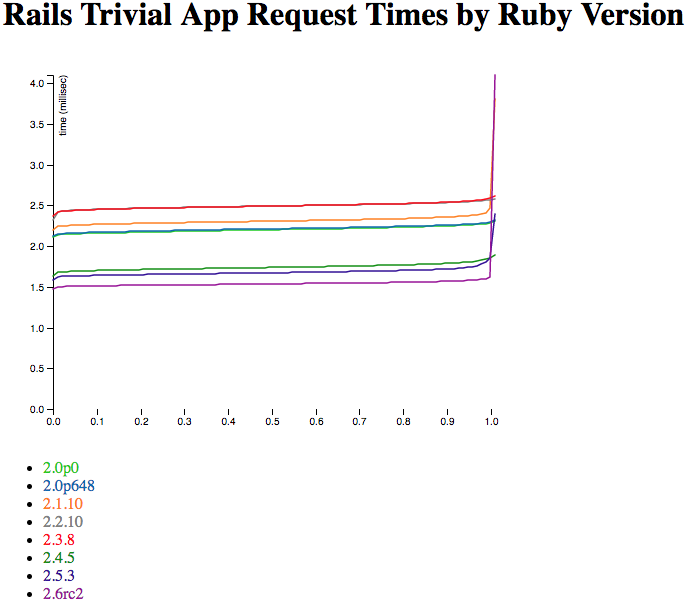
Hrm. So, that’s not showing quite what I want. Let’s trim off the top 2% of the requests as outliers.

That’s better. What you’re seeing is sorted by how many of the requests were a given speed. The first thing to notice, of course, is that they’re all pretty fast. When basically your entire graph is between 1.5 milliseconds per request and 3 milliseconds per request, you’re not doing too badly.
The ranking overall moves in the right direction — later Rubies are mostly faster than older Rubies. But it’s a little funky. Ruby 2.1.10 is a lot slower than 2.0.0p648 for most of the graph, for instance. And 2.4.5 is nicely speedy, but 2.5.3 is less so. Are these some kind of weird Mac-only results?
Ubuntu Results
I usually do my timing on a big EC2 dedicated instance (m4.2xlarge) running Ubuntu. That’s done pretty well for the last few years, so what does it say about this new benchmark? And if we run it more than once, does it say the same thing?
Let’s check.
Here are two independently-run sets of Ubuntu results, also with 10,000 requests collected via ApacheBench. How do they compare?
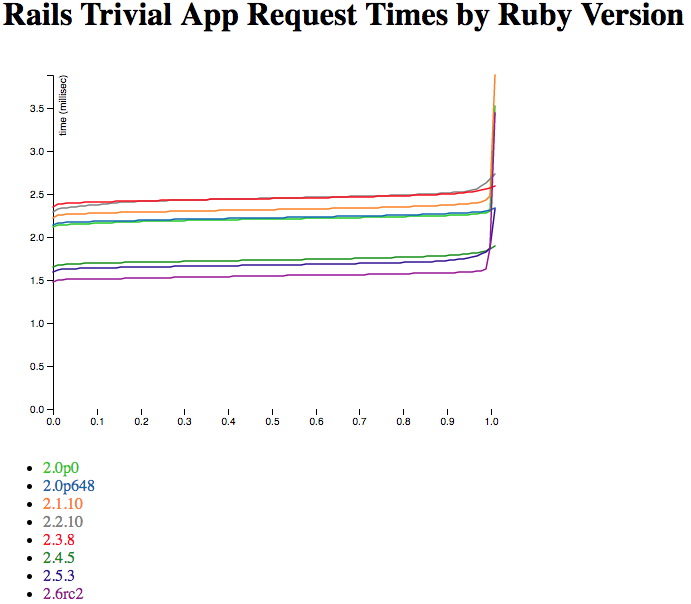
So, huh. This has a much sharper curve on the slow end - that’s because the EC2 instance is a lot faster than my little Mac laptop, core for core. If I graphed without trimming the outliers, you’d also see that its slowest requests are a lot faster - more like 50 or 100 milliseconds rather than 200+. Again, that’s mostly the difference in core-for-core speed.
The order of the Rubies is quite stable - and also includes two new ones, because I’m having an easier time compiling very old (2.0.0p0) and new (2.6.0rc2) Rubies on Ubuntu than my Mac. (2.6.0 final wasn’t released when I collected the data, but rc2 is nearly exactly the same speed.) But the two independent runs have a very similar relative speed and order between the two Rubies. But both are quite different from the Mac run, up above. So Mac and Ubuntu are not equivalent here. (Side note: the colors of the Ruby lines are the same on all the graphs, so 2.5.3 will be the dark-ish purple for every graph on this post, while 2.1.10 will be orange.)
The overall speed isn’t much higher, though. Which suggests that we’re not seeing very much Rails speed in here at all - a faster processor doesn’t make much change in how long it takes to hand a request back and forth between ApacheBench and Rails. We can flatten that curve, but we can’t drop it much from where it starts. Even my little Mac is pretty speedy for tiny requests like this.
Is it that we’re not running enough requests? Sometimes speed can be weird if you’re taking a small sample, and 10,000 HTTP requests is pretty small.
Way Too Many Tiny Requests
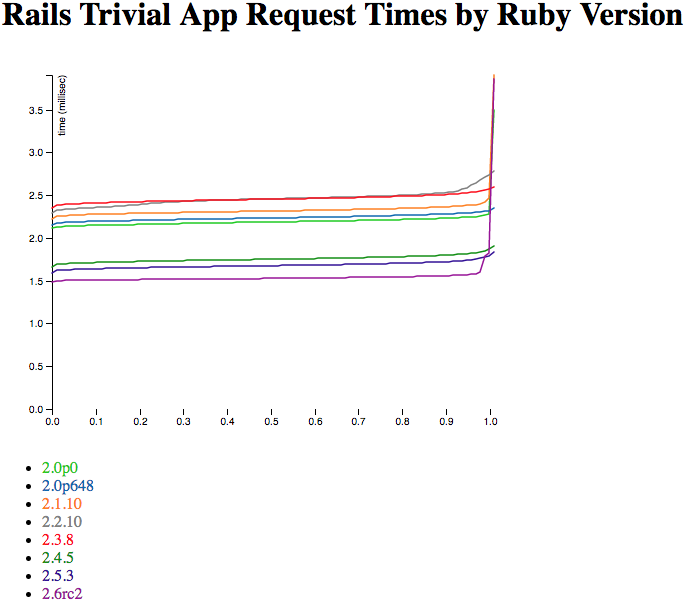
You know what I think this needs? A hundred times as many requests, just to check.
Will the graph be beautiful beyond reason? Not so much. Right now I’m using ApacheBench’s CSV output, which already just gives the percentages like the ones on the graphs - so a million-request output file looks exactly like a 10,000-request output file, other than having marginally better numbers in it.
Still, we’ve shown that the output is somewhat stable run-to-run, at least on Ubuntu. Let’s see if running a lot more requests changes the output much.

That’s one of the 10k-request graphs from above on the left, with the million-request graph on the right. If you don’t see a huge amount of difference between them… Well, same here. So that’s good - it suggests that multiple runs and long runs both get about the same result. That’s good news for looking at 10,000-request runs and considering them at least somewhat representative. If I was trying to prove some major point I’d run a lot more (and/or larger) samples. But this is the initial “sniff test” on the benchmarking method - yup, this at least sort of works.
It also suggests that none of the Rubies have some kind of hidden warmup happening where they do poorly at first - if the million-request graph looks a lot like the 10,000-request graph, they’re performing pretty stably over time. I thought that was very likely, but “measuring” beats “likely” any day of the week.
I was also very curious about Ruby 2.0.0p0 versus 2.0.0p648. I tend to test a given minor version of Ruby as though they’re all about the same speed. And looking at the graph, yes they are — well within the margin of error of the test.
Future Results
This was a pretty simple run-down. If you look at the code above, none of it’s tremendously complicated. Feel free to steal it for your own benchmarking! I generally MIT-license everything and this is no exception.
So yay, that’s another benchmark just starting out. Where will it go from here?
First off, everything here was single-threaded and running on WEBRick. There’s a lot to explore in terms of concurrency (how many requests at once?) and what application server, and how many threads and processes. This benchmark is also simple enough I can compare it with JRuby and (maybe) TruffleRuby. Discourse just doesn’t make that easy.
I’ve only looked at Rails, and only at a very trivial route that returns a static string. There’s a lot of room to build out more interesting requests, or to look at simpler Rack requests. I’ll actually look at Rack next post - I’ve run the numbers, I just need to write it up as a blog post.
This benchmark runs a few warmup iterations, but with CRuby it hardly makes a difference. But once we start looking at more complicated requests and/or JRuby or TruffleRuby, warmup becomes an issue. And it’s one that’s near and dear to my heart, so expect to see some of it!
Some folks have asked me for an easier-to-run Rails-based benchmark which does a lot of Ruby work, but not as much database access or I/O that’s hard to optimize (e.g. not too many database calls.) I’m working that direction, and you’ll see a lot of it happening from this same starting point. If you’re wondering how I plan to test ActiveRecord without much DB time, it turns out SQLite has an in-memory mode that looks promising — expect to see me try it out.
Right now, I’m running huge batches of the same request. That means you’re getting laser-focused results based on just a few operations, which gives artificially large or small changes to performance - one tiny optimization or regression gets hugely magnified, while one that the benchmark doesn’t happen to hit seems like it does nothing. Running more different requests, in batches or mixed together, can give a better overall speed estimate. RRB is great for that, while this post is effectively a microbenchmark - a tiny benchmark of a few specific things.
Related: ApacheBench CSV summary format is not going to work well in the long run. I need finer-grain information about what’s going on with each request, and it doesn’t do that. I can’t ask questions about mixed results very well right now because I can’t see anything about which is which. That problem is very fixable, even with ApacheBench, but I haven’t fixed it yet.
I really miss the JSON format I put together for Rails Ruby Bench, and it’s going to happen sooner rather than later for this. ApacheBench’s formats (CSV and GNUplot) are both far less useful. So that’s going to happen soon too.
And oh man, is it easy to configure and run this compared to something Discourse-based. Makes me want to run a lot more benchmarks! :-)
What Have We Learned?
If you’ve followed my other work on Ruby performance, you may see some really interesting differences here - I know I do! I’m the Rails Ruby Bench guy, so it’s easy for me to talk about how this is different from my long-running “real world” benchmark. Here are a few things I learned, and some differences from RRB:
A tiny benchmark like this measures data transfer more than Ruby’s own performance
Overall, Rubies are getting faster, but:
A microbenchmark doesn’t show most of the optimization that each Ruby does, which looks a bit chaotic
ApacheBench is easy to use, but it’s hard to get fine-grained data out of it
Rails performance is pretty quick and pretty stable, and even 2.0.0p0 was decently quick when running it
I also really like that I can write something new and then speed-test it “historically” in one big batch run. Discourse’s Ruby compatibility limits make it really hard to set that kind of thing up for the 2.0 to 2.6 range, while a much smaller Rails app does that much more gracefully.