
Published on 02 Jan 2019
.jpg?width=200&name=Payara%20ECE%202018%20sponsor%20(2).jpg)
Payara Server provides many metrics within JMX beans. The most interesting metrics are the statistics around pools for HTTP threads and JDBC Connection pooling.
On the other hand, Payara Server also implements the MicroProfile Metrics specification. The retrieval of useful metrics from the running instance in the areas of CPU, memory, Class loading, and other MicroProfile specifications (like Fault Tolerance), are possible through the implementation of the MicroProfile Metrics in Payara Server.
MicroProfile allows for vendor-specific extensions and Payara Server has an extension to expose any JMX bean value through the MicroProfile Metrics endpoint.
This blog shows how you can get the HTTP threads and JDBC Connection pooling statistics exposed.
Activating JMX Bean Monitoring in Payara Server
The JMX beans are not active by default. You can activate them through the web console or the admin command line.
When using the web console, select the Monitoring menu on left and then click on the Configure Monitoring link.
Select the AMX beans and define for which subsystems you want to have the detailed monitoring information, like JDBC connection pooling and HTTP Service.
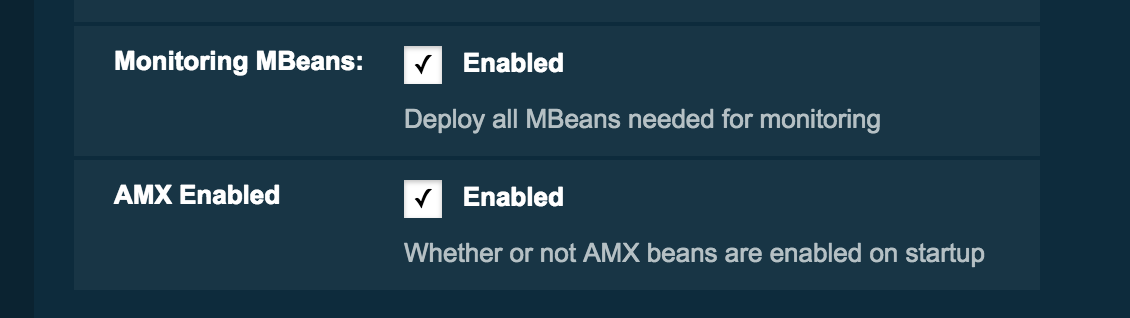

Click the save button and restart the domain so that the changes take effect.
This activation can also be performed from the asadmin CLI interface. The following commands can be issued to have the same effect:
    set configs.config.server-config.amx-configuration.enabled=true
    set configs.config.server-config.monitoring-service.module-monitoring-levels.jdbc-connection-pool=HIGH
    set configs.config.server-config.monitoring-service.module-monitoring-levels.http-service=HIGH
Define Metrics for JMX Bean Values
Payara Server has the option to define a mapping between a JMX value and a MicroProfile Metric item. The only thing you need to do is define the JMX values which needs to be exposed.
This can be done by creating a file named metrics.xml in the directory <payara-home>/glassfish/domains/<domain>/config.
The content to expose some valuable information from the HTTP and JDBC Connection Thread pool is
 <config>
<vendor>
<metadata>
<name>jdbc.connection.pool.%sPool.numconnfree</name>
<mbean>amx:pp=/mon/server-mon[server],type=jdbc-connection-pool-mon,name=resources/%sPool/numconnfree#current</mbean>
<type>counter</type>
<unit>none</unit>
<displayName>numconnfreePool</displayName>
<description>The total number of free connections in the pool as of the last sampling.</description>
</metadata>
<metadata>
<name>http.connection.queue.%s.numconnopen</name>
<mbean>amx:pp=/mon/server-mon[server],type=connection-queue-mon,name=network/http-%s/connection-queue/countopenconnections#count</mbean>
<type>gauge</type>
<unit>none</unit>
<displayName>numconnopenPool</displayName>
<description>The number of open/active connections</description>
</metadata>
<metadata>
<name>http.connection.pool.%s.numconn</name>
<mbean>amx:pp=/mon/server-mon[server],type=connection-queue-mon,name=network/http-%s/connection-queue/counttotalqueued#count</mbean>
<type>gauge</type>
<unit>none</unit>
<displayName>numconncountPool</displayName>
<description>Number of http connections handled</description>
</metadata>
<metadata>
<name>http.connection.queue.http.numconnopen</name>
<mbean>amx:pp=/mon/server-mon[server],type=connection-queue-mon,name=network//connection-queue/countopenconnections#count</mbean>
<type>gauge</type>
<unit>none</unit>
<displayName>numconnopenPool</displayName>
<description>The number of open/active http connections</description>
</metadata>
<metadata>
<name>http.connection.pool.http.numconn</name>
<mbean>amx:pp=/mon/server-mon[server],type=connection-queue-mon,name=network//connection-queue/counttotalqueued#count</mbean>
<type>gauge</type>
<unit>none</unit>
<displayName>numconncountPool</displayName>
<description>Total Number of connections handled</description>
</metadata>
</vendor>
You can also see the usage of wildcards in action in the above configuration. Have a look at the definition around the number of open connections for each pool.
 <name>jdbc.connection.pool.%sPool.numconnfree</name>
<mbean>amx:pp=/mon/server-mon[server],type=jdbc-connection-pool-mon,name=resources/%sPool/numconnfree#current</mbean>
If you define the pool name like xxPool, yyPool, etc .. then statistics for all these connection pools are exposed with an appropriate name due to the usage of the %s in the definition.
Other useful JMX bean values can be found in the Payara Platform documentation.
Expose JMX Bean Values to MicroProfile Metrics Endpoint in Payara Server
With Payara Server it is very easy to expose JMX bean values to the MicroProfile Metrics endpoint by just defining a mapping file. Statistics around the Thread pool usage (open, total connection, queue usages, etc) for example indicate the load on your server instance and can be used to optimize your instances.
Learn About Monitoring Options in Payara Server
Download our User Guide:
