
When you need to find which queries are blocking other queries, your decision comes down to when the blocking happened. Is it happening now, recently, or coming up soon?
During a live emergency, start with sp_WhoIsActive. Adam Machanic’s excellent free sp_WhoIsActive replaces Activity Monitor, sp_who, and sp_who2, and it’s way more powerful. The documentation is extensive – check out how to find blocking leaders:
|
1 2 3 |
EXEC sp_WhoIsActive @find_block_leaders = 1, @sort_order = '[blocked_session_count] DESC' |
This is probably my favorite way to see blocking live, but it only works right now. You can log sp_WhoIsActive’s results to a table, but don’t be a hoarder – don’t set this up to just continuously log to disk if you’re not actively doing something with the data.
If it’s 1-2 hours after the live emergency, use sp_BlitzLock. Sometimes people call you up and want you to troubleshoot deadlocking that finished recently, but you didn’t have anything set up on the server ahead of time. If you’re on SQL Server 2012 or newer, download the First Responder Kit, install sp_BlitzLock, and run it:
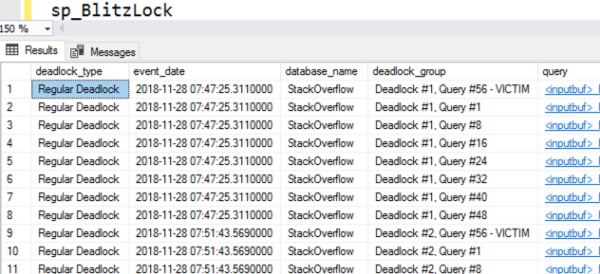
It checks the default system health session and shows you recent deadlocks, the queries that caused them, and the indexes involved. Download sp_BlitzLock in our free First Responder Kit, and read more documentation here.
If you can prepare ahead of time, set up Extended Events. Jeremiah Peschka wrote an easy Extended Events session and a query for it. You don’t want to leave that running all the time, but if you know you’re heading into a time when blocking is traditionally a problem, fire it up and start keeping an eye on it. For blocking specifically, this is even better than logging sp_WhoIsActive to a table since it grabs blocking more frequently, but at a lower overhead. It’s missing a lot of the juicy details sp_WhoIsActive has, but it’s still effective at capturing lead blockers.
If you’ve got a monitoring tool, learn to use it well ahead of time. It’s not enough to just have it installed: just like a database, you need to understand how to leverage its power.
After you’ve had a monitoring tool installed for a few months, learn how to use it to troubleshoot blocking. Cause a blocking situation yourself by creating a table, then doing a BEGIN TRAN in a couple of different session windows and trying to update all of the rows. Let the blocking go on for a while, and see what kinds of emails and alerts you get from the tool. Then close the sessions, wait a while, and see if you can go back through the history to spot the lead blocker.
If you try that, and you still can’t spot the lead blocker with your monitoring tool, it’s time to hit the manual or call the vendor’s support line for help. They definitely want you to be able to use their tools – the more effective you are at using ’em, the more likely you’ll be to renew your support. Take advantage of the help before blocking strikes.

2 Comments. Leave new
This is a very helpful and very comprehensive post!
Thanks Brent!
My pleasure!