You might think that it is easy to get JSON data from a spreadsheet, and there are plenty of utilities around that are based on the idea that it is trivial. If such data was strictly tabular, then it might be. The problem is that any conversion tool makes assumptions about the way that data is structured, whether it is row- or column-oriented, whether it has headers, or row labels, and so on. The whole joy of excel is that it allows you a great deal of leeway in the way that you lay out your data. You might use headers, labels or ranges. There seems to be no end to the human ingenuity in finding creative ways of structuring data. The safest way I’ve ever found to automate the harvesting of data from a spreadsheet is to automate the process in PowerShell.
Sometimes, the requirement is just too trivial for an automated task. Let’s take a couple of simple tasks. Both these are based on what amounts to a form. As a developer, I occasionally have to deal with JSON-based files that amount to configuration information. For my first example, I will take a simple calendar form that allows someone to record a daily measurement such as the hours worked, the profit, the output, or whatever. We’ll do it for rainfall in inches.
A data person will groan slightly. This is a pivot that is friendlier to humans than machines. It has added totals. It has places where there is no data. What we need is a json file, object-within-array, that deals with all this. You won’t get very far just turning the format to JSON. Here is a sample spreadsheet. I’ll add a version to this article.
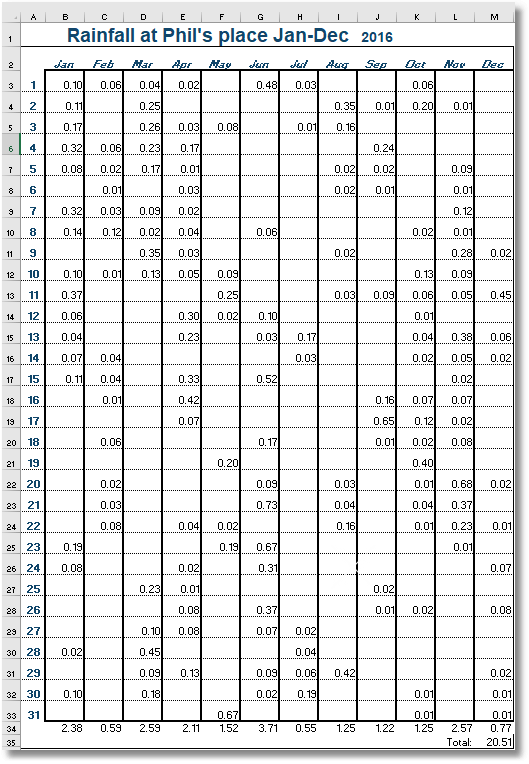
I’ve taken an existing format and added very few tweaks. The year in the top title is actually an integer value that is in a separate call to the merged-right-aligned cell containing the rest of the title. This makes it easy for us to detect what year the data applies to.
We then add a cell underneath the form. This is going to grow to the same number of cells in the same shape as the cells with the data in it.
In the cell formula, we add an expression
|
1 |
=IF(LEN(TRIM(E3))>0,CONCAT("{""date"":""",TEXT(DATE($J$1,COLUMN()-1,$A3),"yyyy-mm-dd"),""",""rainfall"":",E3,"},"),"") |
What this means is ‘if the length of the trimmed string in the rainfall cell is greater than zero, then create a string that consists of the date label followed by a string value in ISO format that consists of the year column we added at the top, the column number -1 to tell us the month number, and the day taken from the column at the beginning of the row. Then we add the ‘rainfall’ label and the value in the cell. If no data in the call then we don’t record anything. ’
For this first cell we get the string ‘{“date”:”2016-01-01″,”rainfall”:0.1},’ displayed. It looks suspiciously like a fragment of JSON. Those liberally-sprinkled $ signs are absolute references to either columns and rows. The cell reference with both column and rows specified as absolute references is to get the year.
Now we use the ‘fill down’ and ‘fill right’ features to copy this expression to a block of cells of the same size and shape as the data(twelve across by thirty-one down), below this new cell. We now get a sort of doppelganger matrix with the fragment of JSON rather than the data.
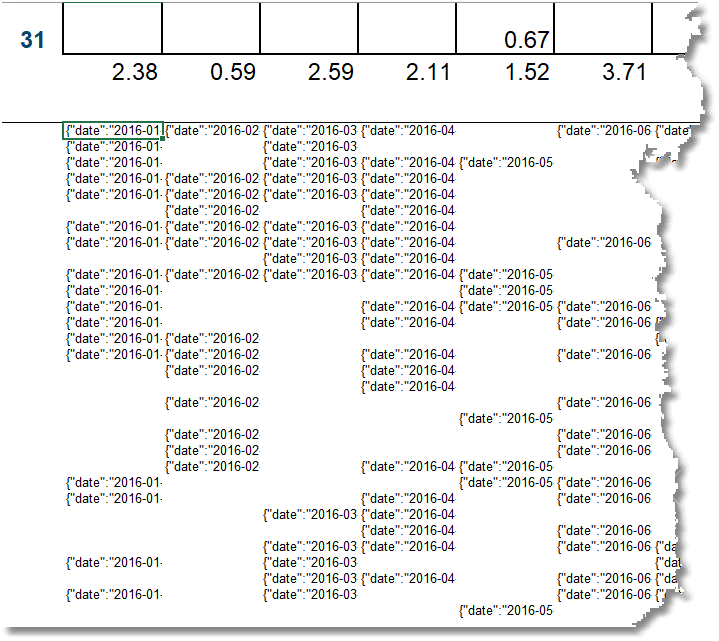
You can’t see the full JSON equivalent of each cell as the display is truncated. You can see that it is a sparse matrix because if there is no rainfall then there is nothing to record (this is a philosophical argument I’ll grant you)
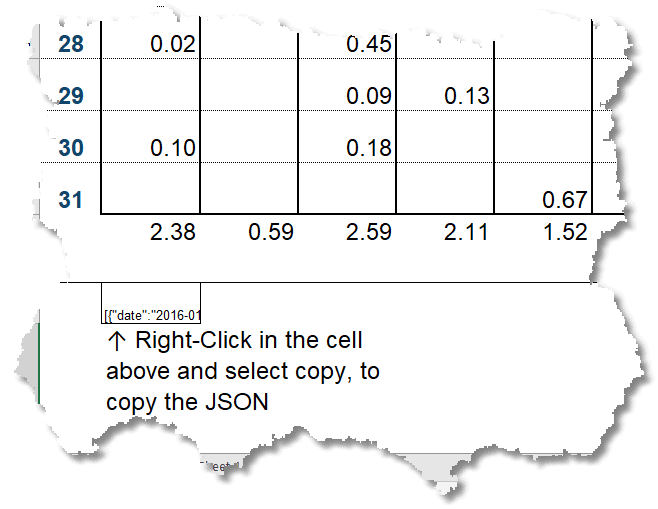
We have one last duty to perform. We need to concatenate all these together and lop off the final comma before wrapping it up into the array square-brackets.
In the cell below the block we’ve just created, we add this expression as a formula
|
1 |
=CONCAT("[",LEFT(CONCAT(B36:M66),LEN(CONCAT(B36:M66))-1),"]") |
This cell will contain the legal JSON array of objects.
We then hide the rows containing the calculation calls, leaving the form and the final call containing the final JSON.
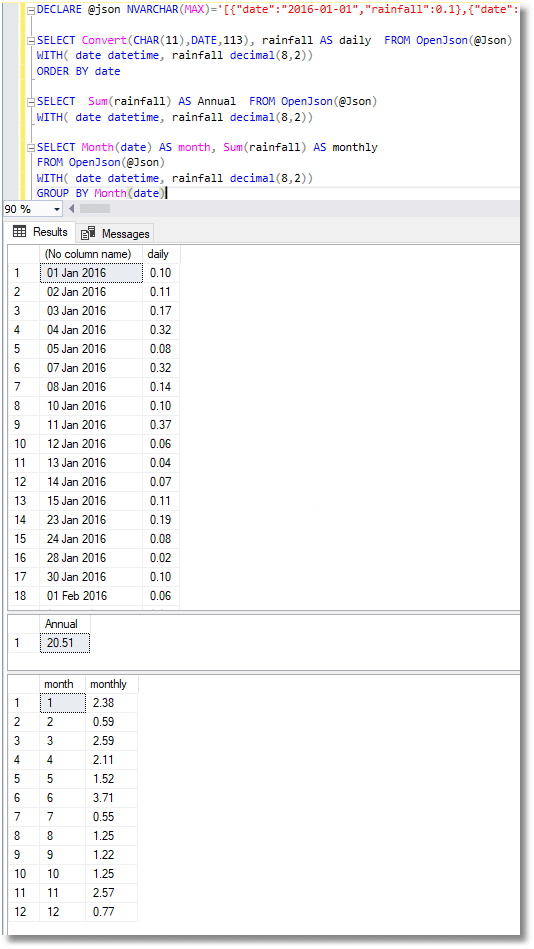
So we do that, and save it to file or whatever we need to do. We paste it into SSMS and check that it has faithfully recorded the data. With a relief, we find that our totals have tallied and we can go on to add the data to our database.
Now that we have a template that allows easy entry and checking of the data, we also have no fear of getting the data into a database.
What if the data is a wee bit more complex?
A while back, I was writing a blog here and needed a sample of JSON that wasn’t distracting and had no compromising information. I knocked together a database in Excel, using tables from the Wikipedia. I used Excel. I quite often gather information like this because of Excel’s easy way with HTML tables.
I have to confess that I got rather interested in the information I gathered, which was the dialect words for counting in twenties, which was once used throughout Britain for simple counting tasks. It is interesting because it is a survival of the old Brythonic language used before Roman imperialism. There was a craze amongst folklorists in the 1850s for collecting instances of it being used. It was lucky for modern linguists that they did as it was, even then, dying out.
Please imagine that it is your valuable business data and that what we have is the output of all our manufacturing plants month by month: something like that.
Here is a section of the spreadsheet
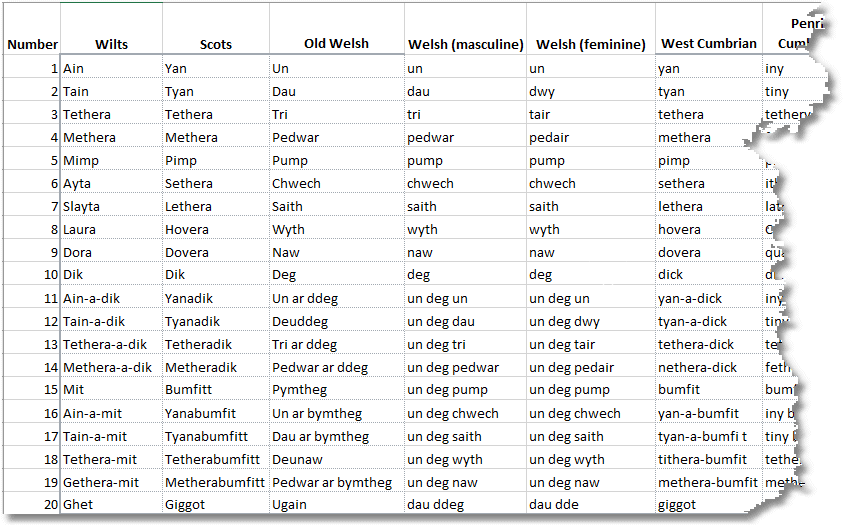
I added the cells in a similar way to that I’ve just described for the yearly calendar data. As I kept finding more and more strings, going back into books published in the 1860s, I had to keep adding columns for each new region was found. It had to be extensible.
This is an array of ‘region’ objects, each of which has an array of word objects.To illustrate the fact that this data was rather more complex, I’ve just reduced it to two numbers in the sequence array rather than the original twenty. Each JSON document in our collection has an embedded array.
|
1 2 3 4 5 6 7 8 9 10 11 12 13 14 15 16 17 18 19 |
[{ "region": "Wilts", "sequence": [{ "number": 1, "word": "Ain" }, { "number": 2, "word": "Tain" }] }, { "region": "Scots", "sequence": [{ "number": 1, "word": "Yan" }, { "number": 2, "word": "Tyan" }] }] |
Excel can cope perfectly easily with this.
Below the form in which we entered our sheep-counting words for each region of the British isles, we create a block of calls of the same size and shape. Into the first cell we add a formula:
|
1 |
=IF(LEN(TRIM(B2))>0,CONCAT("{""number"":",$A2,",""word"":""",B2,"""},"),"") |
This means ‘ if the value exists, join together the string ‘number’ in parentheses, followed by the data in the corresponding first row that tells us what number we are counting, and then provide the value within the column for this particular region. Add a comma. Otherwise leave a blank string’.
What we get is
|
1 |
{"number":1,"word":"Ain"}, |
We then copy this down and across by filling down and then right. It will be twenty rows and the same number of columns as there are regions.
Now we can assemble the region objects in the row below. The first call will have this expression
|
1 |
=CONCAT("{""region"":""",B1,""",""sequence"":[",LEFT(CONCAT(B22:B41),LEN(CONCAT(B22:B41))-1),"]},") |
This means ‘join together or concatenate a string consisting of the key “region”: followed by name of the region (B1). Then we have the key “sequence” followed by an array open-square-brackets. Then we join together all twenty of the values of the cells above into an array.
This will, in the first column, give us the value …..
|
1 2 3 4 5 6 7 8 9 10 11 12 13 14 15 16 17 18 19 20 21 22 23 24 25 26 27 28 29 30 31 32 33 34 35 36 37 38 39 40 41 42 43 44 45 46 47 48 49 50 51 52 53 54 55 56 57 58 59 60 61 62 63 64 |
{ "region": "Wilts", "sequence": [{ "number": 1, "word": "Ain" }, { "number": 2, "word": "Tain" }, { "number": 3, "word": "Tethera" }, { "number": 4, "word": "Methera" }, { "number": 5, "word": "Mimp" }, { "number": 6, "word": "Ayta" }, { "number": 7, "word": "Slayta" }, { "number": 8, "word": "Laura" }, { "number": 9, "word": "Dora" }, { "number": 10, "word": "Dik" }, { "number": 11, "word": "Ain-a-dik" }, { "number": 12, "word": "Tain-a-dik" }, { "number": 13, "word": "Tethera-a-dik" }, { "number": 14, "word": "Methera-a-dik" }, { "number": 15, "word": "Mit" }, { "number": 16, "word": "Ain-a-mit" }, { "number": 17, "word": "Tain-a-mit" }, { "number": 18, "word": "Tethera-mit" }, { "number": 19, "word": "Gethera-mit" }, { "number": 20, "word": "Ghet" }] } |
This needs to be provided to every column with a regional variation in it by filling right to the row across all the columns representing a region.
Now we need to join all the regions together to give us the document, and to give it the array enclosing-brackets and nick out the final comma
This is done by a final expression in the first data column
|
1 |
=CONCAT("[",LEFT(CONCAT(B42:AU42),LEN(CONCAT(B42:AU42))-1),"]") |
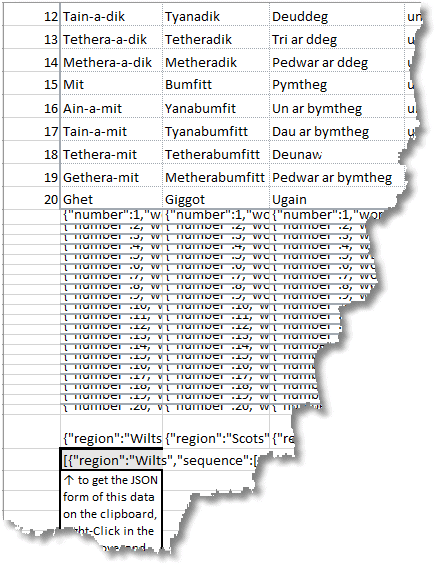
Here is the spreadsheet with the rows un-hidden
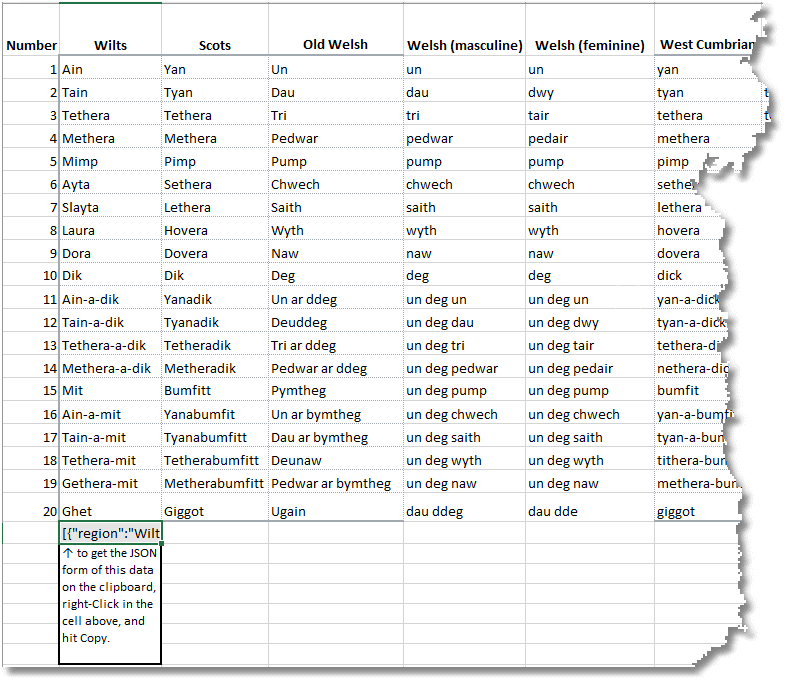
And the final version
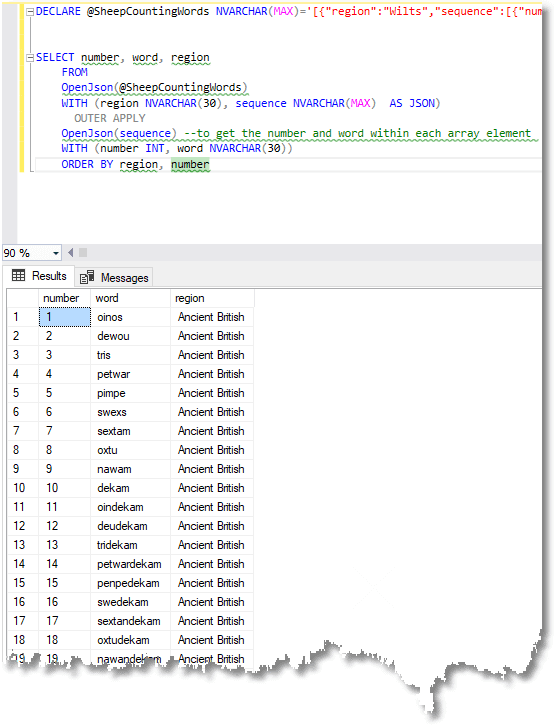
And we check out the JSON in SSMS
We can, (and have done), added many regional variations, merely by selecting a column, copying it, and inserting the copied column. This copies all the relevant formulas. I thin merely changed the data in the copied data-cells.
Conclusion
This technique works and saves a lot of time in transferring data. It saves time in gathering data due to excel’s wonderful promiscuity on collecting data. It saves time in importing the data into SQL Server because one can be so flexible in the way we arrange the JSON schema. We can even cope with data that goes across multiple worksheets. You may need to ‘escape’ the data if it contains banned characters such as the double-quote marks used as string delimiters or the control characters.
I’ve found that this technique works best where excel data is structured into forms in a reasonably disciplined ways, so it is worth taking time to create handy templates. I’ve noticed that a lot of business people relate very quickly to weekly or monthly charts of data and will be grateful for an accommodation towards the way that they naturally think about data.
The collection of the data can be done by ODBC or by automation of Excel rather than cut’ n paste. See Getting Data between Excel and SQL Server using ODBC for the details.
Load comments