
Published on 24 Oct 2018

In the previous blog of this series, we learned about 5 production features of the Payara Server 5. This blog will continue to introduce 5 more production features of Payara Server 5 that you might not know about - but should.
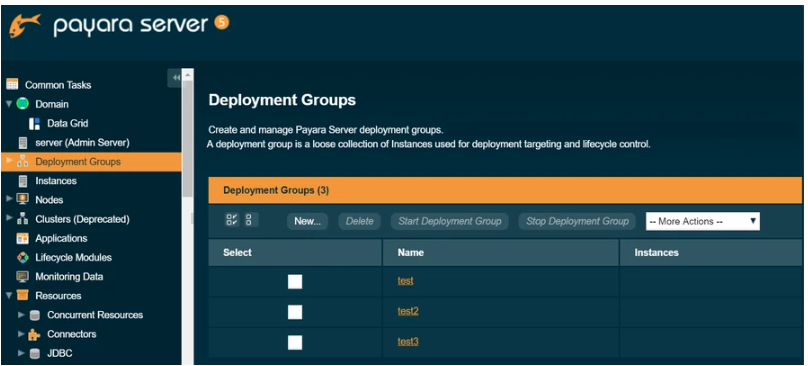
Deployment Groups
A deployment group is a set of Payara Server instances that can be used as target for deployments and the life-cycle of the instances can be managed using the deployment group (for e.g instances can be started, re-started and stopped etc).
To create a new deployment group, navigate to the Deployment Groups node in the navigation tree, click on the New button and give the deployment group a unique name:
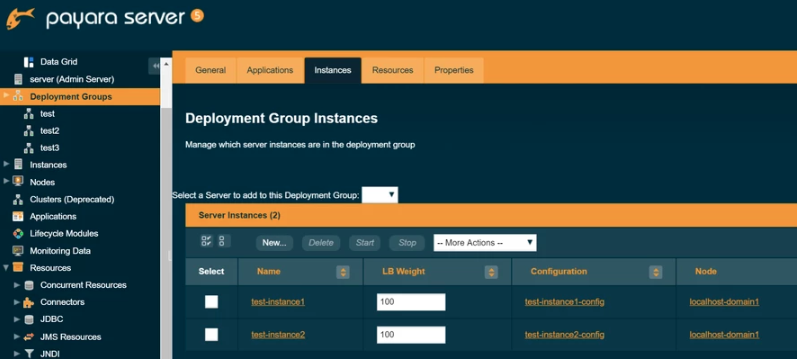
Similarly an individual Payara Server instance can also be part of one or more deployment groups hence providing the greater flexibility over traditional clustering. To add an instance to a deployment group. Navigate to the Deployment Groups → select <deployment-group> → Instances tab → press New button or select existing instances from drop-down :
Find out more about the Deployment groups.
MicroProfile Metrics and HealthCheck
Monitoring applications is a necessary part to get complete visibility into your applications and find any potential issues in the early stages.
MicroProfile Metrics:
The goal of MicroProfile Metrics is to provide the monitoring support for applications as well as the underlying runtime and the metrics data are made available at the HTTP endpoints ‘/metrics’ with JSON and Prometheus format.
Using a web browser to visit http://localhost:8080/metrics will result in an output of Prometheus text format as shown below:
# TYPE base:classloader_total_loaded_class_count counter

# HELP base:classloader_total_loaded_class_count Displays the total number of classes that have been loaded since the JVM has started execution. base:classloader_total_loaded_class_count 12054


# TYPE base:thread_count counter

# HELP base:thread_count Displays the current number of live threads including both daemon and non-daemon threads.

base:thread_count 67


# TYPE base:classloader_current_loaded_class_count counter

# HELP base:classloader_current_loaded_class_count Displays the number of classes that are currently loaded in the JVM.

base:classloader_current_loaded_class_count 10657


# TYPE base:memory_committed_non_heap_bytes gauge
# HELP base:memory_committed_non_heap_bytes Displays the amount of memory in bytes that is committed for the JVM to use.
base:memory_committed_non_heap_bytes 1.28708608E8


# TYPE base:memory_committed_heap_bytes gauge
# HELP base:memory_committed_heap_bytes Displays the amount of memory in bytes that is committed for the JVM to use.
base:memory_committed_heap_bytes 3.66477312E8
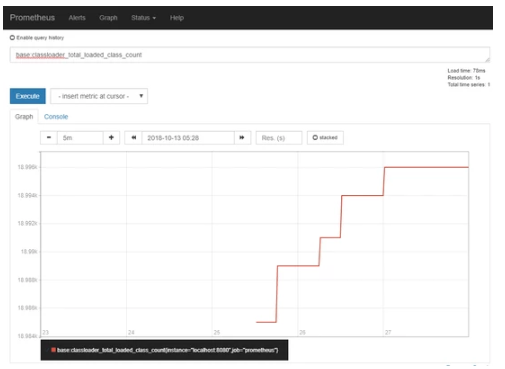
The Prometheus server (an open-source, leading monitoring solution) can scrape the metrics data at an interval from ‘/metrics’ endpoint and store them in a time-series database, so you may extract and analyze metrics information in the Prometheus UI.
Find out more about the Microprofile Metrics.
MicroProfile HealthCheck
The goal of MicroProfile HealthCheck is to give you the ability to monitor the health of your application and the health data are made available at the HTTP endpoints ‘/health’ with JSON format. Orchestration tools can scrape the health checks data to verify the availability & health of application or remove/replace an unhealthy application instance in case of a failing "DOWN" health check status.
An example of a health check defined by a deployed application:
@Health

@ApplicationScoped

public class CheckDiskspace implements HealthCheck {


 @Override

  public HealthCheckResponse call() {

      return HealthCheckResponse

                 .named("diskspace-check")

                 .withData("free", "500mb")

                 .up()

                 .build();

     }


}
Using a web browser to visit http://localhost:8080/health will lead to a series of invocations on health check procedures and the runtime will provide a composite JSON response as shown below:
{
  "status": "UP",
  "checks": [
    {
      "name": "diskspace-check",
      "status": "UP",
      "data": {
        "free": "500mb"
      }
    },
    {
      "name": "db-check",
      "status": "DOWN"
}
]
}
Find out more about the MicroProfile HealthCheck.
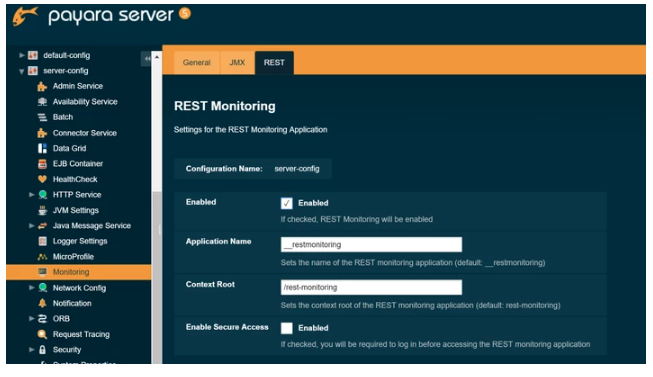
REST Monitoring of JMX Data
REST Monitoring Service exposes JMX MBeans over standard HTTP connection with a REST API in a JSON format to stop JMX monitoring requiring RMI. The REST monitoring is hosted on the admin-listener (port 4848). The REST Monitoring configuration page can be found under Configurations → → Monitoring → REST.
Check the Enabled box to switch the REST Monitoring service on :
The REST API is hosted on the following URL:
http://<HOSTNAME>:<ADMIN_PORT>/<REST_MONITORING_CONTEXT>/rest
Which by default is http://localhost:4848/rest-monitoring/rest.
Find out more about the REST Monitoring Service.
The JMX Logging Service
The JMX Monitoring Logging Service periodically logs the values of specific JMX MBeans through the notification service. If an MBean provides composite attributes means a number of different values are available for each attribute, the JMX Monitoring Logging Service can either log all composite values or a single specific value. To log a single value, the attribute name should also contain the name of the specific value separated by a period.
The JMX Monitoring configuration page can be found under Configurations → <config-name> → Monitoring → JMX. To enable JMX Monitoring select Enabled :
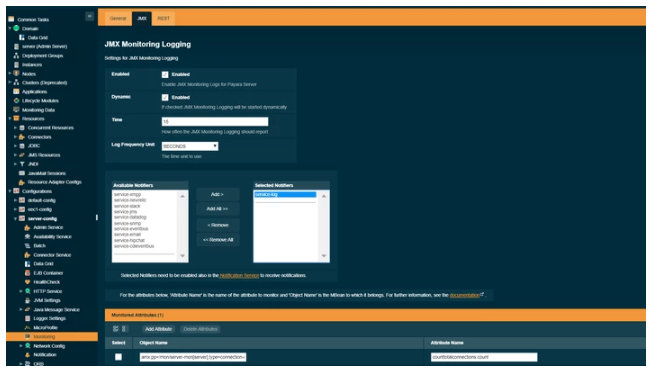
By default, JMX will output an empty message as there are no MBeans configured. To add an MBean to the monitoring service, click AddAttribute on the Monitored Attributes table at the bottom of the page.
Find out more about the JMX Logging Service.
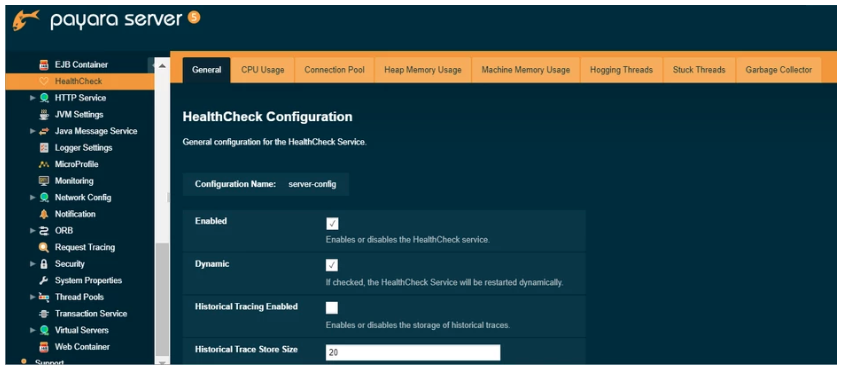
HealthCheck Service
The HealthCheck Service provides automatic self-monitoring in order to detect issues in the early stage by performing periodically checks on several metrics, such as CPU usage, Memory usage, JVM Garbage Collections, JVM Heap usage, and Stuck threads detection. If any of these metrics exceed a configured threshold, then a notification is sent to all notifiers (e.g message logged into a log file). This helps to rapidly detect problems or work out what happened after problems have occurred.
To configure the HealthCheck Service in the Administration Console, go to Configuration → <config-name> → Healthcheck. Check the Enabled box to switch the HealthCheck service on :
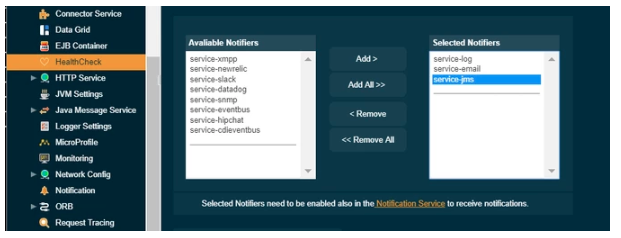
Here’s an example page for the HealthCheck Service, which selects Log, Email and JMS notifiers for it:
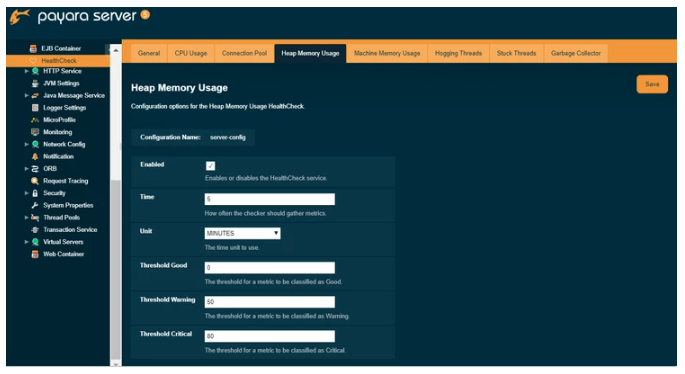
Each of the available checkers that are used to determine the server’s health can also be configured separately from each other on the admin console.
Here the Heap Memory Usage checker is configured which calculates the heap memory usage and prints out the percentage along with initial and committed heap sizes :
Find out more about the HealthCheck Service.
Want to learn more about using Payara Server in production? Take a look at our In Production Resources. If you need help migrating to Payara Server or supporting your production Payara Server environment, consider our commercial support services.