htop: Quick Guide & Customization
htop is an interactive system monitor and a process viewer, process manager, trace tool and more. Sysadmins may opt to use htop when Unix top does not provide enough information about system processes.
htop uses a cursor-controlled interface for sending signals to processes. One example where this is helpful is: you don’t have to type in PIDs; select one or more processes using your mouse cursor or another input device.
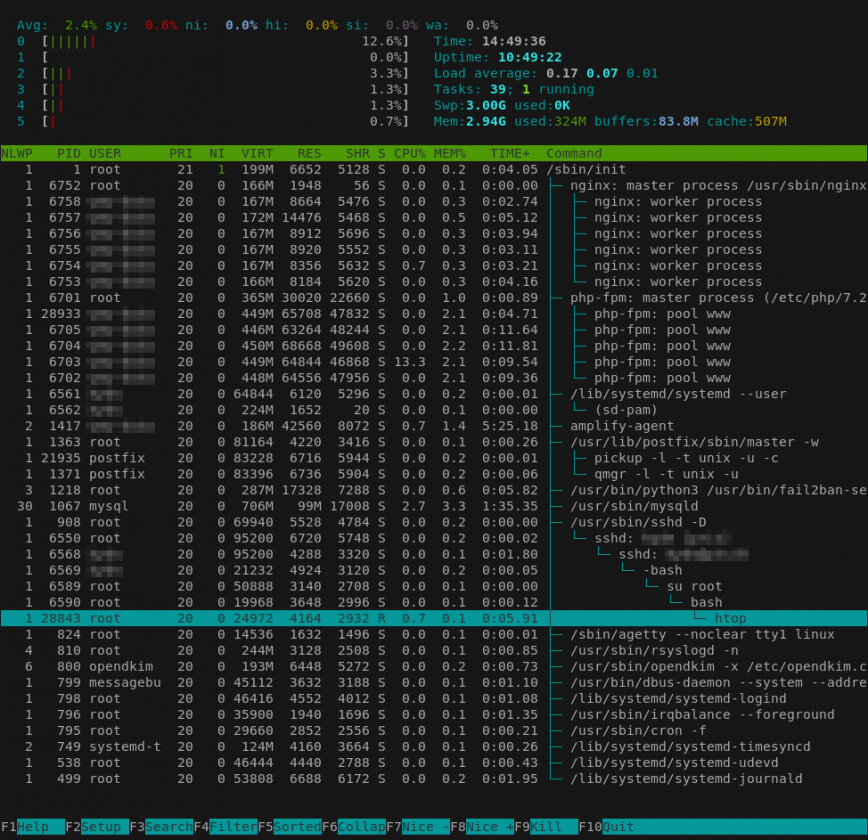
Although similar to top, htop also allows you to scroll vertically and horizontally, so you can see all the processes running on the system and view them as a process tree. Below is a screenshot of htop, taken from a StackLinux VPS which is hosting this blog:

htop – How to Customize it
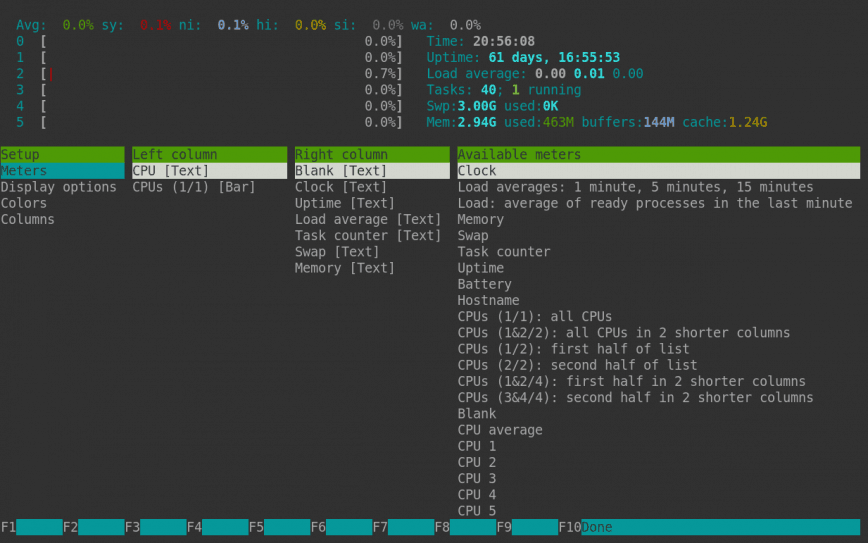
Now for the fun part of customizing htop. Here’s a quick guide. Open htop, and use your mouse or touchpad to navigate. Start by clicking Setup (bottom left) or by pressing F2 or shift + s. This will open the following screen:

Just about all of us use top and htop. However, more often than not, we don’t tweak to our liking. (Also read: how to customize top command and atop for Linux server performance analysis, here’s how). From the above screen, you can tweak many settings. These settings are then saved to $HOME/.config/htop/htoprc
Here’s a copy of my htoprc config file.
Feel free to copy, replace and tweak some more. Back up your config file first.
# Beware! This file is rewritten by htop when settings are changed in the interface.
# The parser is also very primitive, and not human-friendly.
fields=50 0 48 17 18 38 39 40 2 46 47 49 1
sort_key=111
sort_direction=1
hide_threads=1
hide_kernel_threads=1
hide_userland_threads=1
shadow_other_users=0
show_thread_names=0
show_program_path=1
highlight_base_name=0
highlight_megabytes=0
highlight_threads=0
tree_view=1
header_margin=1
detailed_cpu_time=1
cpu_count_from_zero=1
update_process_names=0
account_guest_in_cpu_meter=0
color_scheme=6
delay=15
left_meters=CPU AllCPUs
left_meter_modes=2 1
right_meters=Blank Clock Uptime LoadAverage Tasks Swap Memory
right_meter_modes=2 2 2 2 2 2 2
htop Tweaks for Linux Administrators
The following is a list of the htop modifications to suit Linux administration better.
- Added a detailed CPU usage line at the top (System/IO-wait/Hard-IRQ/Soft-IRQ/Steal/Guest).
- hide userland process threads. (Are the only processes visible without scrolling MySQL threads? This solves that. Optional)
- Added NLWP column. NLWP = Number of threads in a process. (Eg. MySql) Useful when the above change is made.
- Added detailed memory usage line. (mem/used/buffers/cache)
- Change process lists to tree view.
- Changed CPU count to start from 0.
- Change CPU cores from 2, to 1 column. (may need more for a high # of cores)
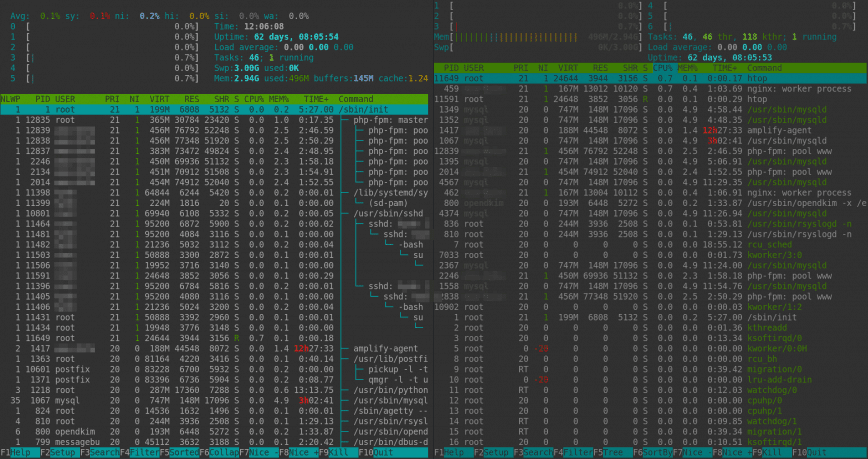
Here’s a visual comparison. My tweaked config is on the left, and the default htop is on the right. (full-sized image here):

Also read htop and top alternatives: Glances, nmon.
What would you say are the most useful columns in htop? I remove everything between PRI and SHI and just add IOPS.
I’ve always wished for custom colors schemes as well, there doesn’t seem to be a way to add them. Have I missed it?
I second that ^
Having an option to colorize them would be amazing. I have not found an option for it though. I like to keep everything organized on my work and home PC using color codes.
There is no direct option unfortunately. But I can tell you, where the color-themes are defined.
If you dig through the github page of htop, you will find that the color-schemes are defined in the CRT.c
maybe change a few things there and compile it yourself?
Thanks for sharing. Welcome to the community.