Introducing the Scout database monitoring addon
Perhaps the most significant performance problem spot in web apps is the database. In apps monitored by Scout, database queries account for nearly a third of the time spent in the average Rails web request. Just as important, the more time an app spends in the database, the more volatile its response times. Here's a breakdown:
| Service Layer | % of Response Time | Correlation to Response Time Volatility |
|---|---|---|
| Database | 32% | 0.35 |
| Ruby | 24% | 0.23 |
| HTTP calls | 9% | 0.06 |
Data is based on apps monitored by Scout averaging 50 requests per-minute or higher.
The response time correlation measures the ratio of an app's 95th response time duration to the mean response time. This value may range from -1 to 1.
Database queries deserve some extra performance love, and our database monitoring addon is here to help.
Start with the forest...
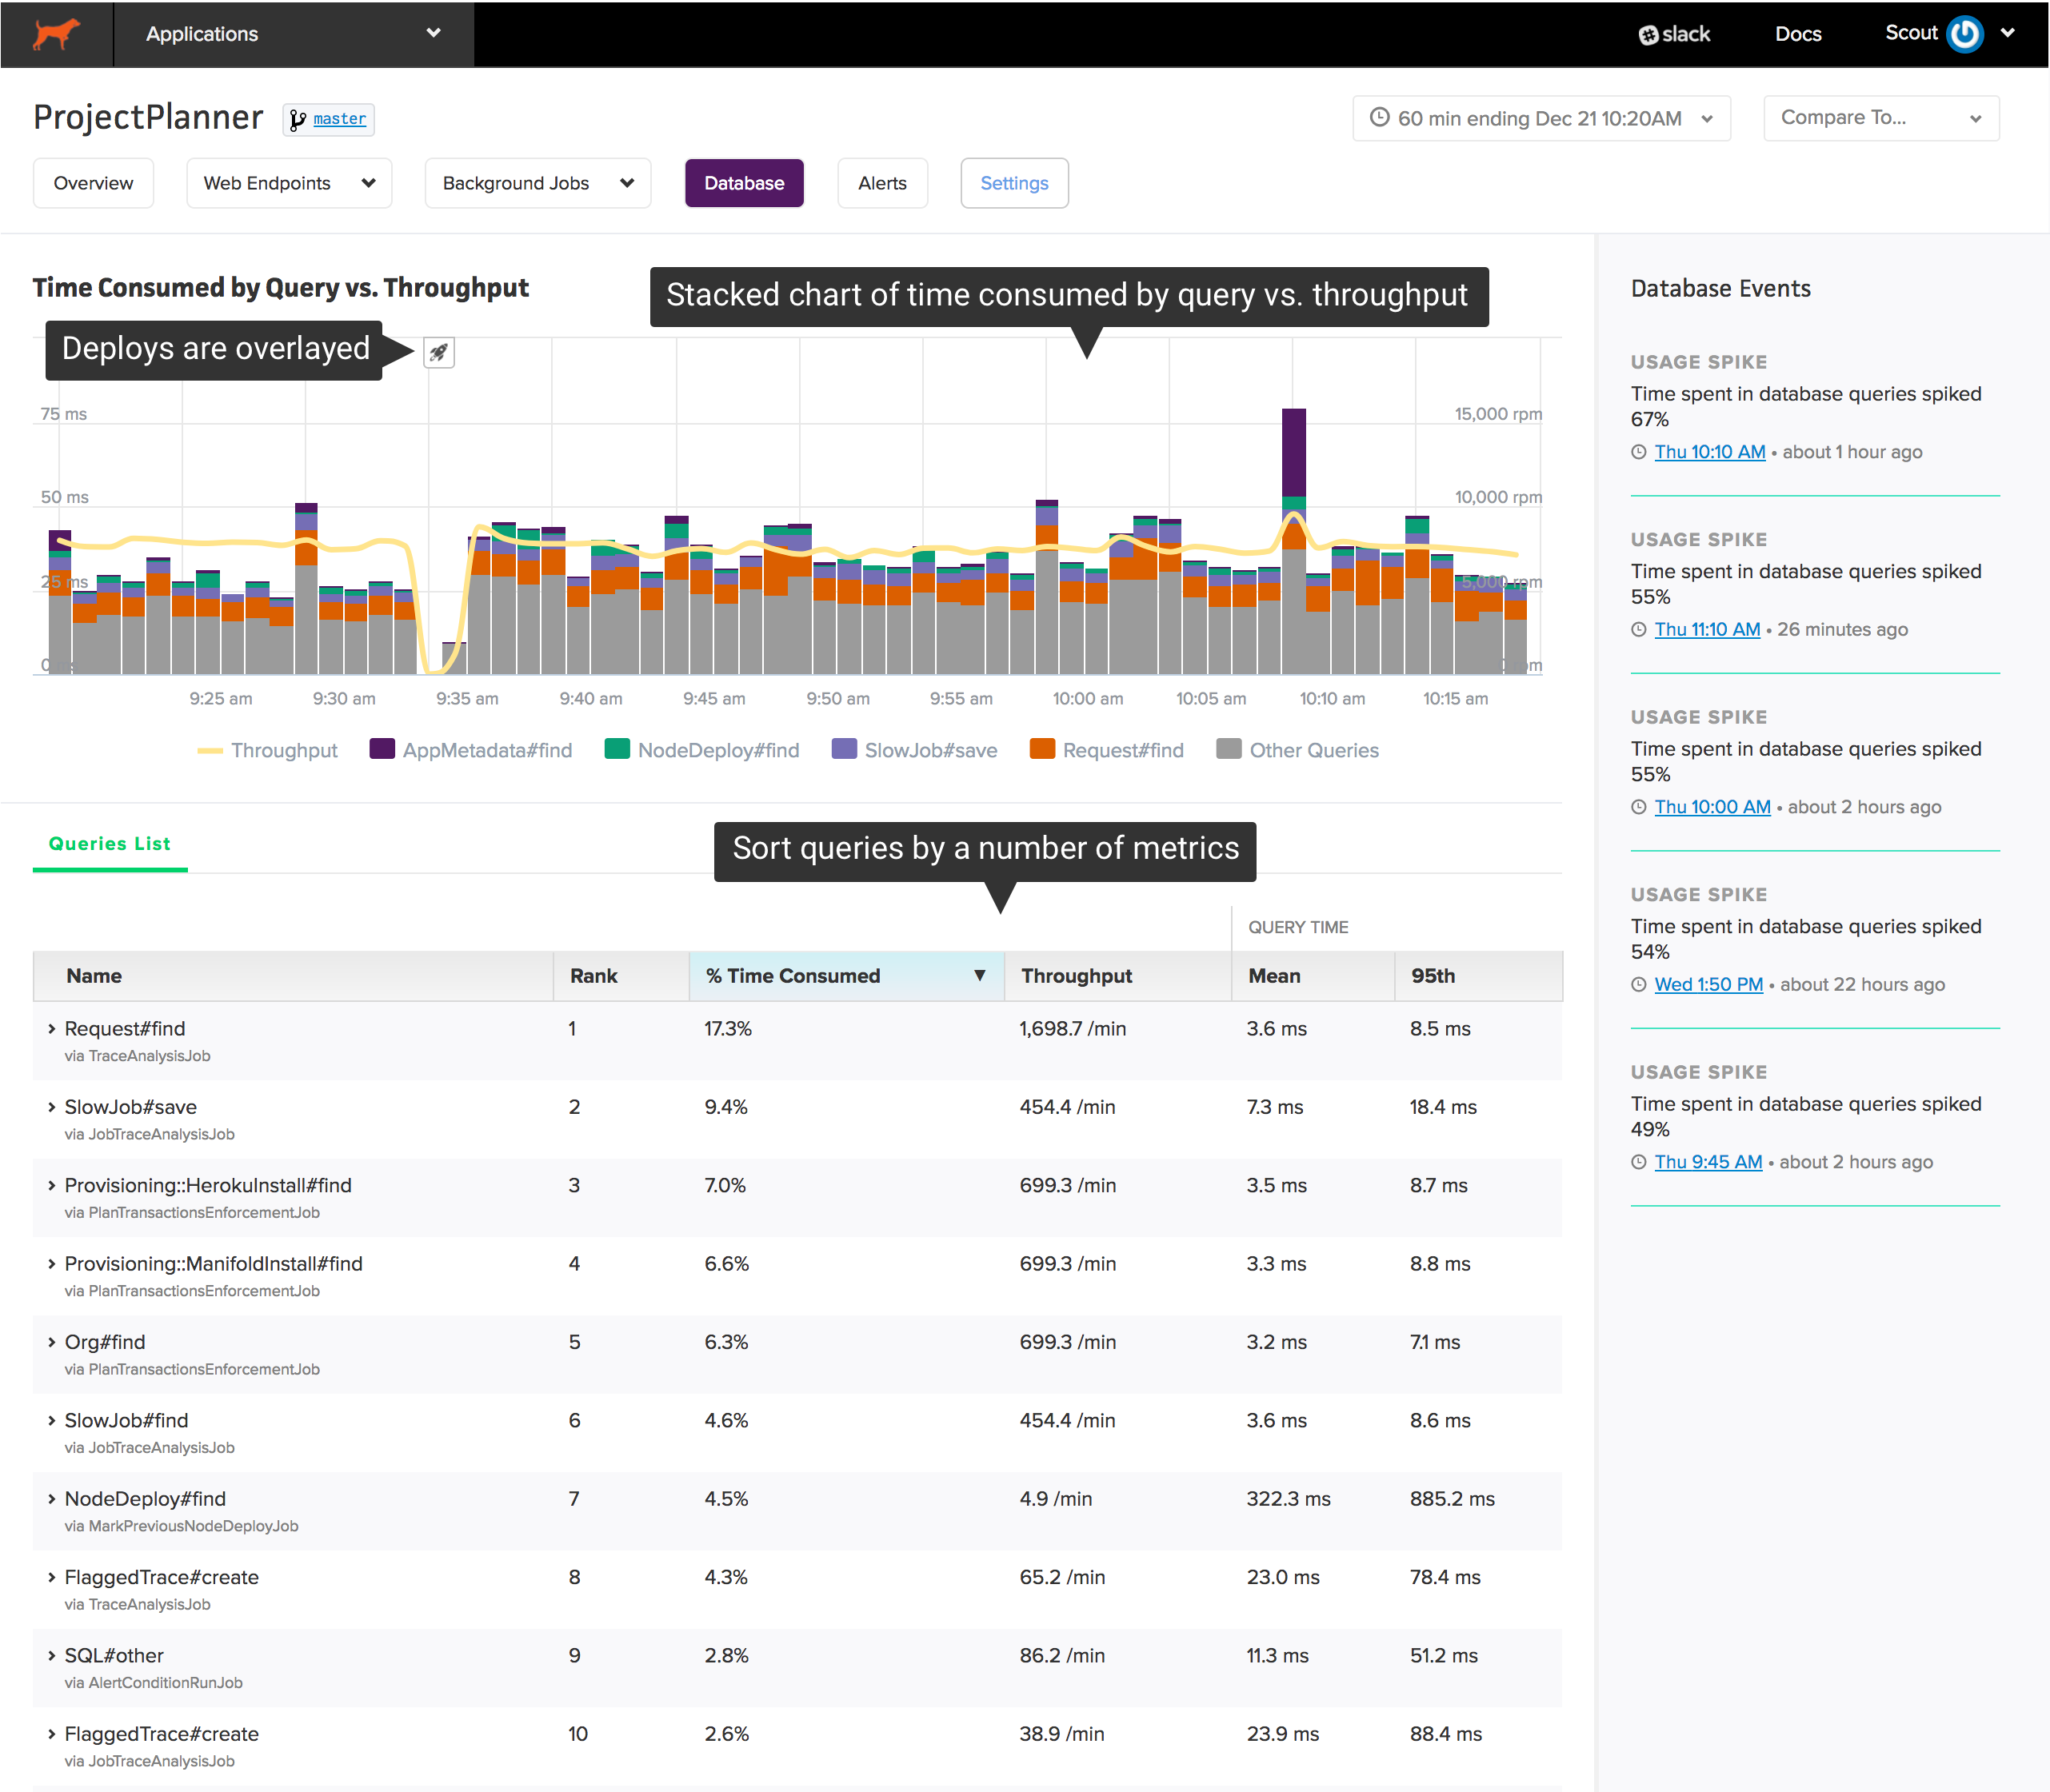
When the database monitoring addon is enabled, you'll gain access to both a high-level overview of your database query performance and detailed information on specific queries. The high-level view helps you identify where to start:
The chart at the top shows your app's most time-consuming queries over time. Beneath the chart, you'll find a sortable list of queries grouped by a query label (ex: the ActiveRecord model and operation) and the caller (a web endpoint or a background job):
This high-level view saves a significant amount of time figuring out where to start on two critical database performance problems:
- Capacity issues: an overloaded database can have a dramatic impact on your app's performance. Sorting the list of queries by "% time consumed" shows you which queries are consuming the most time in your database.
- Slow queries: it's easy for queries to become more inefficient over time as the size of your data grows. Sorting queries by "95th percentile response time" and "mean response time" makes it easy to identify your slowest queries.
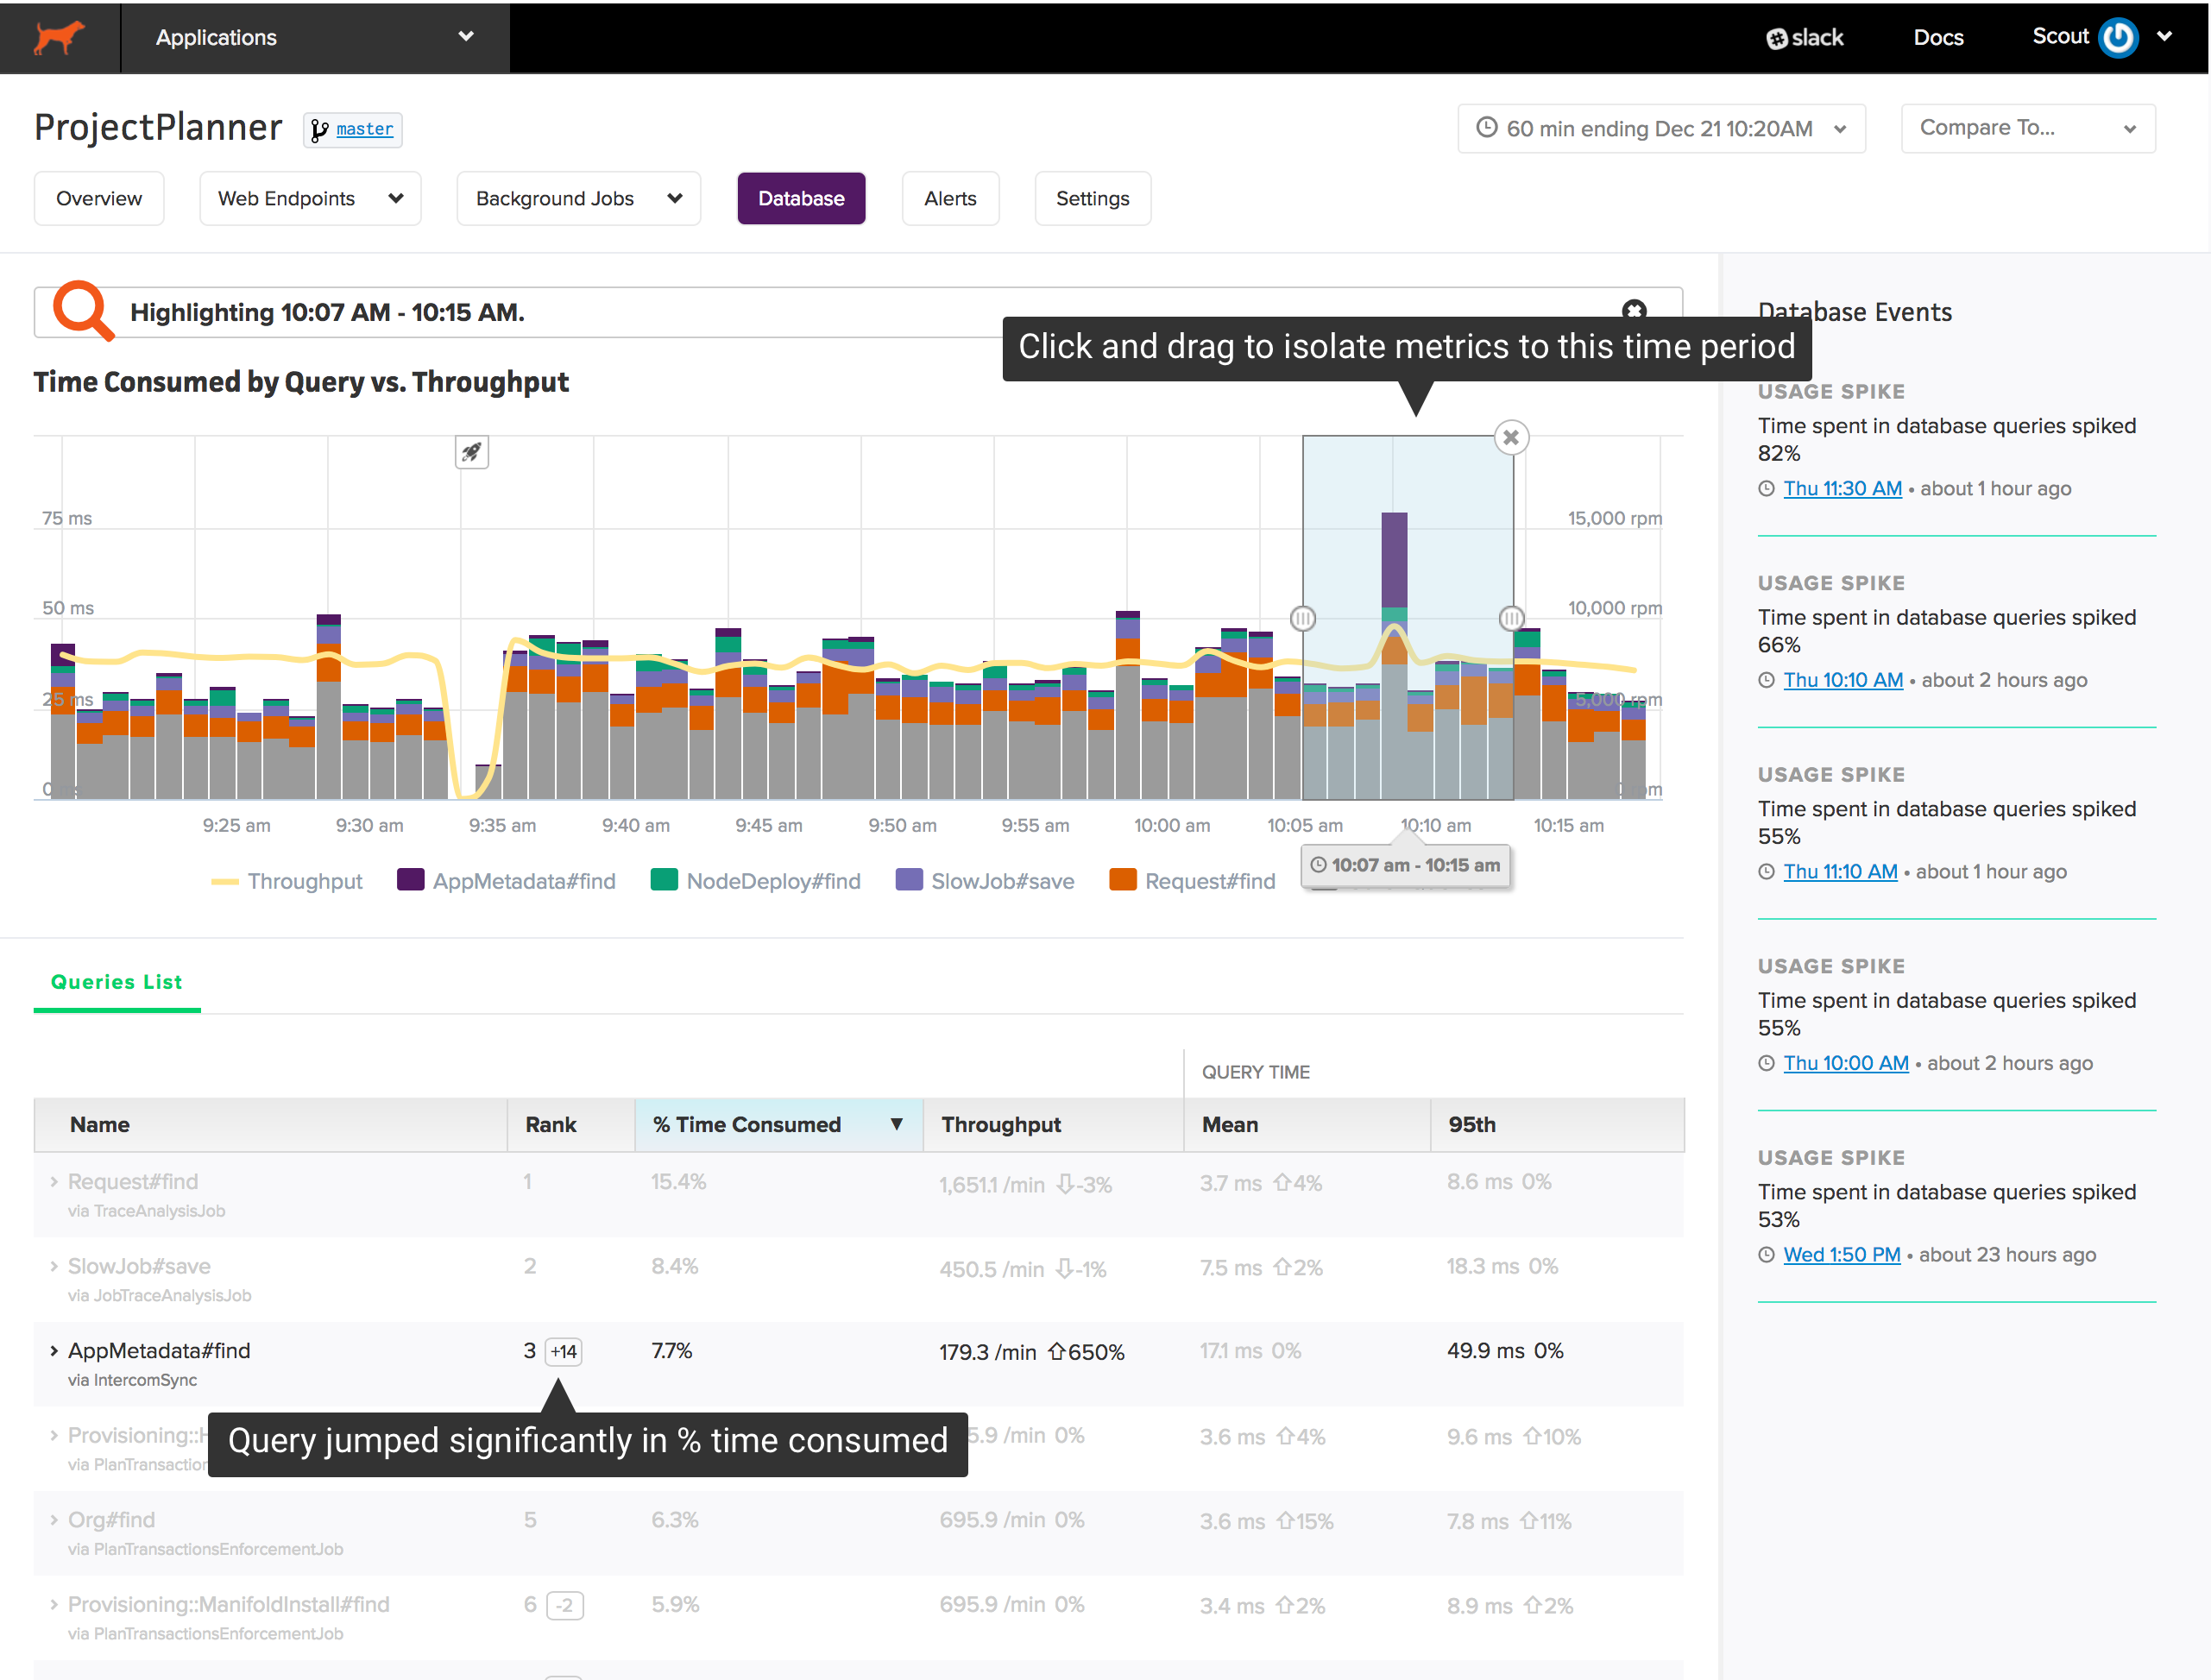
If there is a spike in time consumed or throughput, you can easily see what changed during that period. Click and drag over the area of interest on the chart:
...then inspect the trees
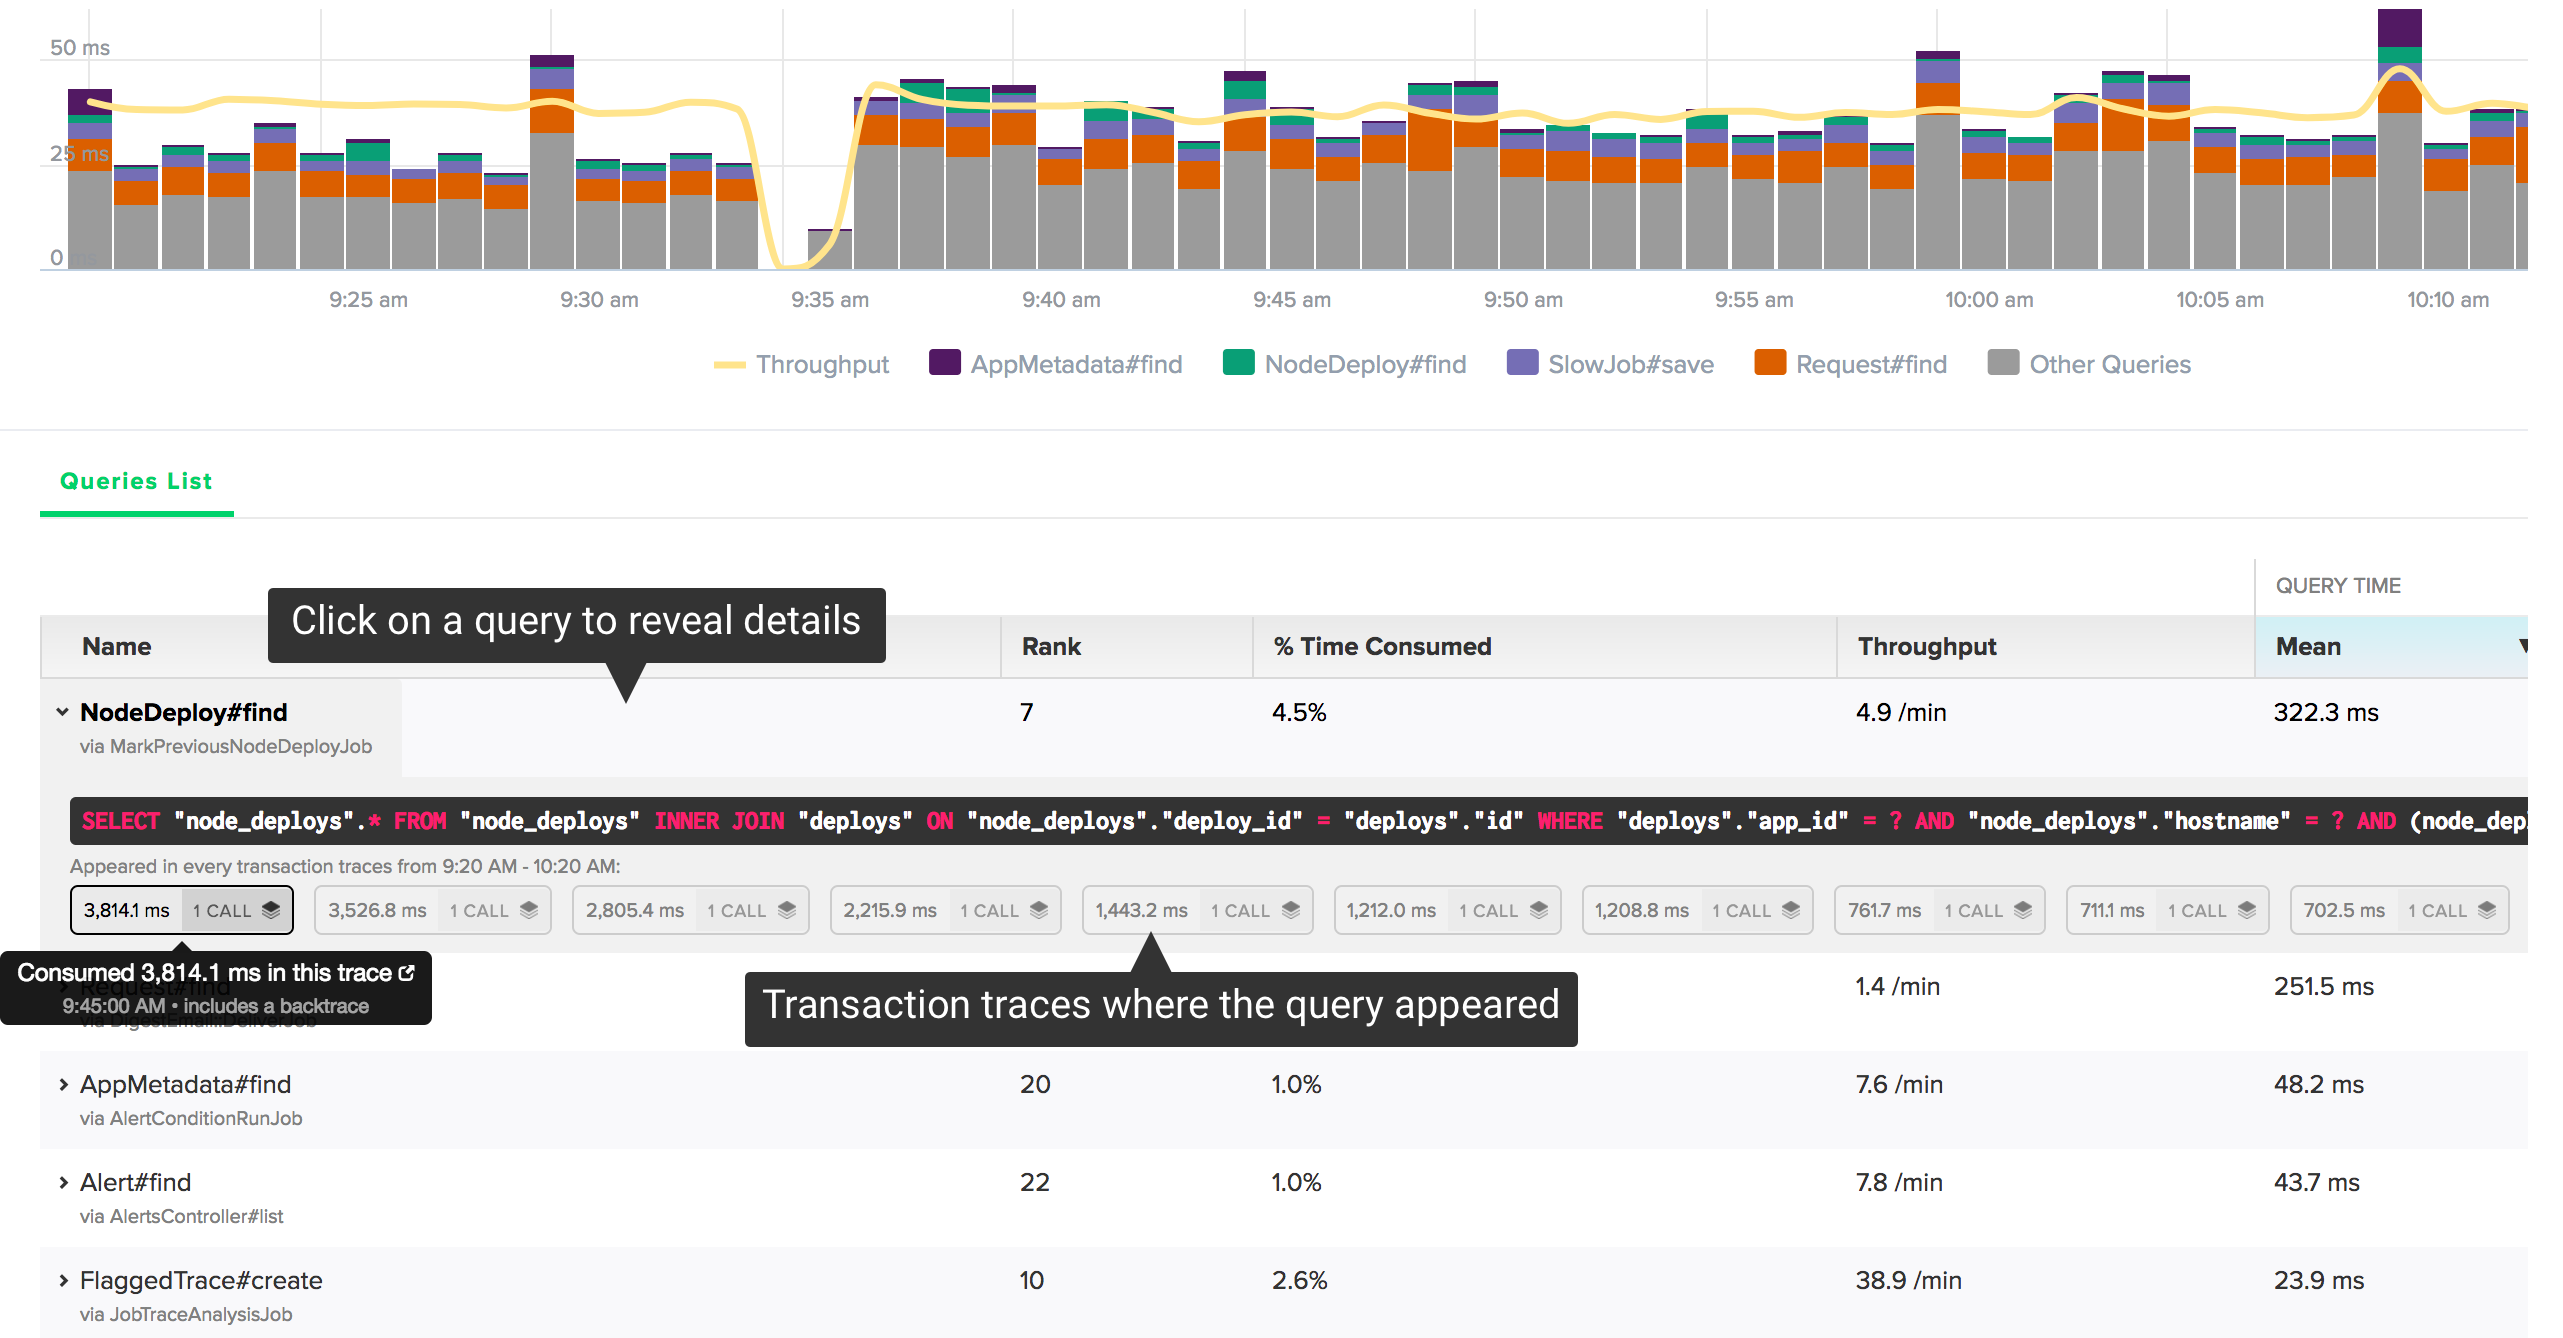
Once you've identified an expensive query, you need to see where the query is called and the underlying SQL. Scout makes this flow simple. Just click on a query to reveal details:
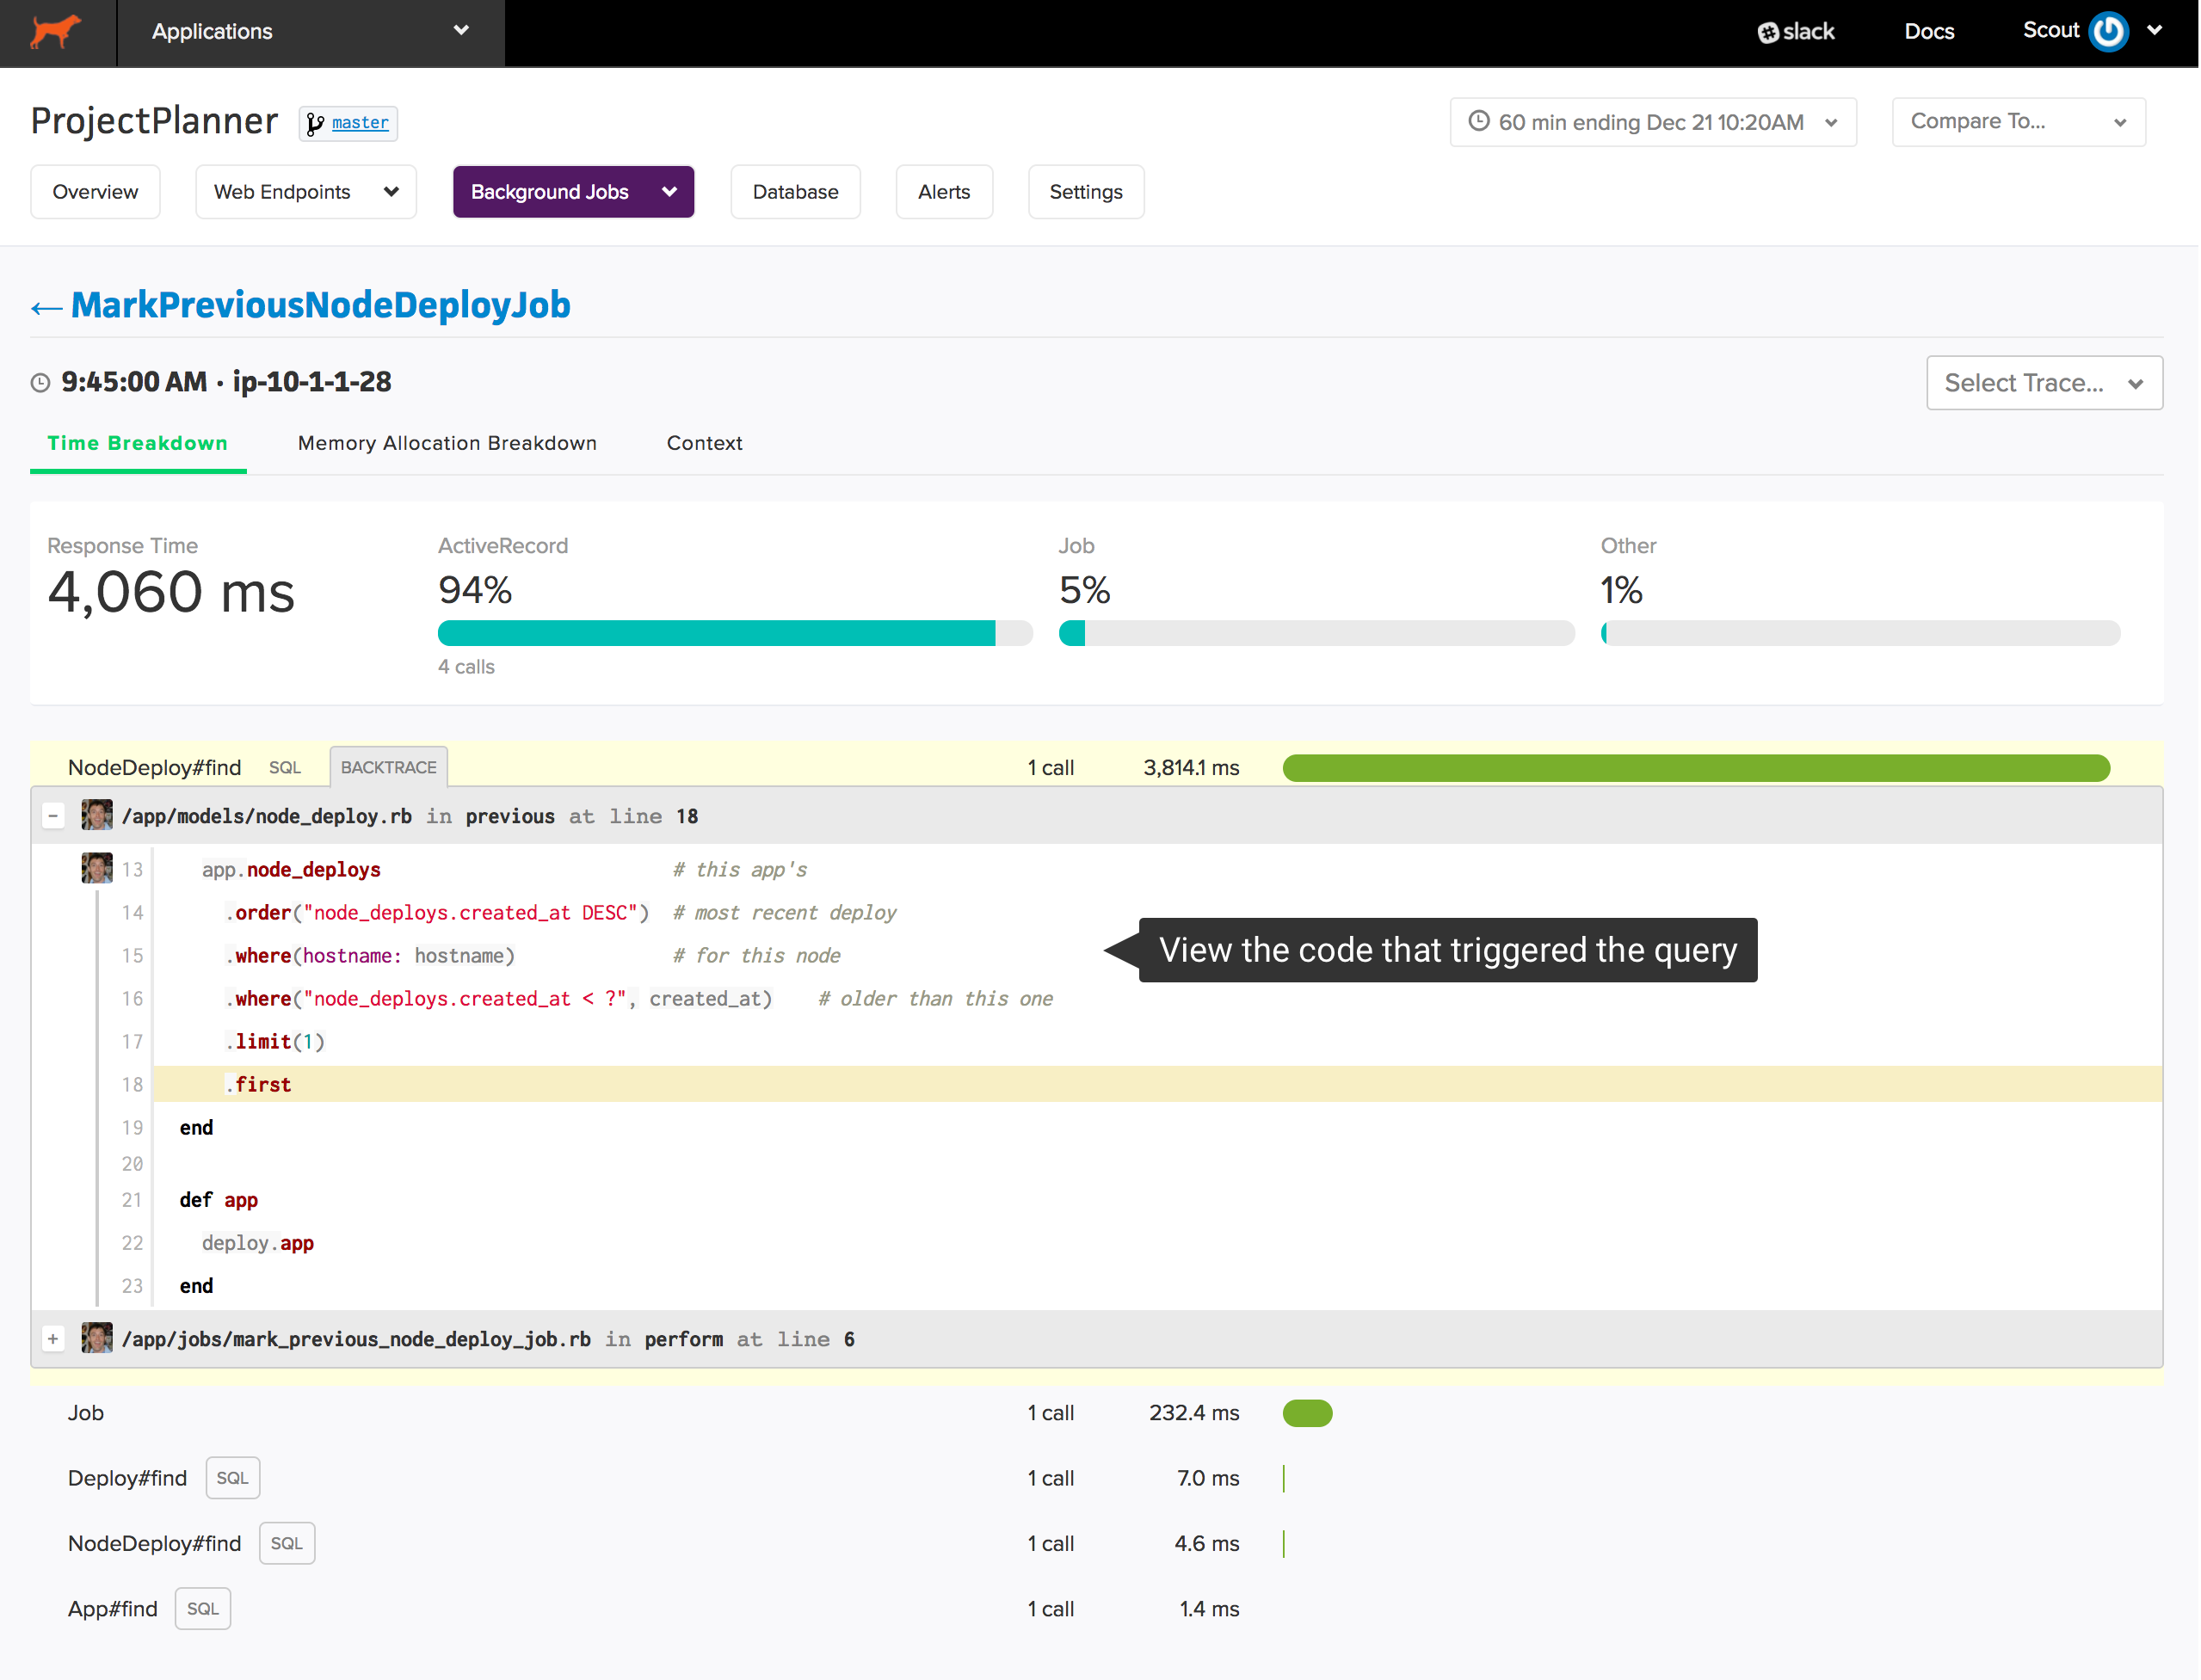
You'll see the raw SQL and a list of individual query execution times that appeared in transaction traces. Scout collects backtraces on queries consuming more than 500 ms. If we've collected a backtrace for the query, you'll see an icon next to the timing information. Click on one of the traces to reveal that trace in a new window:
The source of that trace is immediately displayed.
You can access this same detailed information directly from the web endpoint or background job detail views as well.
Installation
Just update - or install - the scout_apm gem in your application. There's no special libraries to install on your database servers.
Pricing
Database monitoring is available as an addon. More information is available on the billing page of your account.
New to Scout? Try out database monitoring in our credit card-free 14-day trial or learn more about database monitoring in our docs.
