You may have already discovered the 4 special views the lakehouse has in the queryinsights schema to track query performance. I made a video about the lakehouse special tables, but since then, they evolved a lot:
- queryinsights.exec_requests_history
- queryinsights.exec_sessions_history
- queryinsights.frequently_run_queries
- queryinsights.long_running_queries
Let’s discover what these tables have to offer for us to analyze the lakehouse performance.
exec_requests_history and performance metrics
This table contains the entire history of individual executions in the lakehouse. In order to know exactly when a bad query was executed and what this query was, this is the table we should look for.
This table provides us with the following metrics, most of them very straightforward:
- total_elapsed_time_ms
- allocated_cpu_time_ms
- data_scanned_remote_storage_mb
- data_scanned_memory_mb
- data_scanned_disk_mb
- row_count
The one which requires additional explanation is data_scanned_remote_storage_mb . What’s remote storage?
Simple: This is about shortcuts. When your query is done over shortcuts, the amount of data retrieved will appear as remote storage.
exec_requests_history: Start and End
This table has the fields submit_time and start_time. This allows us to calculate how long does it takes for a query to start the execution after it arrives in the lakehouse.
One example of a query for this check:
SELECT distributed_statement_id,
submit_time,
start_time,
status,
Datediff(s, submit_time, start_time) diff
FROM queryinsights.exec_requests_history
WHERE start_time > ‘2025-03-03 11:21’
ORDER BY diff DESC
It’s not usual, but I already faced issues with the environment where the queries took up to 1.5 minutes to start.
exec_requests_history: program_name
This field can bring some surprises. In a company where you make a lakehouse available, you may have users building apps over the lakehouse data without your knowledge.
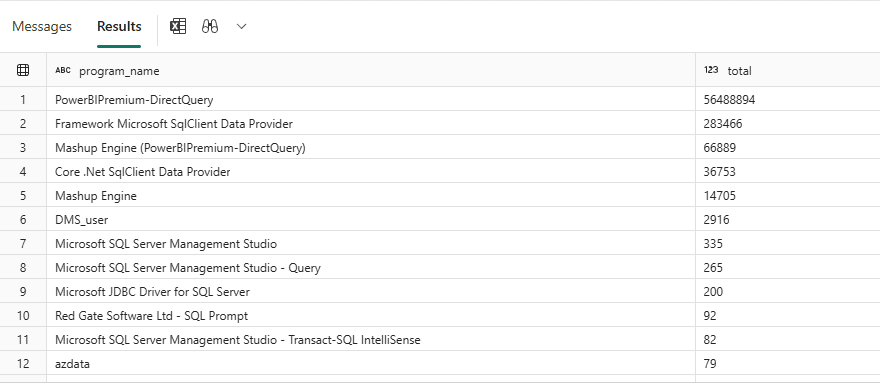
Analysing the program_name you can identify if this kind of access is happening.
This is an example of query over the program_name:
SELECT program_name,
Count(*) total
FROM queryinsights.exec_requests_history
GROUP BY program_name
ORDER BY total DESC
exec_request_history: login_name
This seems like another very good field to filter the query results and find exactly what you are looking for. However, you need to be careful.
When you are acessing the lakehouse through a semantic model, the semantic model may be configured to access the lakehouse with a single and specific login. In this case, the login_name appearing here is not the actual user, but the login_name configured in the semantic model.
The same can also happen with many other tools, such as data pipelines, data flows and notebooks.
I published videos about how to user service principals to authenticate the connections with resources, this is a good idea.
exec_sessions_history
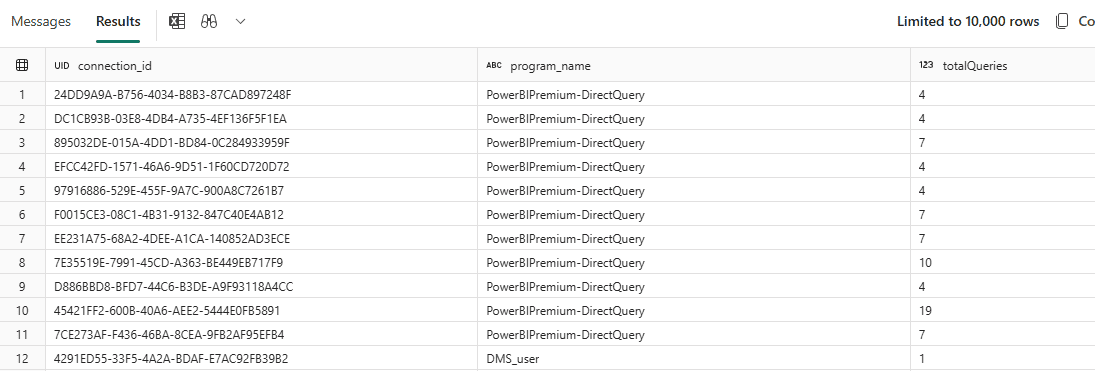
This table contains sessions, not individual queries. Each row in this table represents a connection made to the lakehouse.
Inside each connection, many queries may have been executed. Using this table, we can analyze the environment according to the connections and what each connection does
For example, the query below:
SELECT distributed_statement_id,
submit_time,
start_time,
status,
Datediff(s, submit_time, start_time) diff
FROM queryinsights.exec_requests_history
WHERE start_time > ‘2025-03-03 11:21’
ORDER BY diff DESC
We are checking how many queries each connection executed. From this point, we can play with order by and top to analyse how our usual connections to the lakehouse are.
frequently_run_queries and long_running_queries
These tables are not about individual queries. Each row in this table is an aggregation by the query text. The difference between these tables is on the name: One is for the most frequently executed queries, the other for the longest queries.
In each row, you will find aggregations of the metrics. For example, one long running queries may have been executed 10 times or 100 times. These tables aggregate all runs in one single row and provide an average of the metrics and some information about the most recent run.
The frequently_run_queries provides some additional metrics, such as the total of failures, success and cancelled queries and minimum and maximum values of the metrics, besides the average.
Conclusion
I hope this provides good inspiration about many ways to analyse the lakehouse query performance