 Memory diagnostic tools can be divided into runtime detection tools like Address Sanitizer (ASAN), Valgrind, and Application Verifier, and recording tools like rr and Time Travel Debugging (TTD). While runtime tools help catch memory errors as they occur, recording tools allow developers to trace memory modifications over time, making them a powerful combination for debugging complex issues.
A Brief and Incomplete Comparison of Memory Corruption Detection Tools
by Raymond Chen
From the article:
I promised last time to do a comparison of memory diagnostic tools. We have runtime diagnostic tools Address Sanitizer (ASAN), Valgrind, and Application Verifier (AppVerifier, avrf), and we have recording tools rr, and Time Travel Debugging (TTD)
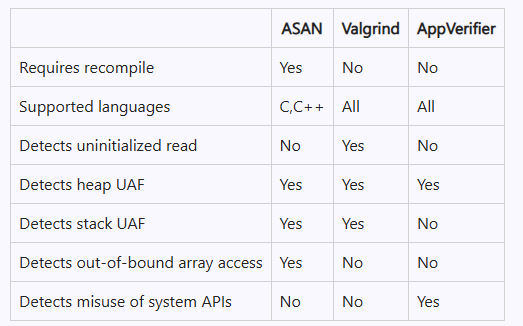
First, the runtime tools:
ASAN detects a lot more types of memory errors, but it requires that you recompile everything. This can be limiting if you suspect that the problem is coming from a component you cannot recompile (say because you aren’t set up to recompile it, or because you don’t have the source code). Valgrind and AppVerifier have the advantage that you can turn them on for a process without requiring a recompilation. That means that you can ask a customer to turn it on at their site, without having to deliver a custom build to them. This is even more important on Windows because you have no chance of giving them an ASAN-enabled version of, say, kernel32.dll.
Add a Comment
Comments are closed.