Putting in place a successful monitoring solution goes far beyond just picking an appropriate tool (such as Icinga, Nagios, Zabbix, etc). The success and effectiveness of monitoring systems rely on how the tools are used and the culture and behaviour of the team that is responsible for monitoring a given system.
Over the years, I‘ve worked on numerous projects, applications, and teams, each with its own challenges in achieving good monitoring and visibility over the application.
Historically, I’ve found it difficult to come across guidance and best practices for how to approach monitoring.
In this blog post, I cover some of the common pitfalls, observations, and challenges that I’ve experienced over the years and offer my opinion on how these challenges can be overcome to result in a great monitoring culture.
Anti-Pattern: Alerting on Everything
Being able to send an alert from a monitoring system is a fundamental requirement. Whilst I haven't used every monitoring tool out there, every one that I have used has the ability to send alerts and notifications – so I think it fair to say that all monitoring systems worth considering have alerting.
When metrics are added to a monitoring system, it can be tempting to setup an alerts for each one; after all, alerting is a core aspect of monitoring the health of the system.
There is a widely held belief that the more you monitor, the better, because this provides you with more information to understand the current state and behaviour of a system – and I agree with this approach which can be boiled down to "monitor everything".
However, we should avoid "alerting on everything." Alerting is often the most popular and common output from any monitoring system. However, it doesn't need to be the only output. Some metrics will correlate strongly with a system issue. Other metrics may not always correlate to a system issue but may be helpful to understand their trends in the event of an incident.
Don't Alert on OS Metrics
Most Operating System metrics, such as CPU and memory, aren't particularly useful for understanding whether a system is performing its job properly or not. Some systems can be resource-intensive, either on a consistent basis or for bursts of activity — as a result, high CPU or memory utilisation isn't necessarily indicative of a problem.
Consider a database server that runs an intensive workload and consumes significant CPU on an ongoing basis. If the CPU is high enough to trip an alerting threshold, but there is no degradation in query performance and response times – is there really an issue?
One of the fundamental issues of alerting on OS metrics is that they are low-level metrics that are rarely linked to a definition of what "working" means for a given system. Instead, we should look at metrics that are aligned with a definition of working.
For example, more suitable metrics might be:
- Latency of API calls to a payment provider
- Proportion of successful vs failed login attempts
If API calls to our payment provider are timing out (we're not taking money from customers), or customers are unable to log in to the system, this is more indicative of an issue than CPU or memory.
OS metrics are still important — but not for alerting. They are still important for diagnosing issues and understanding a system's behaviour and performance. As a result, they should be monitored, but their output is more likely to be useful in graphing and trend reporting rather than alerting.
Beware of Email Alerts
Email inboxes already have to deal with large volumes of information and messages even before monitoring alert emails get involved. It is easy for monitoring alerts to get missed or overlooked in a busy email inbox amidst all the other priority emails that are vying for attention.
Email alerts are also ineffective at getting people out of bed in the middle of the night when a critical issue occurs.
In most situations, there are two types of alerts:
- Important alerts that require immediate action or preventative action to stop a potential issue from becoming an incident.
- Informational or FYI alerts that contain information about unusual events or trends for a given metric but do not require a specific action.
Putting all kinds of alerts into an email inbox is one way to guarantee that your monitoring alerts will contribute to someone's sense of inbox fatigue.
Important alerts requiring immediate action should use an appropriate tool that will get someone out of bed in the middle of the night – such as PagerDuty, OpsGenie, etc. Not only will these systems do a better job of paging you when there is an issue, but they also provide additional capabilities such as planning and managing escalations and rotas.
Informational or FYI alerts are often higher in volume than important alerts and contribute to filling people's inboxes. These alerts are sometimes best directed into a shared channel in Slack or Microsoft Teams that the team can monitor and pick up as needed.
Beware of Fixed Thresholds
Nagios can possibly be credited with causing us to think of monitoring thresholds as fixed values. It popularised the concept of specifying a threshold for warnings and critical levels for alerts, which is a concept that continues to survive today. Popular nagios-compatible tools, such as Shinken and Icinga, continue to use this simplistic approach to thresholding.
Fixed thresholds can be useful – e.g. issuing a warning at 80% disk utilisation, and a critical at 90%. However, these techniques are often quite primitive compared to applying statistical analysis to the trend of a metric over time.
Using statistical analysis is only going to be possible if your monitoring system retains a historic time-series record of each metric over time. For example, a disk utilisation check could be more sophisticated so that rather than just considering has 80% or 90% of the disk been utilised, the monitoring system could look at the rate of change over time, to determine if the disk is being filled more rapidly that what "normal behaviour" would dictate – this provides a better view of health disk utilisation and unexpected behaviour beyond just "is the disk nearing its limit".
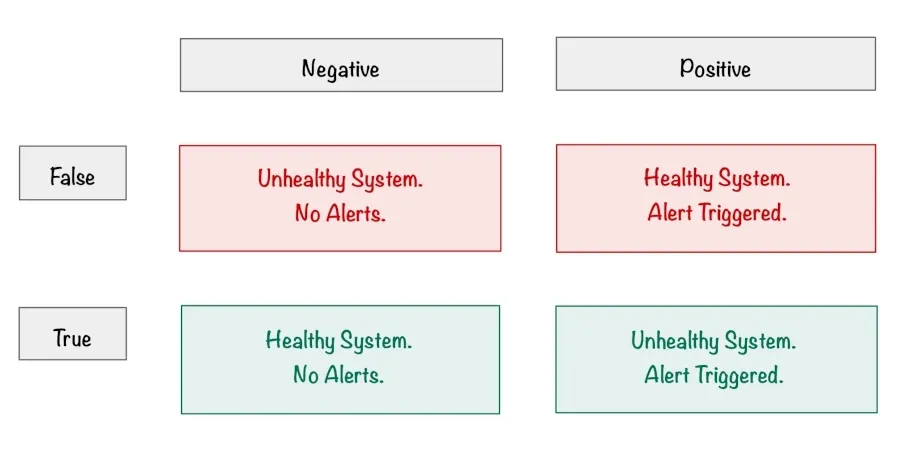
Understand the Dangers of False Positives
False positives in a monitoring system can be dangerous, and a high false positive rate can lead to alert fatigue, erode the team's monitoring culture and lead to a situation where the team doesn't trust the monitoring system to the point where they ignore it entirely.
In a well-tuned environment, a monitoring alert should trigger a sense of urgency and a healthy rush of adrenaline. If neither of these is the case for you, then you've probably been subjected to alert fatigue, where a barrage of poorly tuned monitoring alerts has destroyed your sense of importance around monitoring.
So what's the solution? Delete and tune your monitoring alerts to remove and minimise false positives and reduce this number to an acceptable level. Entirely eradicating false positives will be hard work, and would probably be unrealistic. However, the goal is to have a monitoring system that the team trusts and doesn't burn people out with alert fatigue – the odd false positive here and there will be more than acceptable.
For each alert that causes you a false positive, consider the following:
- What is the corrective action or immediate next step that has to be taken when this alert triggers?
If there isn't a clear corrective action or next step, consider deleting the alert or downgrading it to an informational alert to a Slack/Microsoft Teams channel. - What is the impact of this alert?
If the impact of the alert isn't clear or well understood, consider whether the alert is needed at all. Or if this should be downgraded to an information alert to a Slack/Microsoft Teams channel. - Can the threshold or behaviour be modified?
If the alert is considered important enough to retain, can the threshold of behaviour behind the alert be improved to make the alert more accurate?
Like with anything, keeping a monitoring system in good working order requires regular maintenance and pruning. Any new alerts should be introduced gradually – ideally after an incubation period.
Incubation Periods for New Alerts
Any new alert often requires an element of tuning before it becomes a predictable and reliable indicator of an issue. As a result, new alerts can be an unwanted source of noise and false positives during this teething period that will add little to no value to the wider team and will arguably act as nothing more than a distraction from day-to-day responsibilities.
Having an incubation period can be a helpful way to incubate an alert over a period of, let's say, a week until the alert has demonstrated a level of maturity that is likely to be effective rather than a source of false positives. During this period, it is often appropriate that the alert goes only to the person developing the alert so that they can fine-tune any thresholds to minimise false positives. By only directing alerts at the person responsible for developing the alert, prevents and reduces the chance of the wider team being fatigued by a new alert that is prone to being more noisy.
At the end of this incubation period, the team should review the alert and decide whether it should "go live" or if further changes are required and/or a longer incubation period is warranted.
A process like this can help ensure that the team is bought into and understands the value of new alerts and that the team feel a sense of ownership over that alert.
Use Playbooks
When an alert goes off – either during the day or in the middle of the night – the last thing you want to be doing is figuring out from a cold start how to resolve the issue. For most systems and alerts, it's possible to document why the alert exists and what steps can be taken to investigate or resolve the issue – this is what Playbooks are for.
Playbooks have a number of advantages:
- They assist in standardising the response to an incident, reducing the likelihood of errors or confusion during an incident
- They often lead to faster response times because triage steps are documented, as well as guidance on how to resolve potential common causes
- They can provide clear guidance on how and when an incident should be escalated and what the escalation path looks like
Monitoring alerts often focus on communicating the basis of the problem (what's broken, and what threshold has been breached). In practice, an alert should also provide the starting point for an investigation or resolution. When an alert triggers in your monitoring system, you want the alert to point the on-call engineer towards any relevant playbooks that can assist in resolving the issue.
Playbooks should be regularly maintained, and after an incident, the team should consider if any playbooks need updating or creating to cover lessons learned from the incident moving forwards.
Summary
Good quality alerting and monitoring will have a positive impact on the culture and behaviour of the team that is responsible for monitoring a given system. In equal measure, bad quality alerting and monitoring will erode the culture and behaviour of the team.
All alerts within a monitoring system should be constantly reviewed to determine whether any need to be tuned, improved, removed, or augmented with new alerts. Keeping alerting and monitoring in a good state requires continuous, ongoing maintenance.
Whilst the quality of alerting can be assessed from a hard statistics perspective (such as false positive rate, false negative rate, mean time to detect, mean time to repair, etc), good-quality monitoring alerts should also have the following qualities:
- a clear corrective action or immediate next step to investigate or resolve the issue – and this should be captured in a playbook that can be accessed from the alert
- a good true-positive track record and a low false-positive and false-negative rate
- the buy-in of the wider team – if it doesn't, then there is work to do to either refine or ditch the alert
- sends notifications to the team via a channel that is appropriate to the severity/impact/nature of the alert (e.g. Email vs SMS vs Slack/Teams vs PageDuty/OpsGenie/etc.)