
Introduction
This series of blog posts discusses the methods of estimating carbon emissions of end-user devices. Specifically, this looks at web user interfaces, such as websites and web applications, and the devices we use to access them. After intending to write a single blog post, the research journey prompted me to reconsider how to present this to an audience. So, this is the first of a series of blog posts that broach this subject and look at the various methods, concluding with a comparison of the techniques.
This blog post starts where I first started with my research journey - The Sustainable Web Design (SWD) methodology.
Measuring the Carbon Emissions of Web User Interfaces and Devices
Measuring the greenhouse gas (GHG) emissions of a web user interface is not an easy feat.
However, the folks at Green Web Foundation have created open-source tools to make it easier for anybody with that curiosity in mind. CO2.js is a javascript library that returns an estimated CO2e value for a web page. It simply takes a payload in bytes and applies the Sustainable Web Design (SWD) method (by default and the focus of this article) to estimate the energy used to move that data from a data centre to the user’s device. It can also consider the grid intensity at each location of the data centre, network and end-user device to produce a more accurate estimate.
The CO2.js and SWD method has quickly established itself as an industry standard, used by many online “carbon calculators” such as websitecarbon.com, ecograder.com, digitalbeacon.co, ecoping.earth etc. It’s also used in web performance tools such as Sitespeed, Statsy, and Firefox Profiler.
But let’s look closer at that SWD method behind the CO2.js curtain.
Sustainable Web Design Methodology
The method has two parts: calculating the energy use and then applying the grid carbon intensity to that energy to get a gCO2e value.
Estimating Energy Use
The key metric is a simple calculation. The estimated annual global energy use for the internet (1,988 TWh) is divided by the estimated global yearly data transferred (2,444 exabytes (EB)):
\[1988TWh / 2444EB = 0.81kWh/GB\]This straightforward equation proportionally marries energy use to data transferred.
So, to estimate the energy used (kWh), multiply the data transferred in gigabytes (GB) by 0.81.
\[E = D_t \times 0.81\]That’s too easy, right?
Well, yes. There are far more complexities and variables that could be considered, especially in a system boundary so broad that it encompasses all internet energy use, from data centres to end-user devices. We’ll get into the system boundaries later in this article, but as Tom Greenwood of Wholegrain Digital explains here, it really isn’t that simple, but it’s what we’ve got.
Carbon Intensity
The energy used has to come from somewhere, whether that’s from fossil fuels (such as coal or gas), low-carbon (such as nuclear) or renewable energy sources (such as wind or solar). Each energy source has an associated carbon intensity, measured in grams of carbon dioxide equivalent per kilowatt hour (gCO2e/kWh). For example, the energy produced from a coal power plant has a carbon intensity of 820gCO2e/kWh. In contrast, the energy produced from a hydro-power plant has a carbon intensity of only 24gCO2e/kWh.
However, the energy grid is typically served by a mixture of these sources, and the mix varies by location. The mixture of these sources and the overall carbon intensity data are available for most countries and regions from Ember’s Data Explorer. The global carbon intensity value of 490gCO2e/kWh can be used when the location of the energy source is unknown.
So, the product of the estimated energy use and the carbon intensity of that energy gives us an estimated carbon emission.
\[C = E \times C_i\]Where:
- $C$ is the total carbon emission (gC02e)
- $E$ is the total energy (kWh)
- $C_i$ is the carbon intensity (gC02e/kWh)
Again, it is a simple formula for a complex problem.
Using the Methodology
The example use of the SWD method is a little more complicated, but it demonstrates how it can be used to get more accurate results. It applies some assumptions: that 75% of visits to a web page are from new visitors or, more precisely, uncached visits. For the 25% returning visitors, the data transferred will only be 2% of the uncached data transfer, meaning a significant reduction of data transfer due to cached files.
\[E_v = (D_v \times 0.81 \times 0.75) + (D_v \times 0.81 \times 0.25 \times 0.02)\]where:
- $Ev$ is the energy per visit (kWh)
- $D_v$ is the data transfer per visit (GB)
Of course, if you have actual metrics, you can easily replace these assumptions with them to obtain further accurate estimates.
After calculating the energy per visit, we can apply the carbon intensity. We can use the global carbon intensity value (490gCO2e/kWh) for a generalised worldwide perspective or if we assume a global distribution and audience.
\[C_v = E_v \times 490\]If we’re confident about where our web page and data are stored and where our users are accessing the web page, we can use a more specific carbon intensity.
So, whilst the methodology is simple, there are ways to adjust and apply more accurate metrics to obtain better estimations.
The model defines the system boundaries and how energy use and emissions make up the overall energy per byte metric, allowing us to get even more granular when calculating emissions.
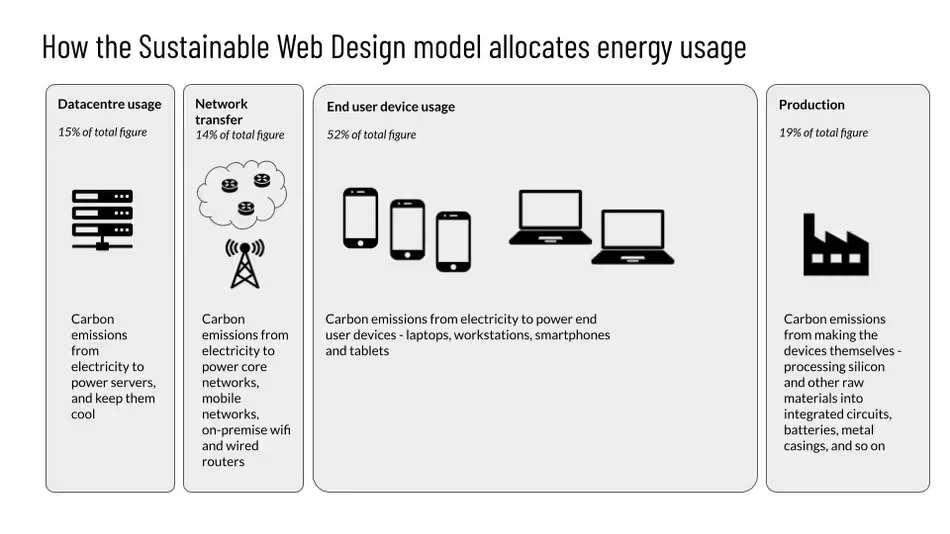
System Boundaries
The SWD method explains these system boundaries based on a research study by Anders Andrae. Specifically, it breaks down the energy use per system:
- 15% – Data centre usage
- 14% – Network transfer
- 52% – End user device usage
- 19% – Production of hardware (data centre, network and end-user devices).
This provides more granular insight and control to the calculation, allowing us to extract and apply data as required.
Example use of the SWD Method
For example, we’ll look at the Scott Logic blog page and calculate the estimated carbon emissions using this methodology. We will measure the page load of blog.scottlogic.com using Google Chrome’s Network tab in the Developer tools. This particular page employs an infinite scroll feature that continues to load more blog posts as you reach the bottom of the page. For this test, we will avoid scrolling the page and only load the initial collection of posts and assets.
First, we’ll measure the page by emptying the cache and hard reloading the page, then reload the page (with the page now cached). The results are as follows (at the time of writing this):
- Empty cache: 4.3MB transferred
- Cached: 0.0106MB transferred
We have metrics that can tell us that the number of visits over the past 12 months is, on average, 48,300 visits per month. We’ll assume that 25% of visitors are returning and 75% are new visitors.
With this data, we can use the SWD method to calculate the estimated carbon emissions of the blog page as follows:
\[E_v = (E_t \times D_n \times V_n) + (E_t \times D_r \times V_r)\]Where:
- $E_v$ is the energy per visit
- $E_t$ is the energy per GB transferred (0.81kWh/GB)
- $D_n$ is the data transferred for new visits (uncached, 4.3MB = 0.0043GB)
- $V_n$ is the percentage of new visits (75%)
- $D_r$ is the data transferred for returning visits (cached, 0.0106MB = 0.0000106GB)
- $V_r$ is the percentage of returning visits (25%)
Using the system boundaries, we can break down that energy use as follows:
- User device energy: $0.0026 \times 0.52 = 0.001352kWh$
- Network energy: $0.0026 \times 0.14 = 0.000364kWh$
- Data centre energy: $0.0026 \times 0.15 = 0.00039kWh$
- Hardware production energy: $0.0026 \times 0.19 = 0.000494kWh$
Using The Green Web Foundation’s Green Web Check, we can confirm that the blog pages are not hosted using a sustainable energy source. We can also check the location of the webserver using traceroute tools to discover that it is hosted in California, US (with an average energy mix and carbon intensity of 386gCO2e/kWh). The device being used (where I am located), is in the UK (238gCO2e/kWh). For the network and hardware we will assume a global carbon intensity of 490gCO2e/kWh (given the lack of specific evidence otherwise). With this, we can calculate the estimated CO2 emissions per visit per system:
- User device carbon emissions: $0.001352 \times 238 = 0.322gCO2e$
- Network carbon emissions: $0.000364 \times 490 = 0.178gCO2e$
- Data centre carbon emissions: $0.00039 \times 386 = 0.151gCO2e$
- Hardware production carbon emissions: $0.000494 \times 490 = 0.242gCO2e$
Giving a total estimated carbon emissions per visit of 0.893gCO2e.
Applying the scale of the blog’s monthly visits (48,300), we can estimate the emissions as 43.1kgCO2e per month or 517kgCO2e per year.
Critiquing the SWD Method
Understanding the SWD method, how the energy per byte metric is calculated and how it breaks down is crucial to understanding the validity and confidence of the resulting emissions calculation. There are so many nuances and variables to consider, and they should be carefully considered and understood when estimating the emissions of your websites and applications.
Using the CO2.js tool and passing in the number of bytes for a page load is not the magic bullet that tells you precisely how much CO2 emissions your website creates.
Likewise, the SWD model cannot simply be taken at face value and reiterated as a simple fact. It’s critically important to understand the data source and how it came to be to avoid misuse and misleading information. A recent article on the Mozilla blog is such an example, boiling everything down and simply implying that 52% of carbon emissions in digital technology are from device use, 29% from data storage and transfer, and 19% from hardware production.
It simply isn’t that simple.
Firstly, let’s take another look at the kWh per GB metric. The SWD method, and by extension, the CO2.js library that uses it, is based on a top-down, “attributional”, approach, looking at average figures of the internet’s total energy use divided by the internet’s total data transfer. What it gives us is a heuristic value to use as a guide to measure a web page’s energy use and carbon emissions. This is an acceptable method to calculate a web page with the understanding that it is a very simplified and grossly estimated attributional model.
However, as a business looking to reduce its digital carbon footprint meaningfully, we’ll have to dig a little deeper to understand how to really make an impact. What is the most significant cause and effect that generates these carbon emissions? And what are the consequential effects of change?
The kWh per GB metric implies that emissions are proportional to page weight. A larger page load = more emissions. It’s a handy proxy that’s easy to measure and make a generalised assumption that more content transferred must use more energy. Therefore reducing the page load by 50% would equate to reducing emissions by 50% too? But what consumes energy isn’t data. It’s processing power, screen display, and time (among other things). A javascript application will require further CPU processing after the data transfer. Loading a 1 MB javascript application file will consume more energy than loading a 1MB image file due to the client-side rendering of the web pages.
Whilst it’s possible to measure the data transfer of each page load and user interaction of a website or application throughout a user journey to calculate the total energy use, this doesn’t consider how much time a user spends on the website or the processing power of using that application. For example, opening an Excel document in the browser has an initial page load which can be measured, but a user could spend an hour editing and using that document, which would consume far more power over that time. It also doesn’t account for the base power consumption of that device during that time, which varies wildly between a smartphone and a desktop computer.
Summary
The SWD method provides a handy attributional model to roughly estimate the carbon emissions of a website or web application. However, obtaining more detailed measurements of the emissions of our technology estate is a far more complicated landscape. And this is important to understand when it comes to driving change, and reducing emissions. The SWD method does not translate well as tool for measuring this change, as the consequential effects of change are far more nuanced.
Look out for part two of this series as I explore the available power profiling tools. I’ll share my results and findings as I compare Firefox Profiler, Powermetrics and a good old fashioned energy meter on the wall.

