Introduction
Containerd is a popular container runtime used in Kubernetes. It serves as the underlying engine responsible for managing low-level tasks, such as creating and managing container sandboxes, starting processes within those sandboxes, and handling image pulling. As Containerd plays a crucial role in the smooth operation of containerized applications, monitoring its performance and health becomes essential.
Containerd’s significance lies in its ability to provide a standardized and reliable container runtime environment. It adheres to the Container Runtime Interface (CRI) specification, ensuring compatibility with Kubernetes. Thanks to its plugin-based architecture, Containerd offers flexibility and extensibility, allowing users to integrate different ways to run containers and use different snapshot plugins.
While Containerd simplifies the management of containers, ensuring their reliability is of paramount importance. Monitoring Containerd allows you to gain insights into the health of your Kubernetes node. By monitoring Containerd, you can effectively identify and troubleshoot issues and ensure the overall stability of their containerized infrastructure.
In the following sections, you will explore the architecture of Containerd, delve into its core plugins, discuss the importance of monitoring Containerd, and explore integration with popular monitoring tools like Prometheus and OpenTelemetry Tracing. Let’s begin by understanding the foundational concepts of Containerd and its plugin-based architecture.
Containerd Architecture
Containerd is based on a plugin architecture, where parts of the code base can easily be swapped. Plugins are responsible for tasks such as snapshotting, metadata management, and task scheduling. For example, the snapshotter plugin handles the creation and management of container snapshots, while the metadata plugin manages storing and retrieving container metadata. It is common for plugins to depend on other plugins to execute parts of the functionality.
Some plugins provide a gRPC Service. These plugins have the io.containerd.service.v1 type and listen on a local socket. This allows you to interact with them directly. gRPC service plugins usually call local plugins like io.containerd.service.v1 tasks-service gRPC plugin proxies calls to io.containerd.grpc.v1 tasks plugin.
You can manage plugins via ctr plugins command. The following example shows how to list available plugins:
ctr plugins ls

TYPE                                   ID                       PLATFORMS         STATUS
io.containerd.content.v1               content                  -                 ok
io.containerd.snapshotter.v1           native                   linux/arm64/v8    ok
io.containerd.snapshotter.v1           overlayfs                linux/arm64/v8    ok
io.containerd.snapshotter.v1           devmapper                linux/arm64/v8    error
io.containerd.snapshotter.v1           zfs                      linux/arm64/v8    skip
io.containerd.metadata.v1              bolt                     -                 ok
...
io.containerd.differ.v1                walking                  linux/arm64/v8    ok
io.containerd.event.v1                 exchange                 -                 ok
io.containerd.gc.v1                    scheduler                -                 ok
io.containerd.lease.v1                 manager                  -                 ok
io.containerd.runtime.v2               shim                     -                 ok
io.containerd.sandbox.store.v1         local                    -                 ok
io.containerd.sandbox.controller.v1    local                    -                 ok
...
io.containerd.streaming.v1             manager                  -                 ok
io.containerd.service.v1               containers-service       -                 ok
io.containerd.service.v1               content-service          -                 ok
io.containerd.runtime.v1               linux                    linux/arm64/v8    ok
io.containerd.monitor.v1               cgroups                  linux/arm64/v8    ok
io.containerd.service.v1               tasks-service            -                 ok
io.containerd.grpc.v1                  introspection            -                 ok
io.containerd.transfer.v1              local                    -                 ok
io.containerd.grpc.v1                  containers               -                 ok
io.containerd.grpc.v1                  events                   -                 ok
io.containerd.grpc.v1                  images                   -                 ok
io.containerd.grpc.v1                  sandboxes                -                 ok
io.containerd.grpc.v1                  tasks                    -                 ok
io.containerd.grpc.v1                  cri                      linux/arm64/v8    ok
io.containerd.tracing.processor.v1     otlp                     -                 ok
Additionally, you can investigate if a plugin has errors using ctr plugin ls command:
ctr plugin ls --detailed id==devmapper
Type:          io.containerd.snapshotter.v1
ID:            devmapper
Platforms:     linux/arm64/v8
Error:
               Code:        Unknown
               Message:     devmapper not configured
Containerd runtimes
The plugin architecture allows Containerd to work in various scenarios and to use different container runtimes, such as runc, gvisor, or kata containers. This article will focus on the core io.container.runtime.v2 task runtime plugin. This plugin schedules containerd-shim-runc-v2 shims, which launch containerized processes via runc command.
runc is a command line tool that allows you to create and manage containers based on the OCI (Open Container Initiative) runtime specification. With runc, you can start, stop, and monitor containers and manage their namespaces, filesystems, and networking. To launch a container using runc, you must have a root filesystem and OCI spec. In the following example, we will use docker to create a root filesystem, then generate an OCI runtime specification using runc spec command, lastly, launch a container using runc run.
# create a container
docker run --name cont1 alpine:latest sh

# export it's rootfs to use it as our base
docker export cont1 > rootfs.tar

# extract it to a folder
mkdir -p ./rootfs
tar -xf rootfs.tar -C ./rootfs

# generate runc spec
# this will create config.json
runc spec

# Change the spec args to
#		"args": [
#            "sh", "-c", "sleep 10000 && echo \"Hello, World!\""
#
#		],

# run the container
sudo runc run cont1
This will run a containerized process. You can view it running by listing all processes and finding the runc one by executing ps auxf | grep runc:
|           \_ runc run cont1
root      407990  0.0  0.0   1628   768 pts/0    Ss+  08:52   0:00  |               \_ sh -c sleep 10000 && echo "Hello, World!"
root      407996  0.0  0.0   1612   768 pts/0    S+   08:52   0:00  |                   \_ sleep 10000
To better understand runc you should look at the config.json, as it allows you to control Linux cgroups, namespaces, and process capabilities. To learn more, check out Beginners Guide to Runc.
Next, let’s cover some of the core containerd plugins.
Containerd plugins
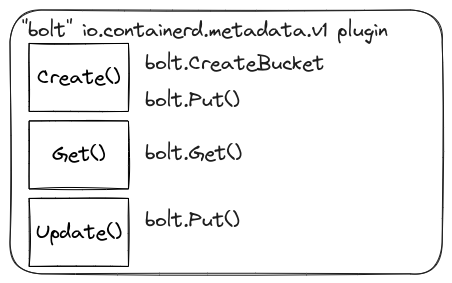
The “bolt” io.containerd.metadata.v1 plugin
The “bolt” io.containerd.metadata.v1 plugin is responsible for providing a key-value store for metadata in Containerd. It uses bolt db (etcd also uses a version of bolt db) to persist the data on disk. Typically, it writes the file in /var/lib/containerd/io.containerd.metadata.v1.bolt/meta.db. This plugin mainly provides functionality for storing and retrieving metadata associated with containers, sandboxes, namespaces, and images. This metadata can include labels, annotations, and other descriptive data, allowing for easier container and image management and organization.
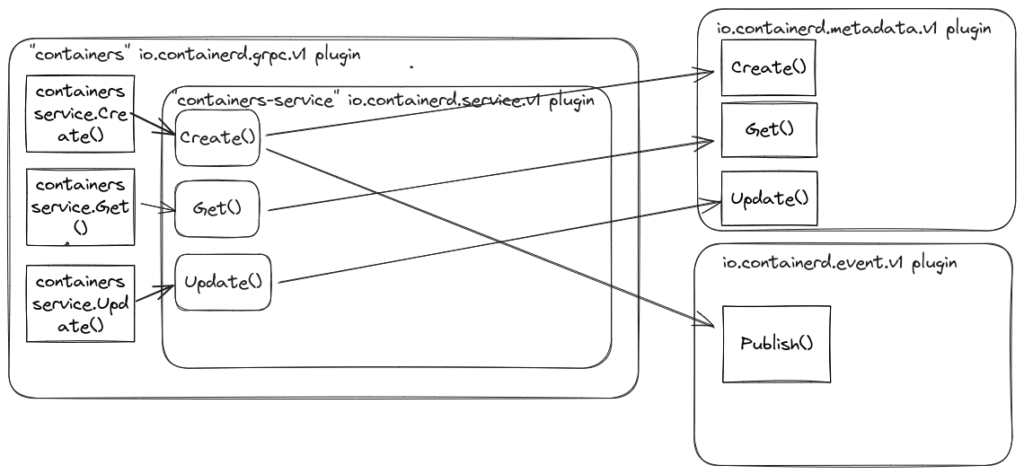
The “containers” io.containerd.grpc.v1 plugin
The “containers” plugin provides an API to store and retrieve container metadata. It uses the metadata plugin to store and retrieve container information. Also, it publishes events “/containers/create”, “/containers/update”, “/containers/delete” via the io.containerd.event.v1 event plugin. This plugin does not start containerized processes but stores the metadata, such as the container’s runc spec.
There is also “containers-service” io.containerd.service.v1 plugin provides a gRPC service interface plugin for the “containers” io.containerd.grpc.v1 plugin. You can call the service API via the ctr container commands. For example, to create new container you can call:
ctr container create docker.io/library/nginx:latest container1Next, the following command shows how to list containers:
ctr container ls

CONTAINER     IMAGE                             RUNTIME
container1    docker.io/library/nginx:latest    io.containerd.runc.v2
Lastly, the following command shows how to see the information stored for a container:
ctr container info container1

{
    "ID": "container1",
    "Labels": {
        "io.containerd.image.config.stop-signal": "SIGQUIT",
        "maintainer": "NGINX Docker Maintainers \[email protected]\u003e"
    },
    "Image": "docker.io/library/nginx:latest",
    "Runtime": {
        "Name": "io.containerd.runc.v2",
        "Options": {
            "type_url": "containerd.runc.v1.Options"
        }
    },
    ...
}
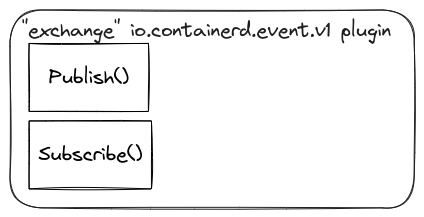
The “exchange” io.containerd.event.v1 plugin
The “exchange” io.containerd.event.v1 plugin in Containerd serves the purpose of publishing and subscribing to event streams related to the container lifecycle and its operations. It acts as a message broker, broadcasting information about what’s happening with your containers as they go through their various stages.
Here’s a breakdown of its key roles:
- Monitoring container operations: It tracks and reports events like container creation, start, stop, pause, resume, kill, and delete.
- Providing real-time updates: These events are streamed in real-time, allowing you to stay informed about the current state of your containers.
You can use ctr events command to subscribe to all events and print them to standard output. This is very useful when you are debugging contained.
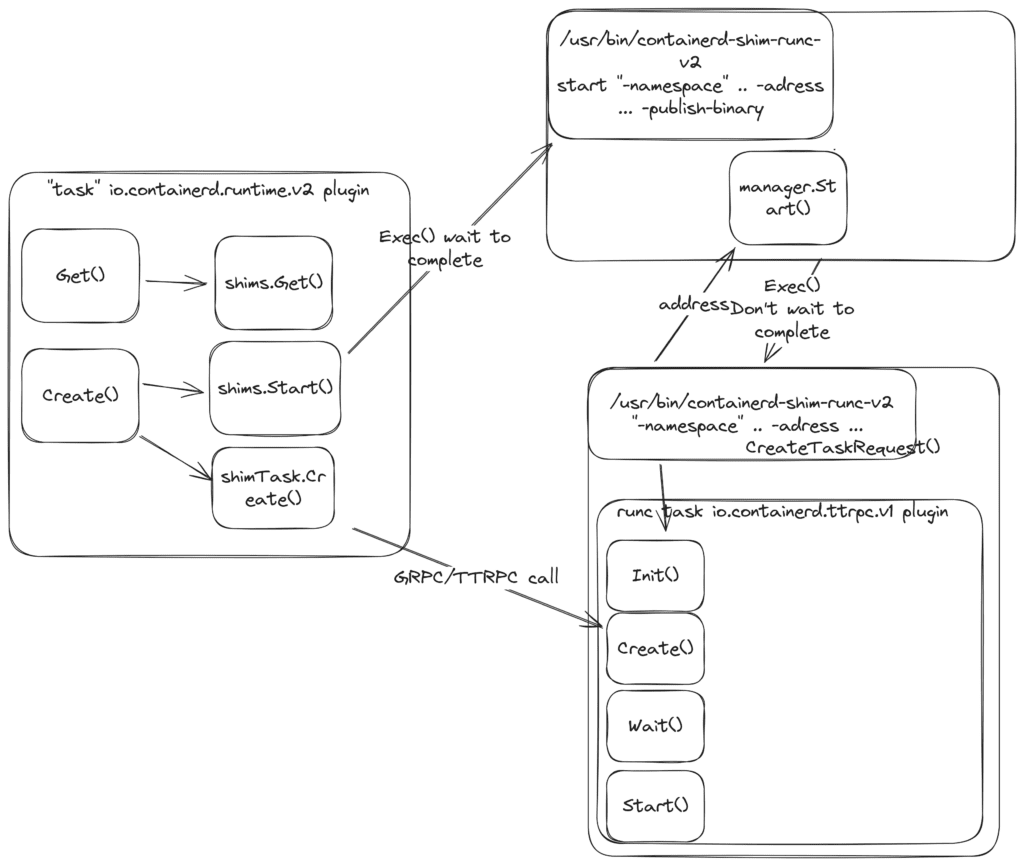
The “task” io.containerd.runtime.v2 plugin
The “task” io.containerd.runtime.v2 plugin in Containerd serves the purpose of launching and managing containerd-shim-runc-v2 processes and containerized processes in them. A shim serves as a bridge between the Containerd and runc. Shims listen on the ttrpc interface and perform actions on containers, such as creating containers and starting or stopping them.
Additionally, it uses an exchange plugin to send events and metadata plugins to get information about the containers.
The “tasks” io.containerd.grpc.v1 plugin
The “tasks” io.containerd.grpc.v1 plugin handles the management of tasks in Containerd. It creates, starts, stops, and deletes container tasks. The plugin retrieves container data using the metadata plugin, calls out to io.containerd.runtime.* plugins to create shims and actual containerized processes, and uses the monitor plugin to collect container metrics. There is also the “tasks-service” io.containerd.tasks.v1 plugin that provides a gRPC service interface plugin for this plugin.
You can interact with the plugin directly with the ctr task command. The following command uses the tasks plugin to start a container:
ctr task start container1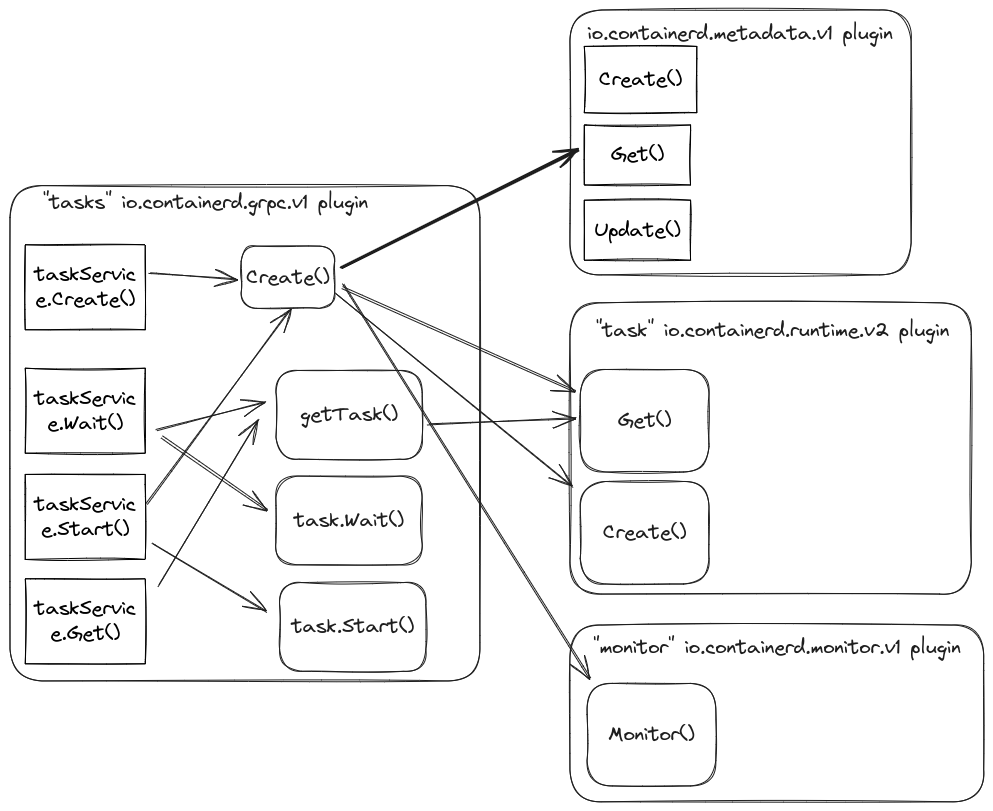
The “monitor” io.containerd.monitor.v1 plugin
The “cgroups” io.containerd.monitor.v1 plugin is responsible for monitoring OOM kills and resource usage within Containerd. It provides functionality for tracking metrics such as CPU usage, memory consumption, and I/O operations of running containers. It uses Prometheus to expose the metrics about the containers. However, these metrics might be similar to the ones collected by cAdvisor metrics that ship together with Kubernetes. So, you should disable container metric collection. You can do this by applying the following config:
[plugins." io.containerd.monitor.v1.cgroups"]
  no_prometheus = true
Additionally, you can see the data collected by the Monitor plugin using the following command:
ctr tasks metrics container1

ID            TIMESTAMP
container1    seconds:1708086045  nanos:606127797

METRIC                VALUE
pids.current          5
pids.limit            18446744073709551615
cpu.usage_usec        148692
cpu.user_usec         42496
cpu.system_usec       106195
cpu.nr_periods        0
cpu.nr_throttled      0
cpu.throttled_usec    0
memory.usage          4485120
memory.usage_limit    18446744073709551615
memory.swap_usage     0
memory.swap_limit     18446744073709551615
Next, let’s cover the interaction between Kubelet and contained.
Kubelet and Containerd
Kubelet is a Node daemon that manages pods for a node. It registers itself with Kubernetes API to get the list of assigned Pods and interacts with container runtimes through the CRI interface to launch containers on the Node. If you want to learn more about Kubelet, check out my “Monitoring Kubernetes Control Plane with Prometheus” book.
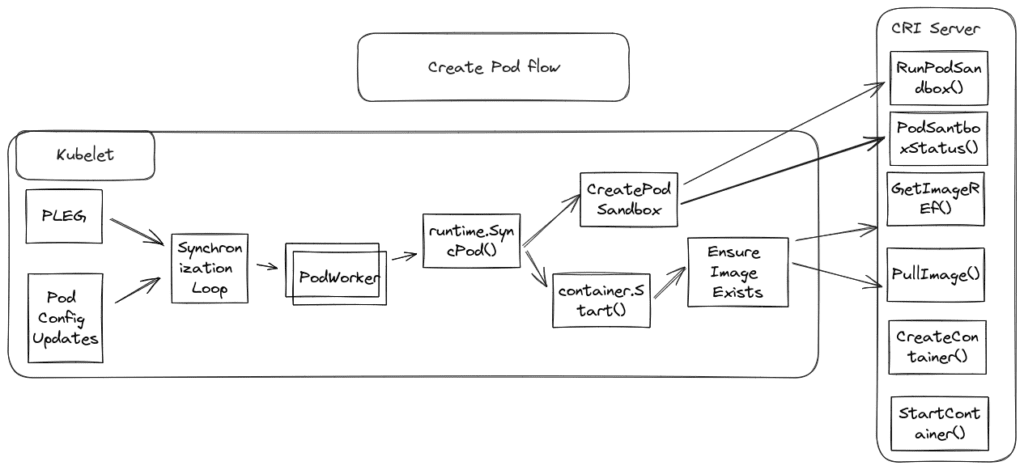
Containerd ships with a gRPC server that implements the CRI Interface and calls the Containerd plugins to perform the required operations. For example, Kubelet calls these endpoints to spin up a new Pod:
- RunPodSandbox() – creates and initializes the isolated environment where the Pod will operate.
- PodSandboxStatus() – checks the state of a running Pod sandbox
- ImageStatus() – retrieves information about the status of an image, such as presence, image size, and creation time.
- PullImage() – pulls a container image.
- CreateContainer() – creates a new container instance within a previously created Pod sandbox.
- StartContainer() – starts the container instance.
The image below illustrates the steps of the RunPodSandbox operation.
How to monitor Containerd
The primary way to monitor Containerd health is by collecting Containerd metrics. Since Containerd implements a gRPC CRI service, which is a request-driven service, you can use Four Golden Signals or the RED method to monitor it. For example, you can watch the following metrics:
- Requests – How many requests Containerd is getting?
- Errors – How many errors per second is Containerd responding?
- Latency – How long does it take to create a new pod sandbox, start a container, or pull an image?
Note that latency might differ for different endpoints; for instance, PullImage highly depends on the image size, while creating a new Pod Sandbox doesn’t.
Getting operational data from the Containerd
Metrics
Containerd exposes metrics in Prometheus format. To expose Prometheus metrics, specify the following config:
[metrics]
  address = "0.0.0.0:9113"
  grpc_histogram = true
For example, you can track key indicators for calls to create a new Pod Sandbox using the following PromQL queries:
Rate of requests:
sum by(grpc_code, instance) (rate(grpc_server_handled_total{job="containerd", grpc_method="RunPodSandbox"}[$__rate_interval]))Errors:
sum by(grpc_code, instance) (rate(grpc_server_handled_total{job="containerd",grpc_code=~"Unknown|ResourceExhausted|Internal|Unavailable|DataLoss|DeadlineExceeded", grpc_method="RunPodSandbox"}[$__rate_interval]))Latency:
histogram_quantile(0.95, sum by(grpc_code, instance, le) (rate(grpc_server_handling_seconds_bucket{job="containerd", grpc_method="RunPodSandbox"}[$__rate_interval])))If you are using Prometheus Operator, you can collect Containerd metrics using the following config:
prometheus:
  prometheusSpec:
    additionalScrapeConfigs:
    - job_name: 'containerd'
      scrape_interval: 30s
      scheme: https
      tls_config:
        ca_file: /var/run/secrets/kubernetes.io/serviceaccount/ca.crt
      bearer_token_file: /var/run/secrets/kubernetes.io/serviceaccount/token
      kubernetes_sd_configs:
      - role: node
      relabel_configs:
      - action: labelmap
        regex: __meta_kubernetes_node_label_(.+)
      - target_label: __address__
        replacement: kubernetes.default.svc:443
      - source_labels: [__meta_kubernetes_node_name]
        regex:prometheus:
  prometheusSpec:
    additionalScrapeConfigs:
    - job_name: 'containerd'
      scrape_interval: 30s
      scheme: https
      tls_config:
        ca_file: /var/run/secrets/kubernetes.io/serviceaccount/ca.crt
      bearer_token_file: /var/run/secrets/kubernetes.io/serviceaccount/token
      kubernetes_sd_configs:
      - role: node
      relabel_configs:
      - action: labelmap
        regex: __meta_kubernetes_node_label_(.+)
      - target_label: __address__
        replacement: kubernetes.default.svc:443
      - source_labels: [__meta_kubernetes_node_name]
        regex: (.+)
        target_label: __metrics_path__
        replacement: /api/v1/nodes/${1}:9113/proxy/v1/metrics
      - source_labels: [__meta_kubernetes_node_name]
        action: replace
        target_label: kubernetes_node
 (.+)
        target_label: __metrics_path__
        replacement: /api/v1/nodes/${1}:9113/proxy/v1/metrics
      - source_labels: [__meta_kubernetes_node_name]
        action: replace
        target_label: kubernetes_node
Logs
By default, Containerd logs “info” level messages to standard output. You can change the format or level using [debug] config:
[debug]
  address = ""
  format = ""
  gid = 0
  level = ""
  uid =
Here are the possible values for log levels:
- trace
- debug
- info
- warn
- error
- fatal
- panic
Profiles
To collect Go language profiles, you must configure [debug] the config and set the address to some port. For example:
[debug]
  address = "0.0.0.0:9999"
Then, you can get the standard Go language profiles on /debug/pprof/ the endpoint and expvar endpoint, which shows command line arguments and memory stats on /debug/vars endpoint. The following example shows how to collect a Go language trace profile:
curl -o trace.out http://localhost:9999/debug/pprof/trace?seconds=5Then you can view the profile using the following command:
go tool trace trace.out
Traces
Additionally, Containerd can produce OpenTelemetry tracing data. It sends spans using the OpenTelemetry HTTP protocol. The following tracing configuration makes the containerd collect tracing data and produce the spans into localhost:4318.
[plugins."io.containerd.tracing.processor.v1.otlp"]
    endpoint = "http://localhost:4318"
    service_name = "containerd"
    # sampling_ratio = 1.0
You can learn more about this in the Containerd tracing documentation.
Events
As mentioned, you can collect Containerd events using ctr events the command line tool. Alternatively, you can write software that calls the event plugin’s gRPC interface.
Miscellaneous
Containerd has a special signal handler to dump the Containerd stack. To collect the stack dump, send a USR1 signal to Containerd. Containerd will print the stacks and write to the file. For example:
kill -USR1 525

containerd[525]: time="2024-02-11T08:16:05.706347688Z" level=info msg="goroutine stack dump written to /tmp/containerd.525.stacks.log"
Alternatively, you can send kill -ABRT, killing the Containerd daemon and printing the stack dump into the standard output.
References
- https://kubernetes.io/docs/concepts/architecture/cri/
- https://www.youtube.com/watch?v=3_jUWW2j_TI
- https://www.youtube.com/watch?v=36pKBgOFbyk
- https://github.com/containerd/containerd/blob/main/docs/PLUGINS.md
- https://github.com/containerd/containerd/blob/main/docs/tracing.md
- https://github.com/opencontainers/runc
- https://sre.google/sre-book/monitoring-distributed-systems/
- https://thenewstack.io/monitoring-microservices-red-method/