Migrating a Low-Code IoT Platform Storing 20M Records/Day

This is an installment of our “Community Member Spotlight” series, where we invite our customers to share their work, shining a light on their success and inspiring others with new ways to use technology to solve problems.
In this edition, Lukas Klein, co-founder and CTO of low-code IoT platform Datacake, explains how they’re storing 20 million measurements per day (and growing!) on a Timescale cloud database and shares the process of migrating from TimescaleDB to Timescale.
Simon Kemper and I founded Datacake in 2016, although we pivoted in 2020 to make the company what it is today. We’re a low-code IoT platform to which customers can connect all kinds of different devices. We don’t manufacture the devices; we provide an open platform offering software as a service (SaaS).
In this platform, customers can normalize the data stored in a time-series database (Timescale) and then fetch the data to do analysis, reporting, and monitoring. We’re a self-service platform, which brings some challenges regarding handling the data. We’ve been through a small seed round and are seeing great growth.
Datacake is a small team of 10 people, three of whom work in Engineering. Simon focuses on management, and we have two customer success managers. We hired someone to handle the content marketing this year. We’re a distributed team working remotely, with most employees coming from Germany, but also Mexico, Colombia, and Italy.
The IoT Data Challenge
The challenge with IoT is that there are so many different protocols for the various devices, and we have to get them all into a unified system somehow. So what we’re trying to do is have microservices for specific IT protocols that transform them into HTTP or, with newer systems, push them into a Kafka queue from where they get fetched and processed. We have a system with so-called payload decoders, which are code snippets that people can write in JavaScript.
Typically, these take the data from the sensors (it’s only a few bytes to save on bandwidth) and transform it into actual measurements that systems and humans can understand. From there, these measurements are stored in the time-series database.
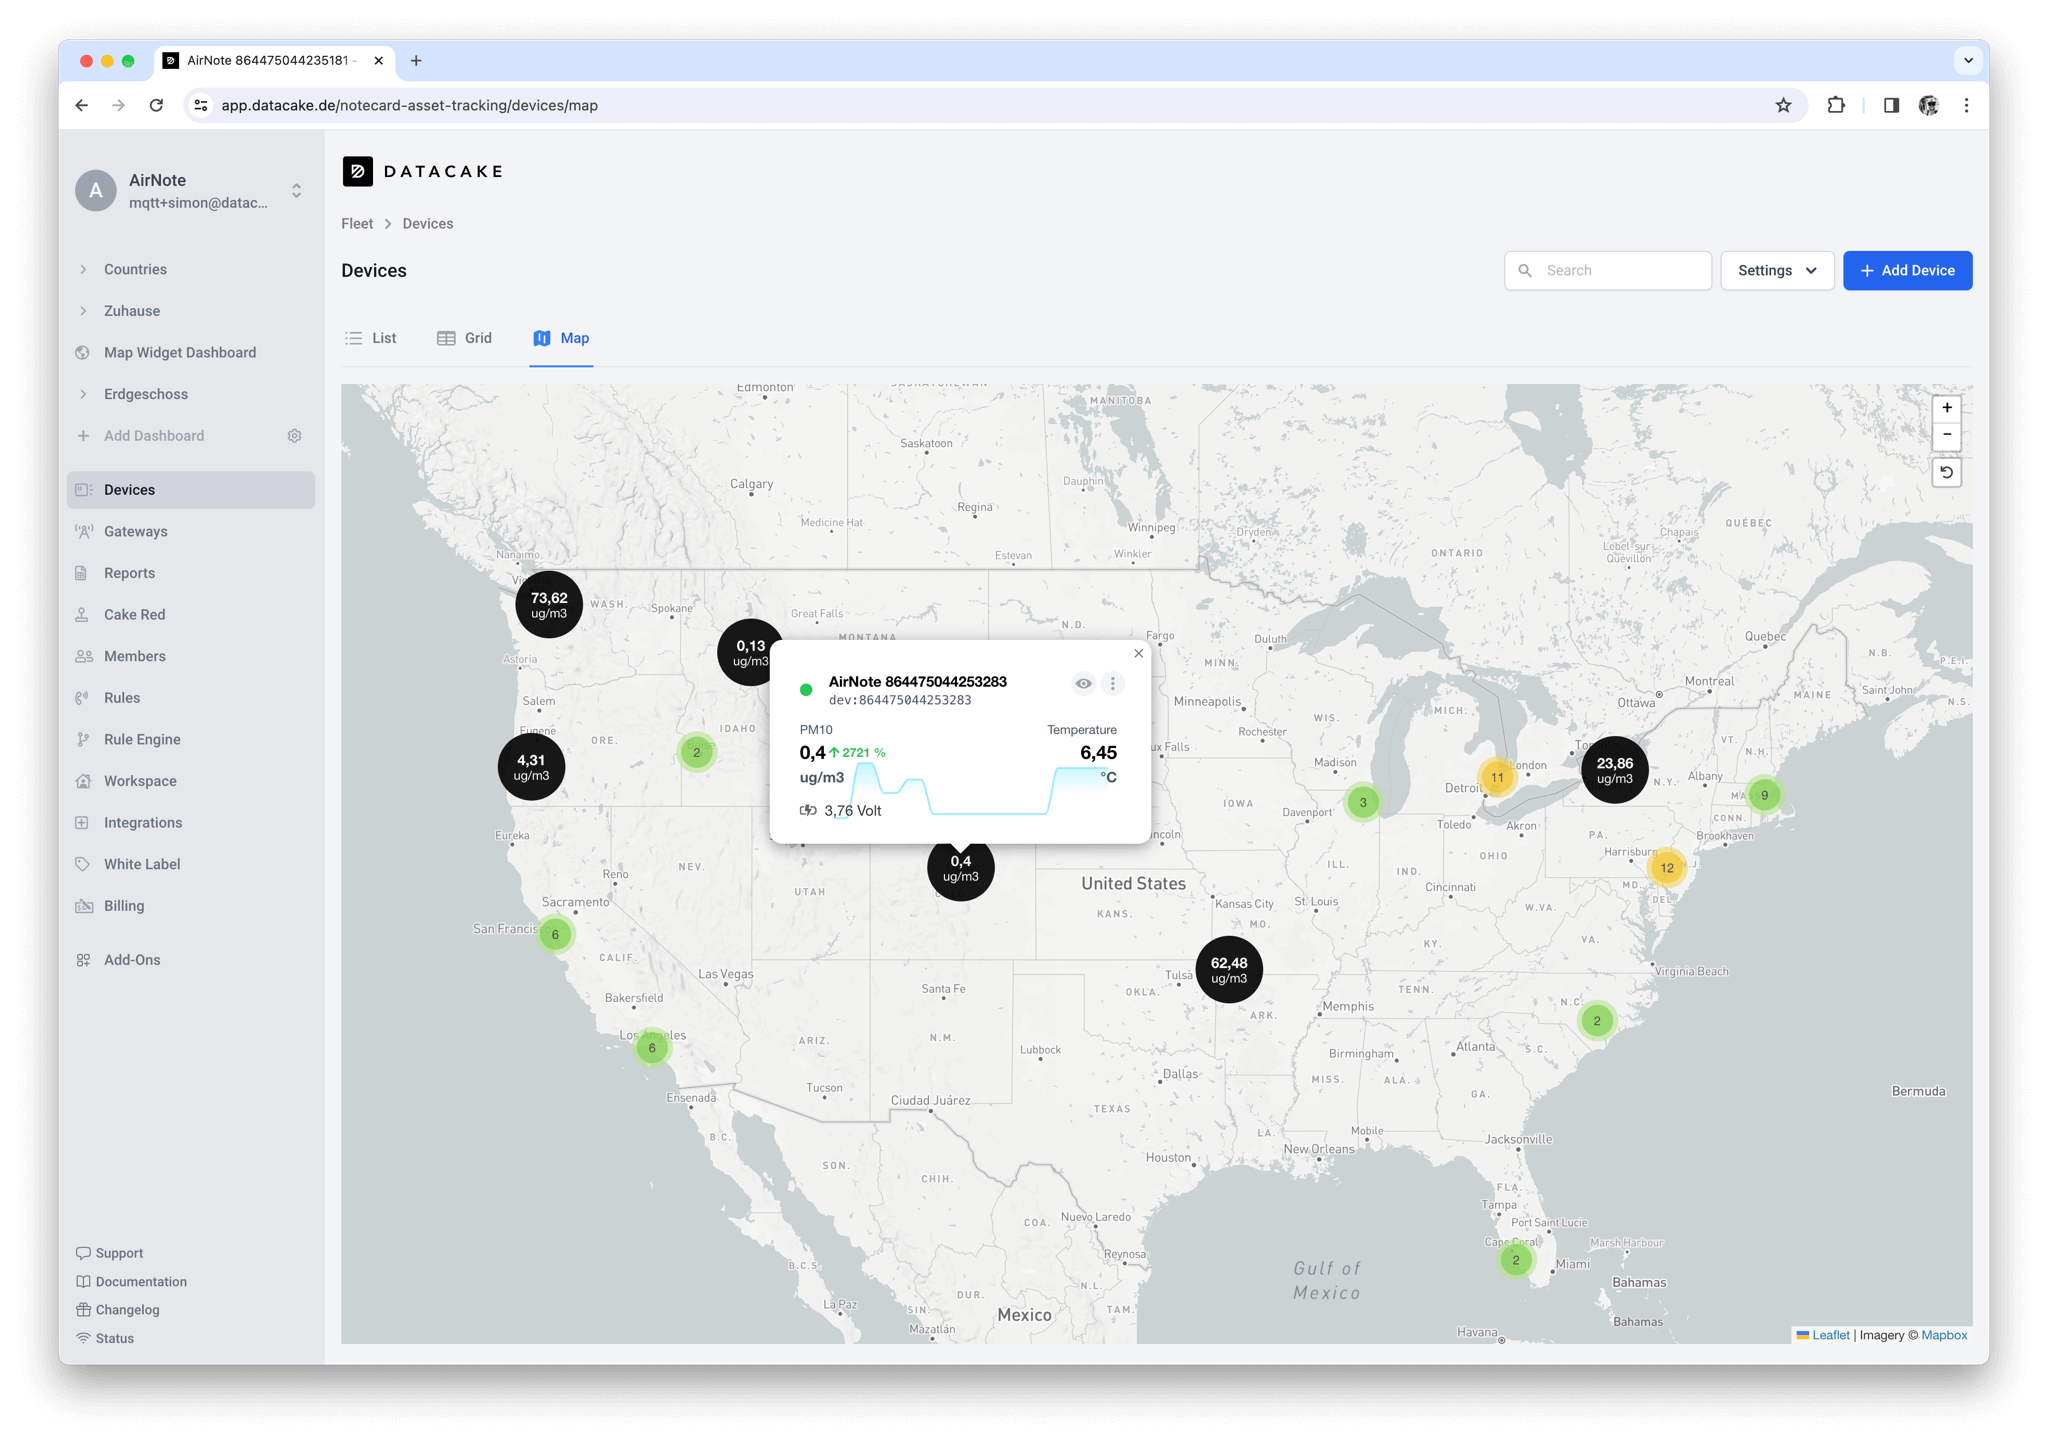
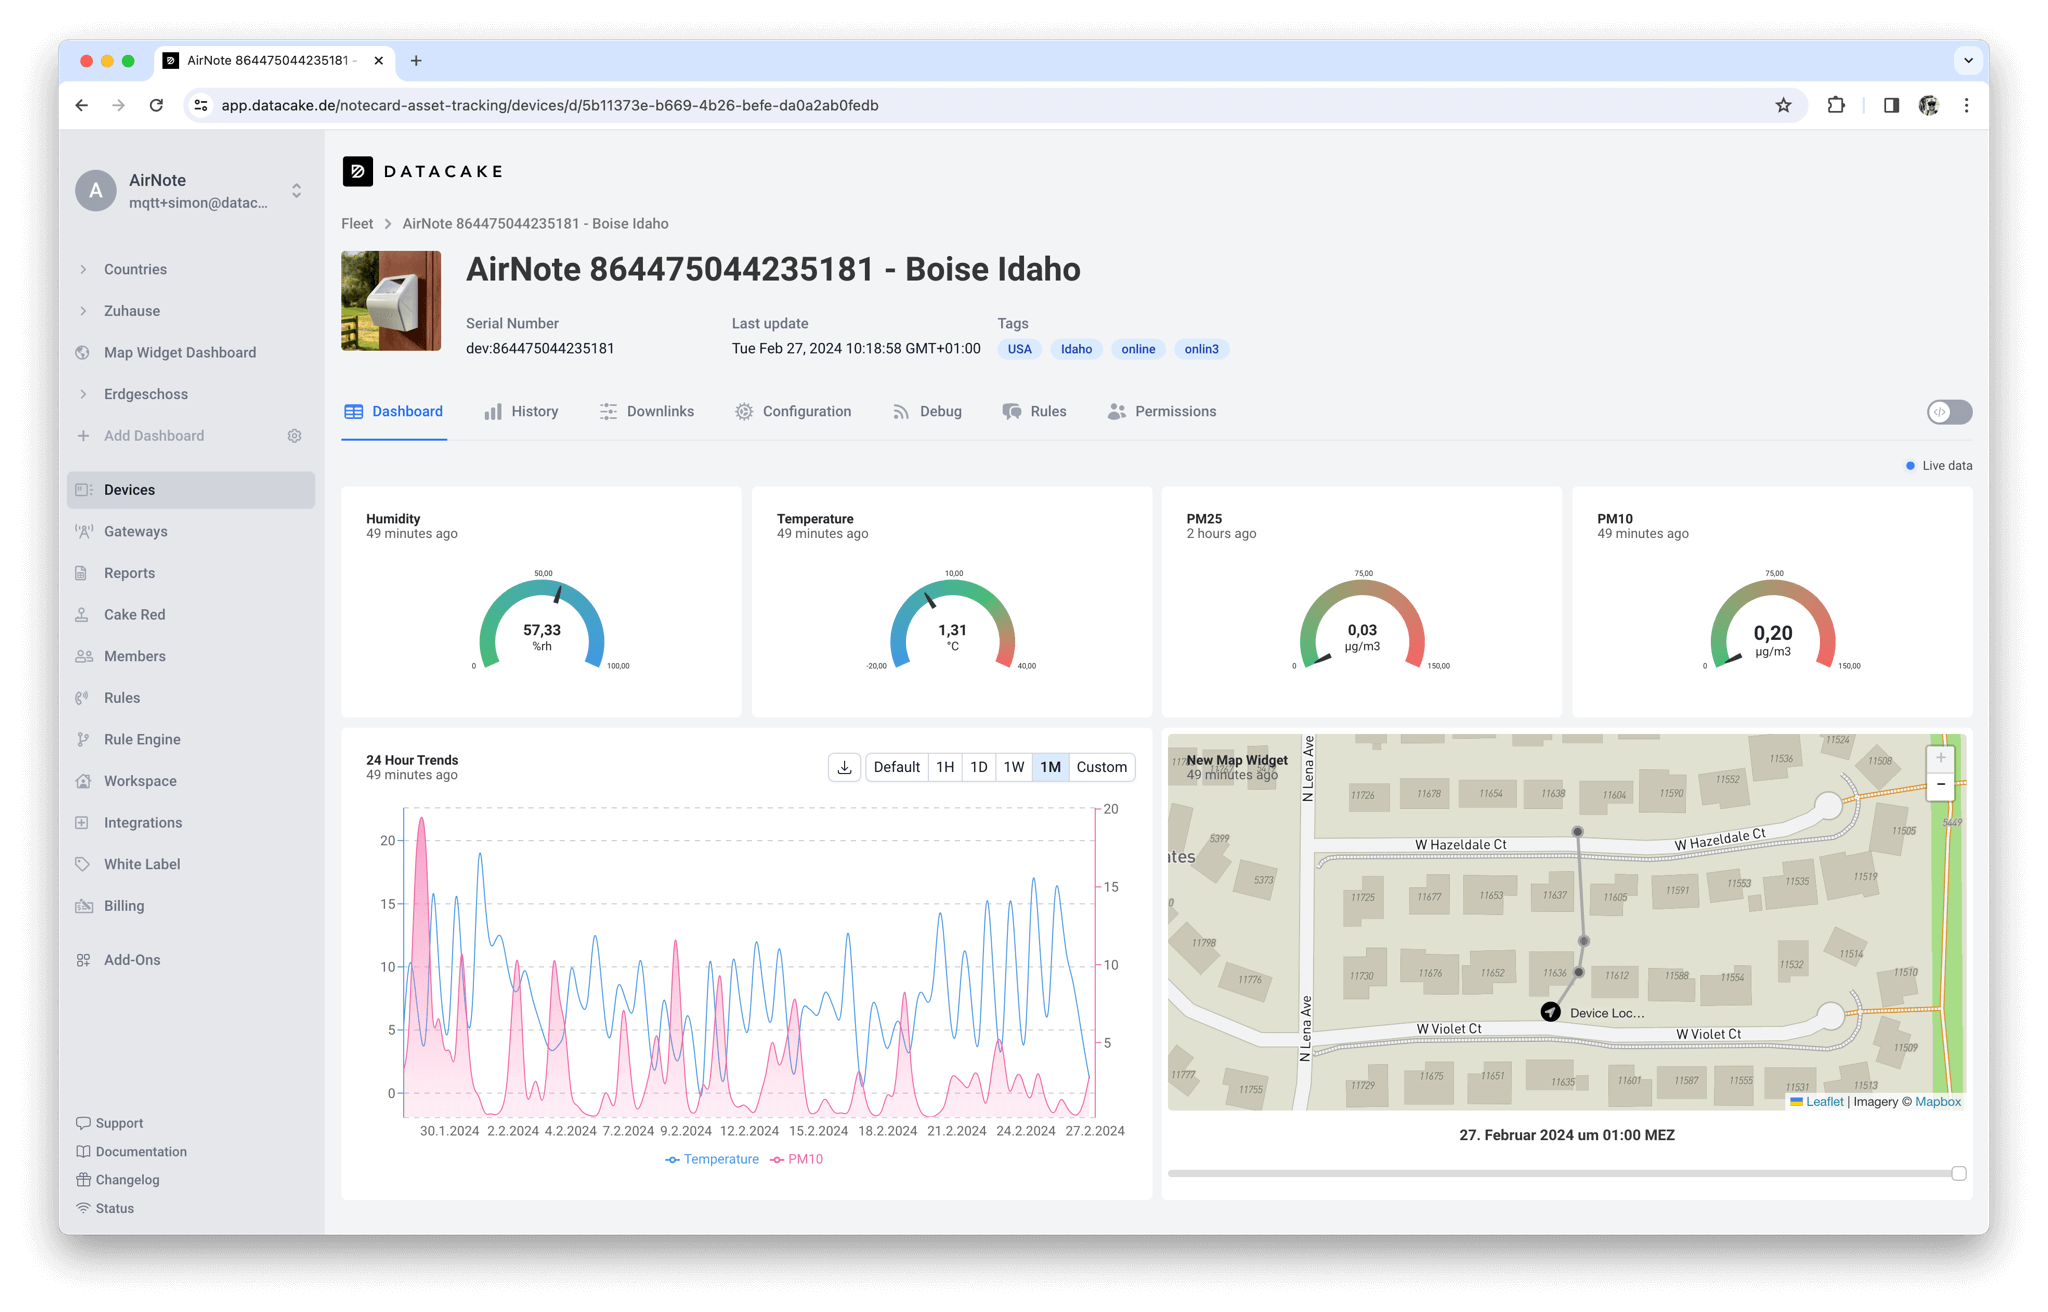
The challenge with our product regarding data storage is that we allow high levels of flexibility for our customers. For example, they can choose how to retrieve the data to create custom dashboards without writing code. For that, we have a dashboard builder with a what-you-see-is-what-you-get (WYSIWYG) editor where you can add widgets and query the data. We don’t limit these dashboards to specific timeframes to make them highly customizable, and we somehow have to make them performant.
The Data Pipeline
Our data pipeline begins with getting the data from the physical sensor into the Internet. With IoT, there are many ways to connect, but the majority of devices on Datacake are using something called LoRaWAN or Long Range Wide Area Network, which allows small battery powered sensors to transmit data over a long range with very little power.
Then, you have a piece of hardware called a gateway, which works like a Wi-Fi router but picks up on the LoRaWAN signals. These gateways are connected to the Internet and to a LoRaWAN network server. We recently published a Datacake LoRaWAN network server, so you can just point your gateway directly at Datacake.
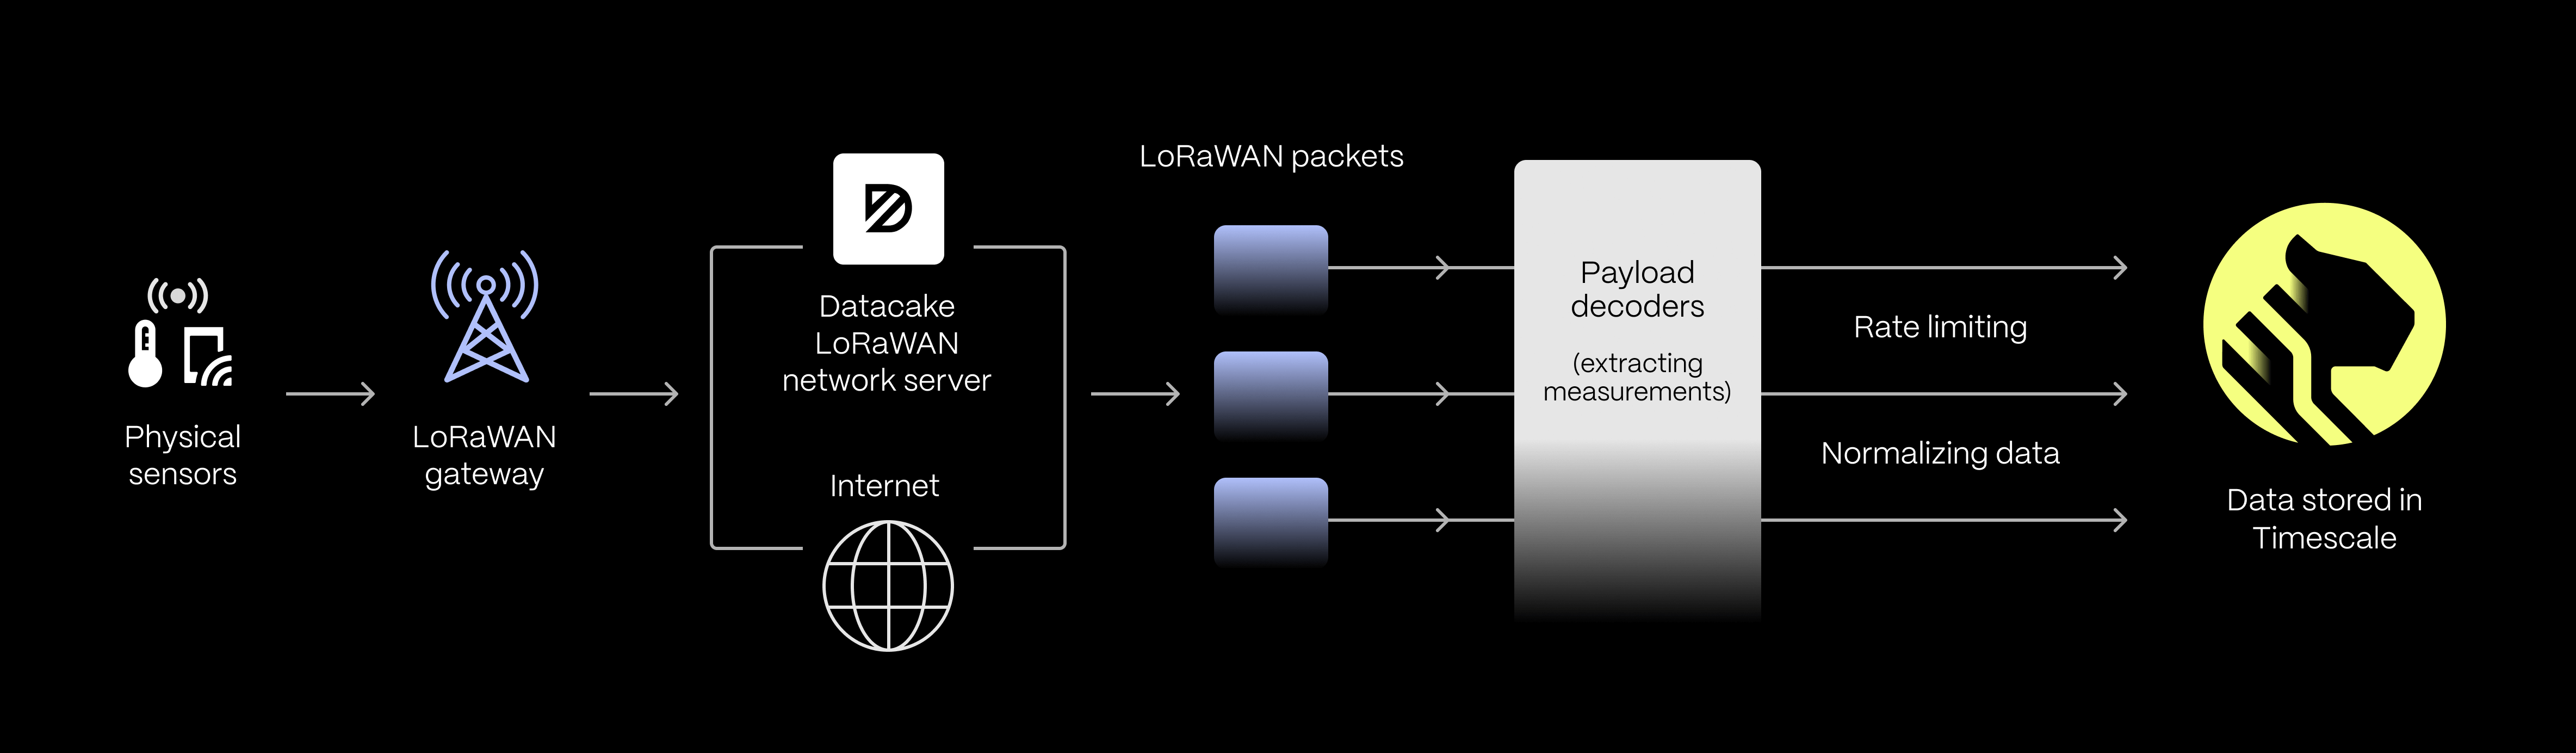
We receive those LoRaWAN packets and decode them through the payload decoders to extract the measurements. On the client side, we have a huge library of so-called device “templates,” so customers can sign up for Datacake and click “Add a device” to choose the hardware they want to onboard. Then, we show them how to configure their gateway, which is basically setting a server address, and it’s done.
Timescale comes immediately after the payload decoders. Once we have normalized the data and done some rate limiting, we store it in Timescale. We have a logic in our application to rate limit, meaning that it will only store, for example, temperature values if they change, as it does not make sense to store the same temperature multiple times.
“We store around 20 million measurements per day for about 20,000 users. And it’s constantly growing. We're witnessing a huge growth in enterprise customers, who onboard multiple devices at a time.”
From there, we will fetch data again for the dashboards. Right now, we are trying to optimize them using continuous aggregates. But, up until now, we had our caching layers on top because these dashboards are very customizable, and it’s very hard to set a default for all our customers’ needs using continuous aggregates. So this is one of the challenges we’re trying to solve with the help of your Support Team.
We store around 20 million measurements per day for about 20,000 users. And it’s constantly growing. We're witnessing a huge growth in enterprise customers who onboard multiple devices at a time.
From Influx to Timescale
In the early days of Datacake, we started with Influx, but it wasn’t the perfect choice for us. I can’t remember exactly when we started using TimescaleDB, but we began running it as a self-managed solution about five years ago before migrating to the cloud service this year.
“Timescale’s Postgres-nativity means we can apply our already-existing knowledge to time series as well.”
I remember that Influx’s high-availability options back then were quite limited, so we DIYed a system using HAProxy to split reads, and a custom Python server that distributed writes across multiple nodes. This worked but did not really scale nor feel robust enough.
Another reason was that (with the 1.x version back then), the InfluxQL query language meant we would have to learn and maintain another syntax, while Timescale’s Postgres-nativity means we can apply our already-existing knowledge to time series as well. Their “new” Flux language looks very powerful, but I’d rather stick with a Postgres superset.
I can’t remember exactly how I heard about Timescale. It might have been a blog post or Twitter because I’m super active there and have probably read about it somewhere. We were looking for alternatives and are big fans of Postgres, so having Timescale, which is built on top of Postgres, was an obvious choice for us.
Choosing Timescale Over Self-Managed TimescaleDB
Our decision to move to the managed solution was a no-brainer. As I mentioned, we’re a pretty small team, and we don’t have DevOps to run servers 24/7, so we’re always trying to use as many managed platform solutions as possible. Also, we began having scaling issues with our self-managed Patroni cluster. And this is the kind of thing you don’t want to have to focus on when you’re building an amazing product. So, we gave the cloud platform a try.
“[Choosing Timescale brings value] if you take into account the salary of somebody who knows what they’re doing and then not just having one person, but several to cover for you around the clock and on weekends. So while it’s more expensive [than self-hosting], it really isn’t that expensive if you take into account the cost behind all this.”
While the cloud is more expensive than paying for the servers of a self-managed solution, we were aware we don’t have a team spread across the globe and time zones. It’s a pretty easy calculation of value to make if you take into account the salary of somebody who knows what they’re doing and then not just having one person, but several to cover for you around the clock and on weekends. So, while it’s more expensive [than self-hosting], it really isn’t that expensive if you take into account the cost behind all this.
However, we still keep a PostgreSQL database for relational data. This is more static data: we have some audit logs and other stuff in there, but nothing that would scale if the devices sent more data. Our main application is a Python/Django one. We use the Django ORM (object-relational mapping) for basically everything, from user accounts to device meter data to those device templates. That's not time series, and it’s around 90 GB of data. For this, we use the Django ORM and store it in a regular PostgreSQL database with Digital Ocean.
Then, for our time-series data, we have some custom connectors from our Python application that communicate directly with our Timescale cloud instance without ORM. Our Timescale cloud service is not running in the exact same data center as our Digital Ocean one, but both are in the Frankfurt region. Our initial concerns were that latency and traffic may be an issue, but they are totally not, and the performance is way better than with our previous TimescaleDB self-managed solution.
Regarding the database schema, I would say we have a medium schema. This is one decision made many years back when we started using Timescale, and we haven’t touched it since then. But we’ve grown a lot since. So now, post-migration, we’re still having a weekly meeting with the Timescale Support Team. We’re in the process of analyzing and optimizing everything.
For example, we have different hypertables defined by different data retention and compression policies. Now, we are looking into segregating them more into different tenants and optimizing chunk size. None of this concerns us, even though it’s an ongoing process, because everything is working well, and the queries are amazingly fast.
The Migration Process
Migrating to the Timescale cloud was super smooth, and there was no downtime before, during, or after the migration process. Most importantly, our users weren’t negatively impacted and now benefit from faster response rates. We planned all the necessary steps in one-on-one calls with your Support team, and I always felt I was up-to-date on what was happening and why. We were also informed about different migration strategies, and I felt I made an informed decision. The help we received was outstanding—Support offered more help than we actually needed!
As for the migration itself from self-managed TimescaleDB to cloud, the initial contact happened in late October 2023. There were several Zoom calls where I explained our current setup and what we were trying to achieve. Quite quickly, we dug into the technical aspects, like how much data we have, the compression ratio, and how the migration would look.
We had 400 GB of data (~97 GB compressed) to migrate, and one of the challenges was that our self-managed Patroni cluster was running quite an old version of Timescale and PostgreSQL, which was not directly supported by your cloud platform anymore. This happened because we were self-managing, and things kept running, but it’s also one of the great things that come with Timescale: you take care of all the upgrades, and nothing breaks.
In sum, these were our migration requirements: we had to upgrade our source TimescaleDB version (2.4.2) to a cloud-supported version (2.11.2). After the migration, we upgraded the cloud instance to the most recent version and enabled automatic updates.
Following the upgrade, we agreed on a migration strategy. We opted for a dual-write and backfill approach to give us more control over the source and target during migration, especially because we weren’t performing any update or deletion operations in the database.
To be honest, the only reason why the migration ended in early February 2024 was because there were issues in our dual writes system, and we lost some data. So, we had to redo the migration twice (the backfilling part). Still, the amazing thing was that the actual backfilling was so easy that we did it twice (one with some troubleshooting and the second successfully) without trouble.
The problems during the first backfill emerged from invalid data canceling the inserts. As I mentioned, we have two applications: one is pretty monolithic, but there’s a lot of logic behind it, with the rate-limiting and stuff. This is where the issue occurred. So, we lost some data in this batch insertion and had to take a couple of rounds of logging and debugging to see what was happening. Once the dual writes worked, we had to backfill the data and see how Timescale would perform for the reads.
Since we are in full control of our application, we configured it to point a certain percentage of reads to both systems—we had a 50-50 split running for some time to see how the metrics would perform on the cloud. Fortunately, nothing happened (apart from query performance gains on the cloud side), and we could even pull back the data we lost in a matter of minutes. This process felt pretty secure since we had full control over our application.
“We actually lost data on the source database [a brief outage caused by a Patroni failover gone wrong, unrelated to the migration] that we were able to recover from Timescale cloud because the dual writes were already in place. This was very fortunate and, once again, gave us the confidence that Timescale cloud is the more stable, better solution.”
The actual backfilling of 97 GB of compressed data only took 45 minutes. I was so impressed because I expected it to take way longer and to have a bigger performance impact on our source database. I thought we would have to scale down the concurrency, but this was working just fine with the default values, and the same happened for the validation of the backfill data. It was a smooth process: we switched off the compression jobs and restarted them after the migration, as stated in the migration guide. It worked well and caused no issues at all.
What's great about the Timescale backfilling tool is that you can cancel and resume at any given point. So, for different reasons, we have tested this, and it worked as advertised. During this period of dual writes, we also had an issue with our source self-managed database, a brief outage of our source database caused by a Patroni failover gone wrong, unrelated to the migration. We actually lost data on the source database that we were able to recover from Timescale cloud because the dual writes were already in place. This was very fortunate and, once again, gave us the confidence that Timescale cloud is the more stable, better solution.
The entire process was super amazing. We’ve been in this P2P program*, which is pretty new. The Support is outstanding, not just for the migration but also for everything that comes after the migration regarding optimizations.
About Running Timescale
Timescale is an amazing piece of software with lots of information available, which made it possible to run it ourselves initially. There is great documentation and marketing materials from Timescale and the community. Great YouTube videos as well, explaining concepts like continuous aggregates and how they work under the hood.
I also used it personally for my home automation setup. Obviously, I don’t need the cloud version for this; it’s okay to run it in a Docker container. But it’s so versatile that you can use it for both small personal projects and enterprise environments. It feels like the right choice of technology, also because it’s built on top of Postgres, which is super robust, and uses its great features.
Compression
One of the most amazing Timescale features (both in self-managed and cloud) is compression. We have not implemented the low-cost storage tier as part of tiered storage, but that is very high on our list. Our compression ratio is around 87 %, but there’s still room for improvement, according to the Support Team.
Insights
Another amazing feature of your cloud service compared to running it yourself is the Insights section [in the Timescale UI], which gives you insights into what queries are impacting performance. This is a super valuable tool for us because we are currently monitoring at the application level, trying to measure some things there. However, seeing it on the database level, with the actual number of executions and total rows scanned, is super valuable for optimizing our queries. Since we have a super customizable application where customers can misconfigure some things, this tool is crucial to spot those changes and optimize where needed.
Continuous aggregates
Another feature we’re currently implementing for some business cases is continuous aggregates. Right now, we have built our sort of continuous aggregates ourselves. To give you a concrete example: If you have a device dashboard where you want to show a line shot of historical data, then we split this data into chunks. We cache those chunks in our Redis cache and only fetch the data of the missing chunks. So we are really looking forward to having the Timescale solution, which will greatly reduce our application's complexity.
High-availability replicas
Finally, we’re also making the most of high-availability replicas. This is crucial because our devices are continuously ingesting data, and we can’t afford any downtime, or we’d face data loss.
We’d like to thank Lukas Klein and the folks at Datacake for sharing their story on providing a low-code IoT platform to thousands of users and how they migrated from self-managed TimescaleDB to fully managed Timescale. We look forward to further optimizing their use case!
We’re always keen to feature new community projects and stories on our blog. If you have a project you’d like to share, reach out on Slack (@Ana Tavares), and we’ll go from there.


