
An interesting question came in on PollGab. DBAmusing asked:
If a query takes 5-7s to calculate the execution plan (then executes <500ms) if multiple SPIDS all submit that query (different param values) when there’s no plan at start, does each SPID calc the execution plan, one after the other after waiting for the prior SPID to finish?
Well, it’s easy enough to demonstrate! Let’s take a query from my Fundamentals of Query Tuning class that takes tens of seconds (or longer) to generate a plan on most versions and compat levels:
|
1 2 3 4 5 6 7 8 9 10 11 12 |
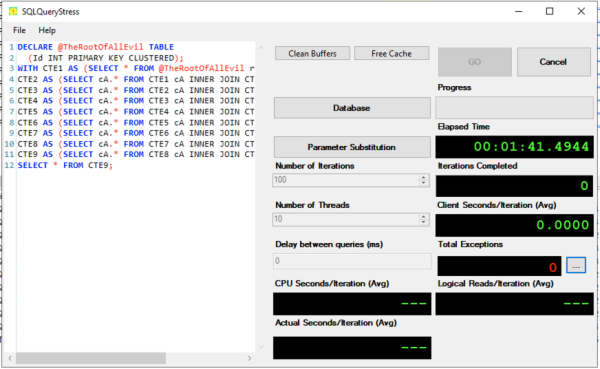
DECLARE @TheRootOfAllEvil TABLE (Id INT PRIMARY KEY CLUSTERED); WITH CTE1 AS (SELECT * FROM @TheRootOfAllEvil r1), CTE2 AS (SELECT cA.* FROM CTE1 cA INNER JOIN CTE1 cB ON cA.Id = cB.Id), CTE3 AS (SELECT cA.* FROM CTE2 cA INNER JOIN CTE2 cB ON cA.Id = cB.Id), CTE4 AS (SELECT cA.* FROM CTE3 cA INNER JOIN CTE3 cB ON cA.Id = cB.Id), CTE5 AS (SELECT cA.* FROM CTE4 cA INNER JOIN CTE4 cB ON cA.Id = cB.Id), CTE6 AS (SELECT cA.* FROM CTE5 cA INNER JOIN CTE5 cB ON cA.Id = cB.Id), CTE7 AS (SELECT cA.* FROM CTE6 cA INNER JOIN CTE6 cB ON cA.Id = cB.Id), CTE8 AS (SELECT cA.* FROM CTE7 cA INNER JOIN CTE7 cB ON cA.Id = cB.Id), CTE9 AS (SELECT cA.* FROM CTE8 cA INNER JOIN CTE8 cB ON cA.Id = cB.Id) SELECT * FROM CTE9; |
And then let’s run it simultaneously across 10 threads with SQLQueryStress:
And run sp_BlitzWho to see what’s happening:

We see that most of the sessions are piled up waiting on RESOURCE_SEMAPHORE_QUERY_COMPILE. That means queries are waiting on memory in order to build execution plans. It’s not that the SQL Server is out of memory altogether – it’s just that it has gateways to prevent too many queries from compiling at once.
Most DBAs can go their entire career without seeing that bottleneck, but given my weirdo job – I’m like an emergency room trauma surgeon for SQL Servers – I see it at least a couple times a year when:
- A SQL Server is under serious memory pressure (typically due to queries getting oversized memory grants), and
- There are seriously complex queries in the workload (typically reporting queries), and
- Those queries aren’t parameterized (because if they were properly parameterized, they’d stick around in the plan cache, avoiding the compilation problem)
In that situation, my first line of defense is to improve plan caching like we discuss in this module of my Mastering Server Tuning class. The last line of defense would be trace flag 6498, which allows more large queries to compile simultaneously. I’ve never needed that in my life, and I hope you don’t either!

5 Comments. Leave new
Hi Brent,
It looks like that trace flag has no effect from SQL Server 2014 (12.x) Service Pack 2 and SQL Server 2016 (13.x) onward (https://learn.microsoft.com/en-us/sql/t-sql/database-console-commands/dbcc-traceon-trace-flags-transact-sql?view=sql-server-ver16). I do not have full faith in the MS documentation — Do you still find the usage of that trace flag to help?
Check the last sentence of the blog post. 😉
Whoops!!!
Hello!
I assume that with them piling up that by the time the next one executes it would see the plan the first one made and follow along with that then? The answer to the question isn’t explicitly stated so was curious if the final result lines up with that assumption.
Well, part of the reason I use open source databases and share all my scripts here is so that if you’ve got additional experiments or questions, you can pick it up and run with it to see things for yourself, without waiting on me (or asking me to do more work for ya, heh.) By all means, give it a shot to find out!