
Visual Studio 2022 17.9 Now Available
Welcome to Visual Studio 2022 17.9! This release comes with more capabilities and improvements that enhance productivity for you and your team, such as AI-assistance and better extensibility. Plus, we’re always improving core productivity and performance! We’ve included suggestions from you in the community and are publishing more about our backlogs in our release notes and roadmap.
From AI-powered Git commit messages and enhanced C++ game development tools to .NET/C# advancements and responsive project management capabilities, this release caters to a wide array of you and your team’s development needs.
Dive into a more efficient development experience with Visual Studio 2022 17.9 and unlock your potential to create, collaborate, and innovate more effectively.
Here are some of the major areas we’ve focused on in this release:
| Area | Enhancements | Developer Community Link |
| Productivity | AI-generated Git commit messages | Discussion |
| Open a Pull Request from Visual Studio or the browser | ||
| Event Handler Leak insights | ||
| Instrumentation “Start with Collection Pause” | Discussion | |
| Switch between single and multiple rows in the document well | Discussion | |
| Non-modal Debug Visualizers | ||
| Responsive Git Ref labels | Discussion | |
| Multi-project configuration | ||
| Multi-folder open support | Learn More | |
| Auto-surround selections with quotes or brackets | Discussion | |
| C++ Game Dev | Streamlined UE Blueprint references | Discussion |
| Improved IntelliSense for Unreal Engine | ||
| Remote Linux unit testing | ||
| Specify custom CMake executable | ||
| Memory Layout for classes, structs, and unions | Discussion | |
| #include reference diagnostics | ||
| .NET/C# | Automatic Deoptimization | |
| Blazor CRUD scaffolding | ||
| Razor snippets | ||
| Multi-tfm support for Razor files | ||
| Live Property Explorer support for .NET MAUI | Discussion | |
| Ecosystem | Ability to load extensions using .vsconfig files | Discussion |
| Discover subscriber benefits | Learn More |
Productivity
AI Generated Git commit messages
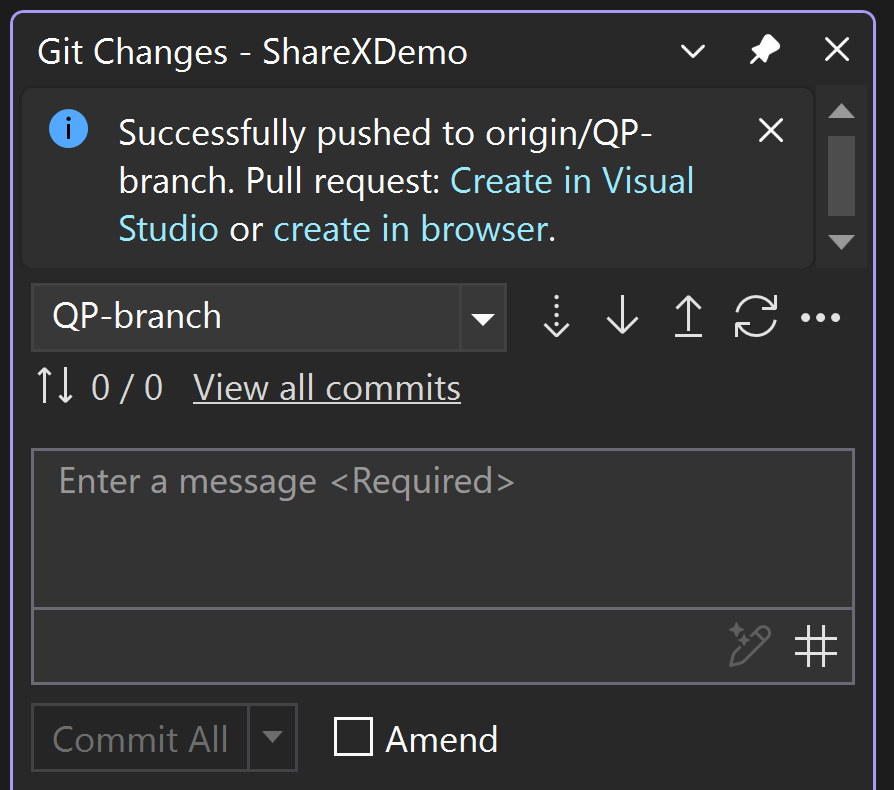
One of the things I always struggle with is coming up with descriptive Git commit messages for whatever changes I’ve made in my local repo. The new generated commit message feature is designed to assist you in succinctly describing your changes, ensuring clarity and relevance in your commits.
To get started, ensure you have an active GitHub Copilot subscription along with the GitHub Copilot Chat Extension installed. Simply click the ‘Add AI Generated Commit Message’ sparkle pen icon within the Git Changes window for a suggested commit message. GitHub Copilot analyzes your commit’s file changes, provides a summary, and then offers a descriptive message for each change. Choose to ‘Insert AI Suggestion’ or ‘Discard’ based on your preference. We welcome your feedback on this feature at this link.
Open a Pull Request in Visual Studio or the browser
To support GitHub and Azure DevOps users who prefer to use the browser view for creating pull requests, we’ve added a secondary link to help maintain your workflow.
Event Handler Leaks insights
Finding memory leaks is one of the more challenging parts of developing your app. Now, the Managed Memory Insights tab can detect “Event Handler Leaks,” which can happen when one object subscribes to another object’s events. If the event publisher lives longer than the event subscriber, the subscriber remains in memory, even when there are no other references to it. This can cause memory leaks and the application will use more memory over time without releasing unused memory properly.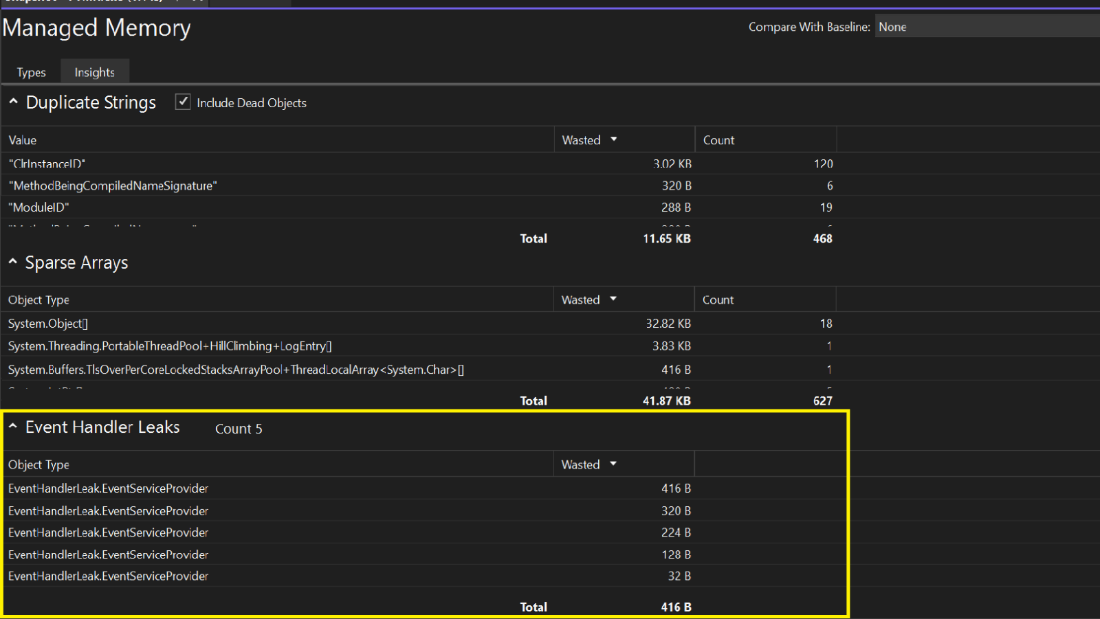
Instrumentation tool “Start with collection pause” option
The Instrumentation tool now has a “start-pause” option for profiling applications. This lets you start the app under the profiler’s control without immediately collecting data. You can resume data collection later when needed by hitting the record button. This is useful, especially in gaming, where you can get into the game before data collection starts. The feature is compatible with both native and managed projects.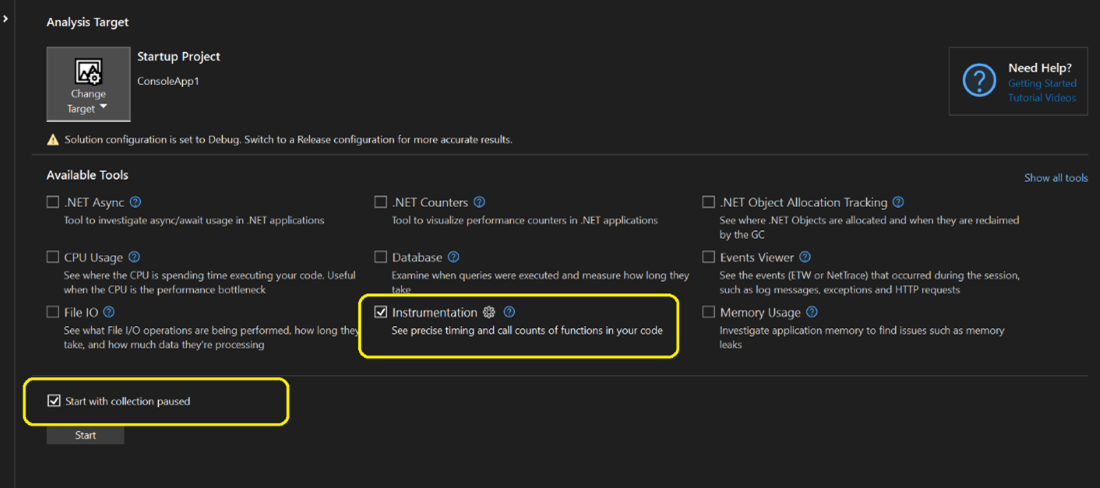
Switch between single and multiple rows in the document well
You can now quickly switch between single and multiple tab rows in Visual Studio’s document well by scrolling the mouse wheel up or down. The first time you open more tabs in Visual Studio than can fit in a single row in the document well, you’ll see a tip letting you know of this new feature.
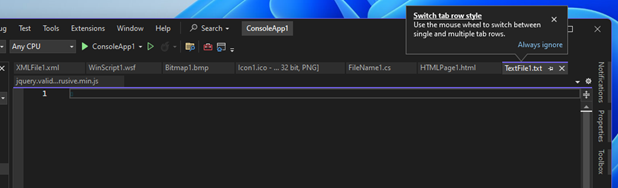
Scrolling down on the mouse wheel while hovering over the tabs in the document well will shift your view to show multiple tab rows. Conversely, scrolling up on the mouse wheel will collapse the view down to a single tab row.
Non-modal Debug Visualizers
Debug Visualizers are now non-modal, allowing concurrent interaction with the Editor while the visualizer window is active. It is possible to have multiple types of visualizers open simultaneously, and you have the flexibility to choose whether to float or dock your visualizer window.
Responsive Local History labels in the Git Repository window
Your branch and tag labels now resize responsively to make it easier to see which branches you’re looking at in the Git graph.
Multi-project configuration
Now, you can easily set up and save profiles for launching specific projects within a multi-project solution for streamlined debugging. Simplify working with complex solutions, enhance debugging efficiency, and effortlessly share configurations with your team.
Multi-folder open support
Auto Surround with Quotes or Brackets
You can now easily surround a selection with bracket delimiters including: “double quotes”, ‘single quotes’, and (parentheses).
To enable or disable this feature, go to Tools > Options > Text Editor and check the “Automatically surround selections when typing quotes or brackets” option.
C++ and Game Dev
Streamlined Unreal Engine Blueprints references
Available gradually over the upcoming weeks, you will no longer need the Visual Studio Unreal Engine plugin to see Blueprint References, and Visual Studio will now display CodeLens hints with reduced latency and use fewer machine resources. Additionally, we have added support for including usages of UFUNCTIONs outside of the class hierarchy directly in the CodeLens results. We will cache your results from previous scans and only process new or modified assets since the last scan.
Improved IntelliSense for Unreal Engine projects
Unreal Engine uses its own reflection mechanism to connect the worlds of C++ and Blueprints. This is achieved through custom preprocessing of C++ sources with the Unreal Header Tool (UHT) and injection through the regular C++ preprocessor. We have improved the handling of Unreal Engine IntelliSense by ensuring consistency and accuracy. IntelliSense will now refresh more readily for UHT generated files, reducing the likelihood of displaying unwarranted errors.
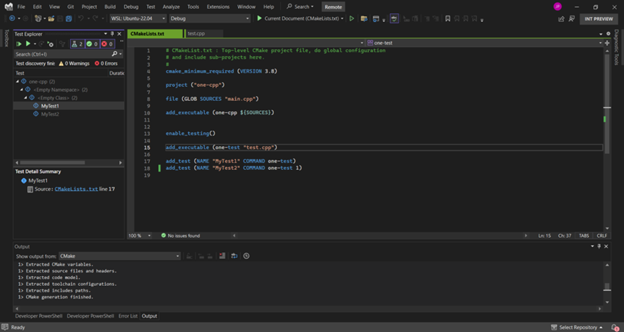
Remote Linux unit testing
Based on your feedback we have enabled running unit tests for remote Linux scenarios. Try it out with your C++ projects that target Linux on WSL or remote systems in the Test Explorer. Learn more about how the Azure Networking Team has used remote Linux in Visual Studio, including remote unit testing.
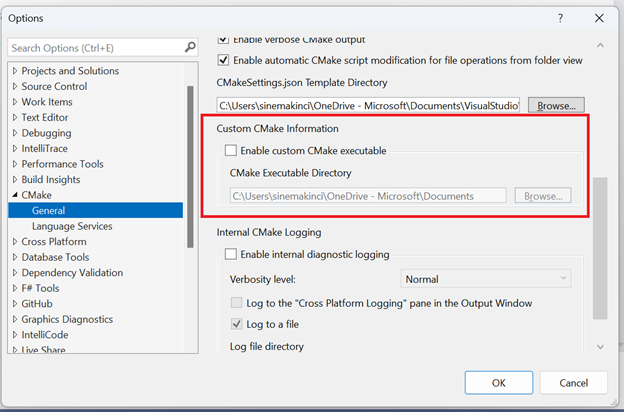
Specify custom CMake executable
Visual Studio ships with CMake bundled when you download the Desktop Development with C++ workload. However, you can now specify your own custom CMake executable on your machine if desired. Navigate to Tools > Options and select CMake > General. From here, you can check Enable custom CMake executable and specify the directory path of your CMake executable you wish to use.
C++ Memory Layout Visualization
Based on your feedback we have added the Memory Layout feature. This feature enables visualization of the memory arrangements for your classes, structs, and unions directly within your editor, removing the need for compilation to view these layouts. When you hover over your types, a “Memory Layout” link will appear within the Quick Info. Clicking this link will open a dedicated window displaying the memory layout of the selected type. Furthermore, hovering over individual data types within this window will provide detailed information about their size and offset within the type.
#include Diagnostics
Visual Studio now introduces #include Diagnostics, which provides a detailed analysis of your #include directives by displaying their references and build time. Once you turn on this feature, the number of references will be displayed in CodeLens. From there, you can easily navigate to the list of references and locate each reference. To view the build time of your #include directives next to their references, you will need to run Build Insights by navigating to Build > Run Build Insights.
.NET/C#
Automatic Deoptimization
With .NET 8, the Debugger now automatically optimizes release code and external code while debugging. When you set breakpoints and go through your code step by step, only the parts you stop at will be optimized, keeping the rest of your application running smoothly. To use this feature, you just need to turn off the “Just My Code” option in the debugger settings. This improvement brings benefits like fewer errors in the locals, watch, and immediate windows, and less unexpected code jumps when you’re debugging your application.
Razor Snippets
HTML snippets are now available in Razor (.razor) files, making it easier and faster to write out common, repeating code patterns. To insert a snippet, start typing a common HTML tag (i.e. <table>) and select one of the dashed-box options from the resulting dropdown.
Multi-TFM Support for Razor Files
Multi-targeting framework support (TFM) is now available for Razor files. This allows you to include code that targets a particular framework and filter between code that targets each framework using the dropdown header above the editor window. You can also use the navigation bar drop downs to quickly navigate to different classes and members in the Razor file.

Blazor Scaffolding for .NET 8 Projects
We have added support to scaffold views for Blazor projects, including CRUD (Create-Read-Update-Delete) using Entity Framework. After adding a model class to a Blazor project, you can get started with scaffolding by right clicking on the project in the Solution Explorer and selecting Add > New Scaffolded Item. In the dialog that appears the new scaffolders are in the node under Common > Razor Component.
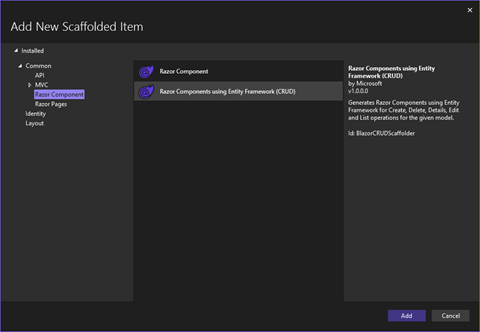
If you select the option Razor Components using Entity Framework (CRUD), you will get another dialog prompting for the details of what should be scaffolded.

Here you select your model class and the DbContext that should be used. You can also create a new DbContext if needed. After completing this process files will be added to your project to enable the CRUD operations on the model class selected.
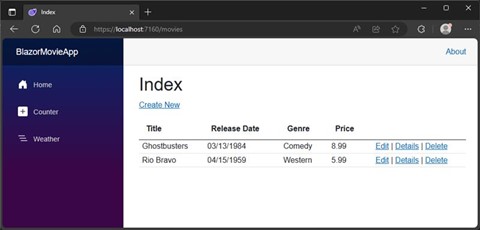
The UI which is generated from the model provided looks like this:
Some important notes on the code which is generated in your project.
- The scaffolded code uses the new static server-side rendering support in Blazor in .NET 8
- The generated components only work on the server – they aren’t supported with WebAssembly based rendering
- The generated code uses the new QuickGrid component in .NET 8 for the table, which supports, sorting, filtering, pagination, etc if you enable interactivity on the page
Live Property Explorer Support for.NET MAUI
Live Property Explorer, a powerful tool that enables more efficient development, is now supported with .NET MAUI. It enables you to inspect XAML properties while debugging, to be used in conjunction with XAML Live Preview and Live Visual Tree.
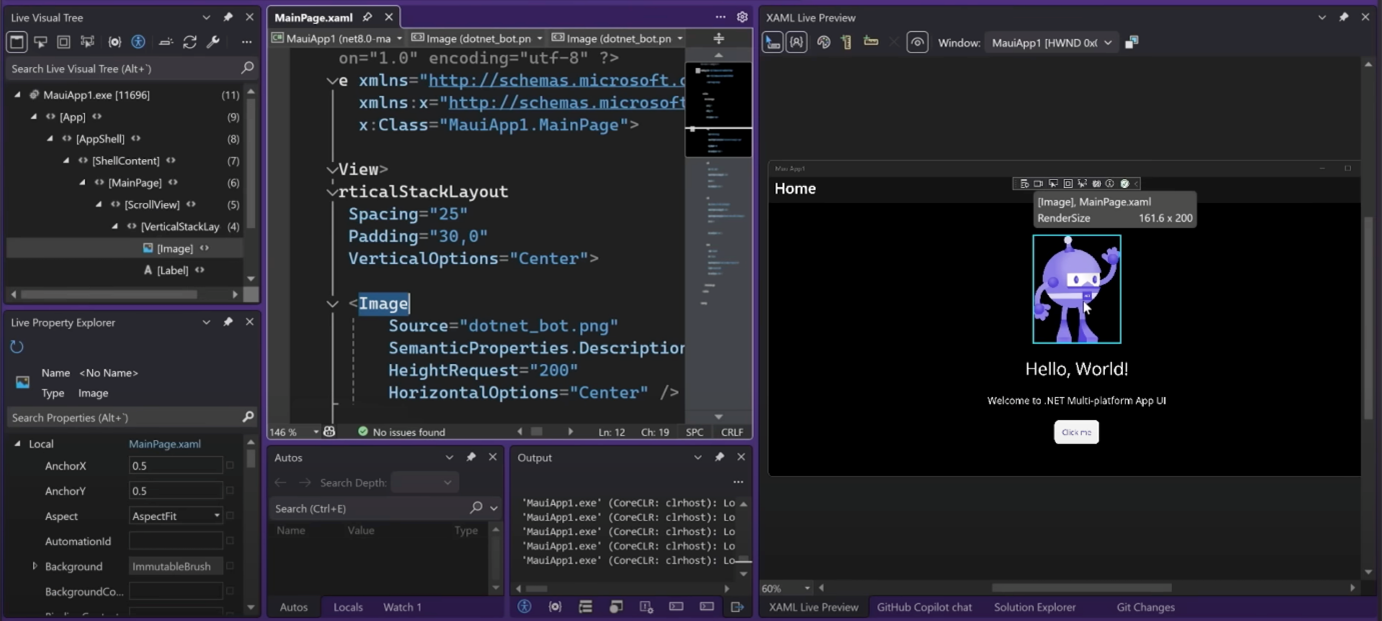 With LPE, you can easily view and tweak the properties of your app controls at runtime, which is especially useful when you’re looking to debug issues, optimize performance, or investigate where a property is defined in.
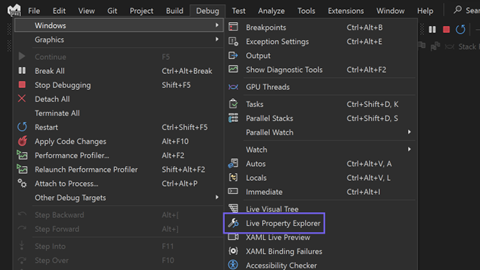
To access the Live Property Explorer: Start and debug your app. Then, navigate to Debug > Windows > Live Property Explorer. Once you’ve opened the Live Property Explorer, you can use it to explore and live edit properties in your .NET MAUI app. For more information, visit our docs.
Ecosystem
Extensibility
Many of our developers, including myself, enhance their Visual Studio environment by using custom extensions that provide targeted, specific, and often contextual functionality. However, it’s not always easy to standardize extension use across teams, projects, installations, etc. We’re happy to announce that starting in Visual Studio 2022 version 17.9, you can use your vsconfig files to include extension information alongside the component listing. Since *.vsconfig files are easy to pass around and share with others, it’s now easier to share information about which extensions need to be installed. This capability to load extensions thru a vsconfig file was one of our top requested community features, and we’re very excited to finally start delivering on this vision.
When the Visual Studio installer reads a vsconfig file, it will detect if any extensions are specified, and if so, it will load them within Visual Studio in a machine wide context, available for all users to use. Recall that *.vsconfig files work in a variety of common scenarios. For example, you can add a vsconfig file to your repo or solution, and when Visual Studio loads the solution it’ll process the config file and prompt you to load any missing components or now extensions. You can use the installer and import a config file into an existing installation, or use it to initialize a new installation. You can programmatically modify an existing installation and pass in a vsconfig file to the installer or use it with winget configure. Lastly, you can create a layout using a vsconfig file and now you can instruct clients that install from that layout to respect the config file.
In 17.9, we’re delivering the first iteration of this experience, but there are more features still under development. For example, we’re working on the ability to detect missing non-marketplace extensions in the config file during solution load, the ability to export extensions, and the ability to load “complex” extensions. We’ll soon start to work on streamlining the other common installer operations such as update.
Please try this feature out and let us know what you think! Your feedback is valuable and helps us prioritize which important and useful functionality to deliver next.
Discover Visual Studio Subscriptions
Many Visual Studio Enterprise or Professional subscribers might not be aware that their subscription includes additional benefits beyond the IDE. To help you discover and activate your benefits, we have added a new diamond icon to the Visual Studio toolbar.
Upon clicking the diamond, a window opens to highlight our most popular benefits. In addition, the diamond experience provides links to take you to your my.visualstudio.com portal where you can find additional offerings such as training resources, magazine subscriptions, in-depth support, and product downloads. For more details about the benefits included in your Visual Studio Subscription, please login to My.VisualStudio.com.
Share your feedback and stay connected with Visual Studio!
We appreciate the time you’ve spent reporting issues/suggestions and hope you continue to give us feedback when using Visual Studio on what you like and what we can improve. Your feedback is critical to help us make Visual Studio the best tool it can be! You can share feedback with us via Developer Community: report any bugs or issues via report a problem and share your suggestions for new features or improvements to existing ones.
Stay connected with the Visual Studio team by following us on YouTube, Twitter, LinkedIn, Twitch and on Microsoft Learn.
On behalf of the entire Visual Studio team, thank you for reading. Happy Coding!
 Light
Light Dark
Dark
63 comments
Is it just me, or do some gifs consist of only 1 frame so basically just a jpeg?!?
eg. Automatic Deoptimization or Multi-folder open support
I’ll double check this! They worked earlier but sometimes things get messed up after it posts. Thank you!
Dear Maddy
Please 1. accurately show errors in Visual Studio don’t mix them with warning messages I have to scroll up/down many times to see the error line.
2. Please add RDLC report or any type of report to MVC core web apps we are struggling to create simple and easy receipts during web app developments.
Best,
Mariwan
Thank you for the suggestions! The best thing to do is see if these have already been suggested via Help > Send Feedback > Report a Problem, and then upvoting or commenting on tickets there. We don’t track feature requests from the blog posts!
Sorry but using Visual Studio feedback is absolutely useless. I’ve been reporting bugs for Blazor there since VS 2022 early launch very dutifully and I have achieved nothing other than losing 100 – 200 hours of my time.
Does anyone know what happened to the UI refresh? Was that shelved earlier? I couldn’t find any updates on it in other posts
If you’re referring to the UI Refresh that MS refers to with changing the UX to be Fluent then the last official post was in Nov [here](https://devblogs.microsoft.com/visualstudio/the-visual-studio-ui-refresh-preview-is-here/). The option is still in preview builds only and must be turned on.
If you are instead referring to the refreshed start window, then that was mostly shelved after the backlash. I don’t know that there has been updates since then.
UI Refresh is still alive and well – we’ve moved it into the 17.10 previews until it’s ready to go GA!
UI Refresh was the reason I made the download. Knowing they were planned for 17.9.
Was little disappointed seeing the old UI.
But using the Feature Flags extension made me smile again 🙂
1. Download and install the Feature Flags extension for VS 2022.
2. Navigate to [Tools – Options – Environment – Feature Flags] and check the ‘Shell.ExperimentalStyles’.
3. After restarting VS, you can use the UI Refresh feature on your VS 2022 17.9. (It also works on VS 2022 17.8.x)
The best part about this update is how it was forced upon me, had to restart my PC and now it Visual Studio crashes every 10 seconds after I load a project.
Hi Andrew! I’m sorry you’re running into this issue. Could you please report a problem on this following the steps here so the proper team can follow up with you: https://learn.microsoft.com/en-us/visualstudio/ide/how-to-report-a-problem-with-visual-studio?view=vs-2022
How was it forced upon you? I have to elect to update my copy of VS and it won’t do that until I shut it down. After that I have to select which copies of VS I want to update, if any.
I didn’t have to restart my machine. Were you running an older version of VS such that it had to replace system components?
My VS is running without any crashes. Perhaps it is related to a component that you installed? You might need to narrow down the list or run with logging to figure it out. You might also check to see if it installed any “recommended” components that may now be causing issues.
I also experienced something similar. I can’t remember the Visual Studio Installer ever before launching automatically, nor starting an update of VS 2022 automatically. It happened after I logged on to my PC after todays (14th Feb 2024) Windows update. The Visual Studio Installer was then already running the VS 2022 update. I didn’t do anything to cause this to happen.
Hi Bent. I suspect what’s going on in your situation is that you’re part of an organization who has opted in to automatically deploy our most current security updates using our “administrator update” solution. We release security updates every patch Tuesday, and the Feb security updates are versioned 17.8.7. I think what happened is that these VS security updates started to apply automatically in the background, and then your machine rebooted, and then the update finished when you logged back on. That’s how you noticed it. We’re actively making improvements to the experiences so that the updates can finish in the background *before* you log back in. Also, my guess is that your client has been automatically updating to the latest secure version for a while due to organizational policy, you just were never aware of it. To check if you’re enrolled in Visual Studio administrator updates, look for the policy setting “AdministratorUpdatesEnabled” in your registry.
Where is .NET MAUI SR2?
Make Build Configuration Window resizable and honor Dark Theme.
The same for Tools -> Options window.
Thank you for adding scaffolding and HTML snippets for Razor! Hopefully the hot reload problems for Blazor (false positive code change detections, sluggishness, etc) can be addressed this year. 🤞
With .NET 8, the Debugger now automatically optimizes release code and external code while debugging. When you set breakpoints and go through your code step by step, only the parts you stop at will be optimized, keeping the rest of your application running smoothly.
This text doesn’t make any sense. I assume you mean de-optimizes (as in removes code optimization). Optimization is what makes debugging a challenge as the code is not in order and variables get inlined.
I think it should be like this, from the What’s New tab in Visual Studio.
In .NET 8, the Debugger now automatically deoptimizes release binaries and external code when debugging. Breakpoints and code stepping only affect the specific parts you pause in, keeping the rest of the application running optimally. To utilize this feature, simply disable the ‘Just My Code’ option in the debugger settings.
Ahhh what a let down… not surprised at all that yall moved the UI refresh for 17.10. Anyways the memory layout is impressive, does it take in consideration Structure Member Alignment, Padding and Data Packing, or just an approximation of the “sizes”?
Has the bug about how Tabs sometimes loses all your open files that happened again to me earlier today been fixed?
This is one of the (many) reasons why I’ve created ContextKeeper extension (available in VS Markeplace). It remembers all your opened files, and even breakpoints & bookmarks.
When you work with git, it will continuously auto-save your open files associated with git branch, which will make switching between branches more enjoyable experience – all your branch-related files will be restored automatically in VS after switching branches.
Hmm, Visual studio installer “Developer news” tells me “Visual Studio 2022 17.9 Now Available”
I had 17.8.6 installed, and the installer updated it to 17.8.7. It’s now telling me “All installations are up to date”.
In the “Available” tab, I only see “17.10.0 Preview 1.0”
What’s up with that?
Ah, I thought it was just me – there’s something very odd going on with the version of VS 2022 updates (on the “current” branch at least).
I’m confused. Can you clarify what’s going on?
Last night (UK timezone here), there was a build 17.9.0 with release notes dated 13 Feb 2024 displayed at:
https://learn.microsoft.com/en-us/visualstudio/releases/2022/release-notes
But now I login to try to update 17.8.6 and I get release notes for 17.8.7 and a small patch to 17.8.7, not an update to 17.9.0.
Has 17.9.0 been withdrawn?
What’s going on?
Further update to myself and others interested…
1) I started up VS 2022 17.8.6
2) I had a notification of an update in the IDE of an available update. I expected this to be to 17.9.0, but it wasn’t, it was to 17.8.7, to my surprise – hence these messages
3) I accepted the update in the IDE, shut the IDE down and let the update run.
4) Restarting the IDE confirmed that the IDE was now upgraded to 17.8.7 (with no prompts/needs for a reboot), as did running a command prompt.
5) I closed the IDE.
I then posted the comments above.
Decided to then try a different tack, and downloaded the boot strap installer for VS 2022 Professional from:
https://visualstudio.microsoft.com/thank-you-downloading-visual-studio/?sku=professional&channel=Release&version=VS2022&source=VSLandingPage&cid=2030&passive=false
I ran this installer which then offered me a BIG (c. 4Gbytes) update from 17.8.7 to 17.9.0 as expected.
In short, you get a differing experience depending on whether running the updater from within the IDE or the bootstrap install from out of it.
I think there may have been a late issue discovered that caused MS to pull 17.9 then republish it. I got prompted to update from 17.8.6 to 17.8.7 in the IDE, clicked to do that, the installer started the update then puked and told me that the current update had been superseded, restarted the update and it was now to 17.9. :shrug:
I was getting the same thing; however my scenario was different, just dropping in the solution here.
Turns out I had Visual Studio 2022 Professional LTSC so it only offered the 17.8.7 update. Since I was on the LTSC it didn’t offer 17.9, but on the available tab of the VS installer it offered it as a whole new install. Don’t do this, as you can switch from LTSC to the current channel instead:
1) On the installed tab, click on the more dropdown and select “Update settings”
2) Change the “Update Channel” to “Current”, click ok to close the dialog
3) The installer will now tell you about an update for v17.9 being available, click the update button and wait for it to finish. It was around 2GB update for me.
Is it just me or did I lose all text color on the scroll bar map (minimap) after this update?
All the text on it is grey now, much harder to find specific code regions at first look.
edit.. there is definitely something going on with the colors, not just in the minimap but also in the code itself, I’m missing a lot of different colors in the code that I had before the update.
My Visual Studio Extension – Visual Assist – lost the ability to color code C# code with this update. Something definitely changed. Even the Visual Assist folks agree.
this comment has been deleted.
It’s funny because both things (minimap and Visual Assist coloring) affect C# but not C++.
Was forced to rollback because of this issue… Lost nearly all my colors in editor.
Same here – color syntax is not working for some keyword (ex. type name parameter). I have custom color theme and now it’s broken. Also color of title bar for “search” window was changed to some dark one – previos it was consistent with everything other, now it’s just barely visible which tab is selected in there (ctrl+, or ctrl+q search window). But having broken syntax color for code is something that shouldn’t be there.
Non-modal Debug Visualizers
doesn’t work on my end, stil modal.
Could you tell us which visualizers you were trying to open? Could you verify that the ‘Tool Window String Visualizers’ and ‘Tool Window DataSet and IEnumerable Visualizers’ options are present and checked in the ‘Preview Features’ settings of VS? Thanks!
I tried string visualizer and ienumerable visualizer.
In this sample application:
https://i.stack.imgur.com/B2qp8.png
No, those options aren’t present.
https://i.stack.imgur.com/YkUPF.png
Is it actually a feature of 17.10 preview, instead of 17.9?
I have the same problem. The visualizers still show in modal windows. And I don”t see any visualizers-related option in the Preview Features settings page.
I’m trying to open the Text Visualizer, nothing fancy.
Sadly, this is due to a bug on how the feature was configured to show up in the UI. Please follow the instructions described in https://developercommunity.visualstudio.com/t/Text-visualisation-is-not-working/10584255 to enable the feature manually in case you can’t see it. This will be fixed for 17.10 Preview 2.
Likewise here. Don’t even have mentioned Preview Options and all visualizers appear modal.
Please take a look at my previous reply for a workaround.
Sadly, this is due to a bug on how the feature was configured to show up in the UI. Please follow the instructions described in https://developercommunity.visualstudio.com/t/Text-visualisation-is-not-working/10584255 to enable the feature manually in case you can’t see it. This will be fixed for 17.10 Preview 2.
Hi everyone
It looks like in this version the old search experience is no longer available, only the new all-in-one search experience. This is hugely frustrating for me for one single reason: the window does not open in front of the Visual Studio instance that opened it. It’s incredibly jarring and unintuitive for me to press Ctrl + T while focused on the VS instance in front of me only to have the search window open on another screen out in my peripheral vision, and then if I move it to be over the active instance, if I then want to search in the other window, the same problem occurs. I don’t exaggerate when I say this has made code search totally unusable for me now; I’ve had to revert to manually finding what I’m looking for in the solution explorer.
Please – I’m really pleading here – please consider providing an option for the search window to NOT remember it’s position and always open in front of the VS instance that opened it? 🥺
My teammate said that he can’t disable this functionality after VS update to version 17.9.
Please let us to use old version of
What is the advantage of the new search experience exactly?
I see none, but I see drawbacks:
– Slowness
– Too many options.
Can the new search experience mimic what the classic search experience does?
This is what I need:
– Inside the current file, go to member/method/field: Ctrl+t + keywords
– Open file: Ctrl + t + f + keywords
I need nothing else.
Hopefully no one will come to the idea to remove/replace the F12, Shift+F12, and F8.
Hi Marc, thanks for sharing your feedback.
– If you are experiencing significant slowness, please file a feedback ticket so our engineers can follow up: Report a problem with Visual Studio – Visual Studio (Windows) | Microsoft Learn.
– Would you share what are the options that you find unnecessary?
– We plan to support this capability in an upcoming release. See the following suggestion ticket: All-In-One Search can’t set scope of searching – Developer Community (visualstudio.com)
Could you explain what’s different between the new and classic experience for open file? Please correct me if I’m wrong, but I’m reading this as the same as this suggestion ticket: “All-in-one Search”: Please do not require colon in the category prefix (f:, m:, t:) – Developer Community (visualstudio.com).
Hi Leah,
Thanks for responding.
Slowness
The new search experience is a bit slower than the classic search.
I can live with that, no problem.
Is there any way I can do the following tasks with the new search experience?
Task 1: Open a file by typing a few characters of its name
My workflow with the classic search experience is as follows:
1. I am in the middle of a file, editing code.
2. I need to look up some code in another file whose name I know.
3. I type “Ctrl+T” + “f” + ” ” + “a few characters of the file name”, until the file appears as the first in the list, then press “Enter”.
With the new search experience, I can do this at the cost of one keystroke (“:”, however hard it is to get on my keyboard).
Task 1 winner: Classic search experience.
Task 2: Navigating to a member in the current code file
My workflow with the classic search experience is as follows:
1. I am in the middle of a file, editing code.
2. I need to look up a member/method in the current file.
3. I type “Ctrl+T” + “a few characters from the member name, until the member appears as the first in the list, then press “Enter”.
With the new search experience, I didn’t find how to achieve this.
Daniel, I assume you have multiple VS instances open. Probably on different screens, right?
Hi Jose
Yes, I generally have two or more instances open, and I put each one on a separate screen.
After update I could not start multiple ASP.NET 4.7.2 projects. The following error occurs:
“”
Unable to start debugging. The startup project cannot be launched. Ensure that the correct project is set as the startup project. The startup project can be changed by selecting the ‘Set as Startup Project’ command from the right click menu in Solution Explorer.
Additionally make sure its debug settings are correctly configured in project properties.
“”
This problem was identified months ago:
https://developercommunity.visualstudio.com/t/The-new-Configure-Startup-Project-window/10519200
I can assume there’s a workaround for this problem given that this feature came out in this release..
Why isn’t my Visual Studio 17.8.7 automatically updated to 17.9? Must I update it manually?
Is there any way to hide the new “diamond” icon? Really it’s just advertising and adds nothing useful to the UI.
I’ve been waiting for the automatic closing of quotes and brackets for a long time!
Unable to install Visual Studio Enterprise Edition 2022 17.9 on Windows 10 21H2. I am getting the following error. Any idea how to resolve this?
[66cc:001c][2024-02-15T11:26:47] Error 0x80096004: SHA256 verification for ‘windowsdesktop-runtime-x64.zip’ failed. Expected hash: 6D6AB22EED8D6C2E9A70839E491E8AD2B353FEB02592BC1A293BD24A2F478AE5, Actual hash: DDF5309F08403662F05D03057A9918FA19746D5323F075E4B8F80BE935A87012
[66cc:00f3][2024-02-15T11:36:24] Package ‘Microsoft.Net.8.0.WindowsDesktop.Runtime,version=17.9.34606.255,productarch=x64’ failed to download from ‘https://download.visualstudio.microsoft.com/download/pr/ceafeb53-5ffc-4e08-9518-8dfa7076488d/6d6ab22eed8d6c2e9a70839e491e8ad2b353feb02592bc1a293bd24a2f478ae5/windowsdesktop-runtime-x64.zip’. WebClient download failed: Error: Content-Length is missing from response header.. Bits download failed: SHA256 verification for ‘windowsdesktop-runtime-x64.zip’ failed. Expected hash: 6D6AB22EED8D6C2E9A70839E491E8AD2B353FEB02592BC1A293BD24A2F478AE5, Actual hash: 9F1E6991E38E3E324697B3922826BD0005E88489A98A8056E9982A4E51E59845. WinInet download failed: SHA256 verification for ‘windowsdesktop-runtime-x64.zip’ failed. Expected hash: 6D6AB22EED8D6C2E9A70839E491E8AD2B353FEB02592BC1A293BD24A2F478AE5, Actual hash: DDF5309F08403662F05D03057A9918FA19746D5323F075E4B8F80BE935A87012, Signature: PackageId=Microsoft.Net.8.0.WindowsDesktop.Runtime;PackageAction=DownloadPackage;ReturnCode=0x80131500
[66cc:00f2][2024-02-15T12:06:46] Package ‘Microsoft.Azure.DataLake.Tools.SDK.Compiler,version=10.0.16299.1,chip=neutral’ failed to download from ‘https://download.visualstudio.microsoft.com/download/pr/4ab072bc-1955-45d0-a3ca-9a6253082dc0/822e1d8862425399c7285b4f879c226e54d5199ee227c5b93ac2a4dde4ceb466/Microsoft.Azure.DataLake.Tools.SDK.Compiler.zip’. WebClient download failed: Error: Content-Length is missing from response header.. Bits download failed: SHA256 verification for ‘Microsoft.Azure.DataLake.Tools.SDK.Compiler.zip’ failed. Expected hash: 822E1D8862425399C7285B4F879C226E54D5199EE227C5B93AC2A4DDE4CEB466, Actual hash: 684AE7828994B78802752E2ACA34AC1A3820A5513563D44FCD05CD9CDDB4054E. WinInet download failed: Function: InternetOpenUrl, HR: -2147012894, Message: Unknown error 12002, Signature: PackageId=Microsoft.Azure.DataLake.Tools.SDK.Compiler;PackageAction=DownloadPackage;ReturnCode=0x80131500
Hi! Congrats for the release!
It seems 17.9.0 introduces a new warning 5272 (on throwing a non-copyable object)
You could consider updating the docs here:
https://learn.microsoft.com/en-us/cpp/error-messages/compiler-warnings/compiler-warnings-by-compiler-version?view=msvc-170
https://learn.microsoft.com/en-us/cpp/error-messages/compiler-warnings/compiler-warnings-c4800-through-c4999?view=msvc-170
Thanks!
The expand/collapse margin has changed from plus/minus signs to weird, Lotus Notes-y twisty arrows. Is this deliberate or a bug? More importantly, how do I change it back?
I rolled back to the previous version (17.8.6) with the plus/minus signs since I didn’t find any way to change the icons.
For me the Sticky Scroll margin is displayed in different, bright colors than the rest of the text editor. It looks very jarring with One Dark Pro theme.
Hi, is this version ( 17.9 ) dotnet 8.1 offered or is it still not running with dotnet 8.0?
Thank you.
The Multiple startup Project is not in the Solution Build toolbar which still makes it hard to change from Single Startup Project to Multiple Startup Project
because to activate the Multiple startup project I have to right click on the solution -> Configure Startup projects -> Change the Radio Element from Single to Multiple -> Save and then I have the multiple again
Better: Add the the Multiple Startup Project Configuration also in the Toolbar where we choose our Solution that we can to start (single)
The update to creating pull requests in the browser vs in Visual Studio doesn’t have a discussion, so I have to post this here. As someone who prefers to make PRs in the browser, now the process is much more convoluted. Prior to this update, I could simply right click on my branch and select “create pull request”. Now I have to switch to that branch, do a Push for no reason at all, and select to create it in the browser from that tiny banner that appears. Can we please either have a setting to remember whether we want to create it in the browser or VS, or a popout menu that lets us choose in the Branches list?
Be careful with this update 17.9. In our multitarget framework project it randomly mixes dlls in the output folder. For example it copies dll of net8.0 to net8.0-windows and when you use some windows specific things and for other frameworks aren’t implemented it throwing unexpected exception. Problem is already reported: https://developercommunity.visualstudio.com/t/Random-multitarget-dll-compilation-mishm/10593261
This has to be fixed asap. Same problem in 17.10 Preview 1.
I believe the word “optimize” was accidently substituted for “deoptimize” in several places. After all, it is the de-optimization that makes debugging easier.