Memory Profiling Part 2. Memory Usage Case Study
12 Feb 2024
Subscribe to my newsletter, support me on Patreon or by PayPal donation.
- Part 1: Introduction.
- Part 2: Memory Usage Case Study (this article).
- Part 3: Memory Footprint with SDE.
- Part 4: Memory Footprint Case Study.
- Part 5: Data Locality and Reuse Distances.
Case Study: Memory Usage of Stockfish
Now, let’s take a look at how to profile the memory usage of a real-world application. We will use heaptrack, an open-sourced heap memory profiler for Linux developed by KDE. Ubuntu users can install it very easily with apt install heaptrack heaptrack-gui. Heaptrack can find places in the code where the largest and most frequent allocations happen among many other things. On Windows, you can use Mtuner which has similar1 capabilities as Heaptrack.
As an example, we took Stockfish’s built-in benchmark. We compiled it using the Clang 15 compiler with -O3 -mavx2 options. We collected the Heaptrack memory profile of a single-threaded Stockfish built-in benchmark on an Intel Alderlake i7-1260P processor using the following command:
$ heaptrack ./stockfish bench 128 1 24 default depth
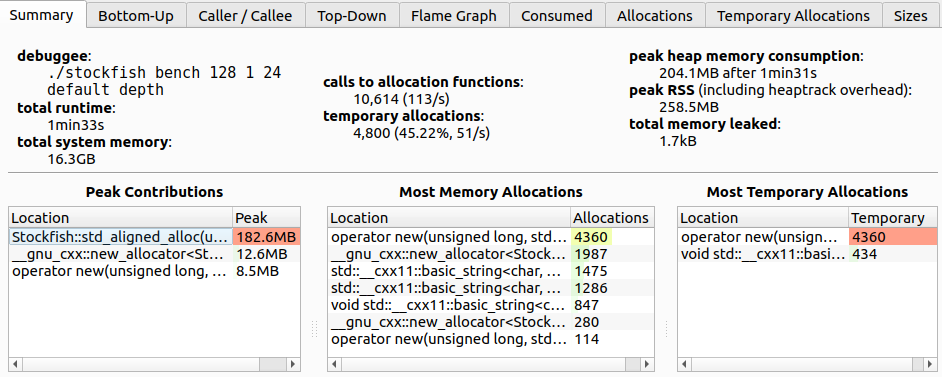
Figure 2 shows us a summary view of the Stockfish memory profile. Here are some interesting facts we can learn from it:
- The total number of allocations is 10614.
- Almost half of the allocations are temporary, i.e., allocations that are directly followed by their deallocation.
- Peak heap memory consumption is 204 MB.
Stockfish::std_aligned_allocis responsible for the largest portion of the allocated heap space (182 MB). But it is not among the most frequent allocation spots (middle table), so it is likely allocated once and stays alive until the end of the program.- Almost half of all the allocation calls come from
operator new, which are all temporary allocations. Can we get rid of temporary allocations? - Leaked memory is not a concern for this case study.
 |
|---|
| Figure 2. Stockfish memory profile with Heaptrack, summary view. |
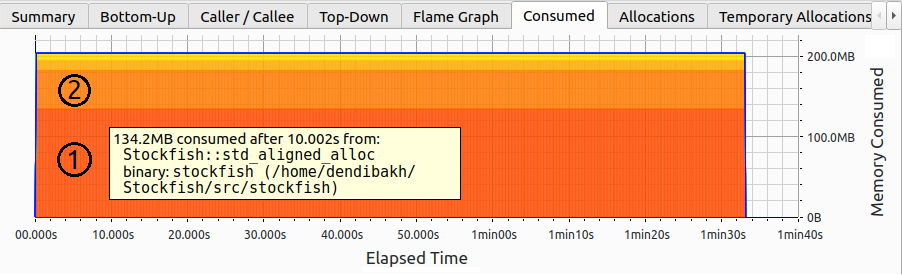
Notice, that there are many tabs on the top of the image; next, we will explore some of them. Figure 3 shows the memory usage of the Stockfish built-in benchmark. The memory usage stays constant at 200 MB throughout the entire run of the program. Total consumed memory is broken into slices, e.g., regions 1 and 2 on the image. Each slice corresponds to a particular allocation. Interestingly, it was not a single big 182 MB allocation that was done through Stockfish::std_aligned_alloc as we thought earlier. Instead, there are two: slice 1 of 134.2 MB and slice 2 of 48.4 MB. Though both allocations stay alive until the very end of the benchmark.
 |
|---|
| Figure 3. Stockfish memory profile with Heaptrack, memory usage over time stays constant. |
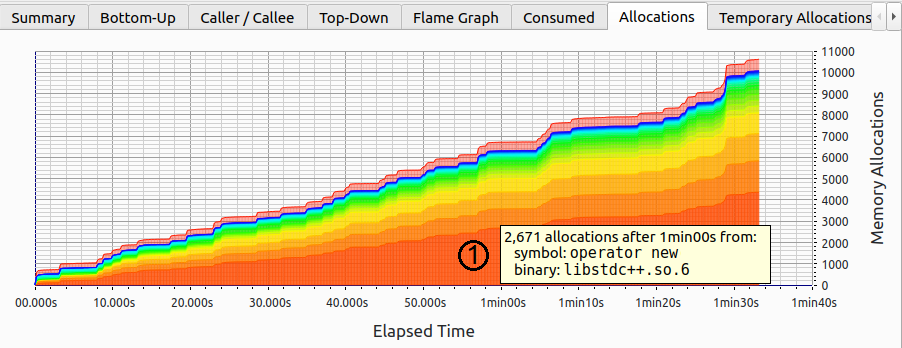
Does it mean that there are no memory allocations after the startup phase? Let’s find out. Figure 4 shows the accumulated number of allocations over time. Similar to the consumed memory chart (Figure 3), allocations are sliced according to the accumulated number of memory allocations attributed to each function. As we can see, new allocations keep coming from not just a single place, but many. The most frequent allocations are done through operator new that corresponds to region 1 on the image.
Notice, there are new allocations at a steady pace throughout the life of the program. However, as we just saw, memory consumption doesn’t change; how is that possible? Well, it can be possible if we deallocate previously allocated buffers and allocate new ones of the same size (also known as temporary allocations).
 |
|---|
| Figure 4. Stockfish memory profile with Heaptrack, number of allocations is growing. |
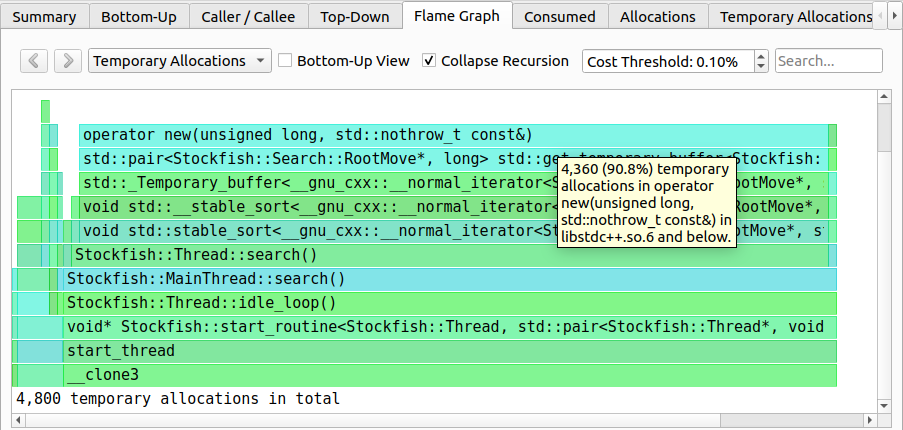
Since the number of allocations is growing but the total consumed memory doesn’t change, we are dealing with temporary allocations. Let’s find out where in the code they are coming from. It is easy to do with the help of a flame graph shown in Figure 5. There are 4800 temporary allocations in total with 90.8% of those coming from operator new. Thanks to the flame graph we know the entire call stack that leads to 4360 temporary allocations. Interestingly, those temporary allocations are initiated by std::stable_sort which allocates a temporary buffer to do the sorting. One way to get rid of those temporary allocations would be to use an in-place stable sorting algorithm. However, by doing so we observed an 8% drop in performance, so we discarded this change.
 |
|---|
| Figure 5. Stockfish memory profile with Heaptrack, temporary allocations flamegraph. |
Similar to temporary allocations, you can also find the paths that lead to the largest allocations in a program. In the dropdown menu at the top, you would need to select the “Consumed” flame graph. We encourage readers to explore other tabs as well.
-> part 3
-
I would be glad if someone can confirm that MTuner has similar features as heaptrack. ↩
All content on Easyperf blog is licensed under a Creative Commons Attribution 4.0 International License