How to Install Grafana and Prometheus on Rocky Linux 9
Grafana is an open-source and multi-platform data visualization platform developed by Grafana Labs. Grafana provides an interactive data visualization web application which includes charts, graphs, and alerts. With Grafana, you can query, visualize, set up alerts, and explore metrics, logs, and traces of TSDB. It is a powerful tool that turns time-series database (TSDB) data into an insightful graph and visualization.
In Grafana, you can add your time-series database data via the 'Data Source'. Grafana supports multiple data sources such as Prometheus, InfluxDB, PostgreSQL, Loki, Jaeger, Graphite, Google Cloud Monitoring, AWS CloudWatch, Azure Monitor, and many more.
In this tutorial, I will install Grafana open-source analytics and visualization web application with Nginx as a reverse proxy. Then, I will install and configure the Prometheus open-source system monitoring with Node Exporter to gather system metrics. Lastly, you will add Prometheus as the data source to the Grafana and set up a dashboard for system monitoring.
For this guide, you will install all of those packages on top of the Rocky Linux 9 server.
Prerequisites
To begin with, you must have the following requirements to complete this guide:
- A Rocky Linux 9 server - You can use multiple servers or a single server for the experiment. Below are the types of installation you must know:
Single server: grafana, prometheus, and node_exporter on a single server.
Two servers: grafana on server1, prometheus, and node_exporter on server3.
Three servers: grafana on server1, prometheus on server2, and node_exporter on server3. - A non-root user with sudo/root administrator privileges.
Installing Grafana
Grafana is a multi-platform application that can be installed on multiple operating systems such as Windows, Linux, and macOS. For Linux systems, Grafana provides repositories for both Debian-based operating systems (Debian and Ubuntu) and RHEL-based operating systems (RHEL, CentOS, Fedora, RockyLinux, AlmaLinux).
In this step, you will set up the Grafana repository and install the Grafana 9.3 on the Rocky Linux 9 server.
Before setting up the Grafana repository, run the below command to set up the default crypto policy backend to 'SHA1' and reboot the server to apply changes.
sudo update-crypto-policies --set DEFAULT:SHA1
sudo reboot
After logging in again, create a new repository file '/etc/yum.repos.d/grafana.repo' using the below nano editor command.
sudo nano /etc/yum.repos.d/grafana.repo
Add the following Grafana repository to the file.
[grafana]
name=grafana
baseurl=https://rpm.grafana.com
repo_gpgcheck=1
enabled=1
gpgcheck=1
gpgkey=https://rpm.grafana.com/gpg.key
sslverify=1
sslcacert=/etc/pki/tls/certs/ca-bundle.crt
Save the file and exit the editor.
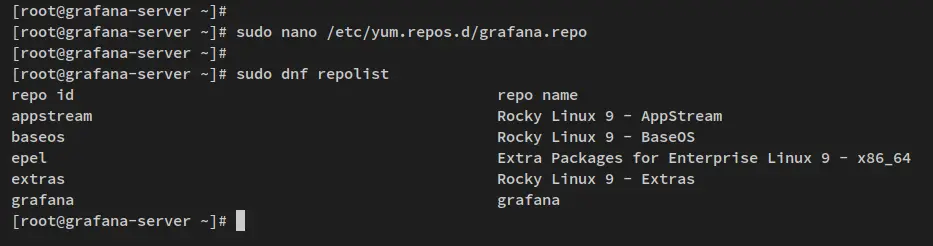
Now run the below command to verify the list repository on your system. You should see that the Grafana repository has been added.
sudo dnf repolist
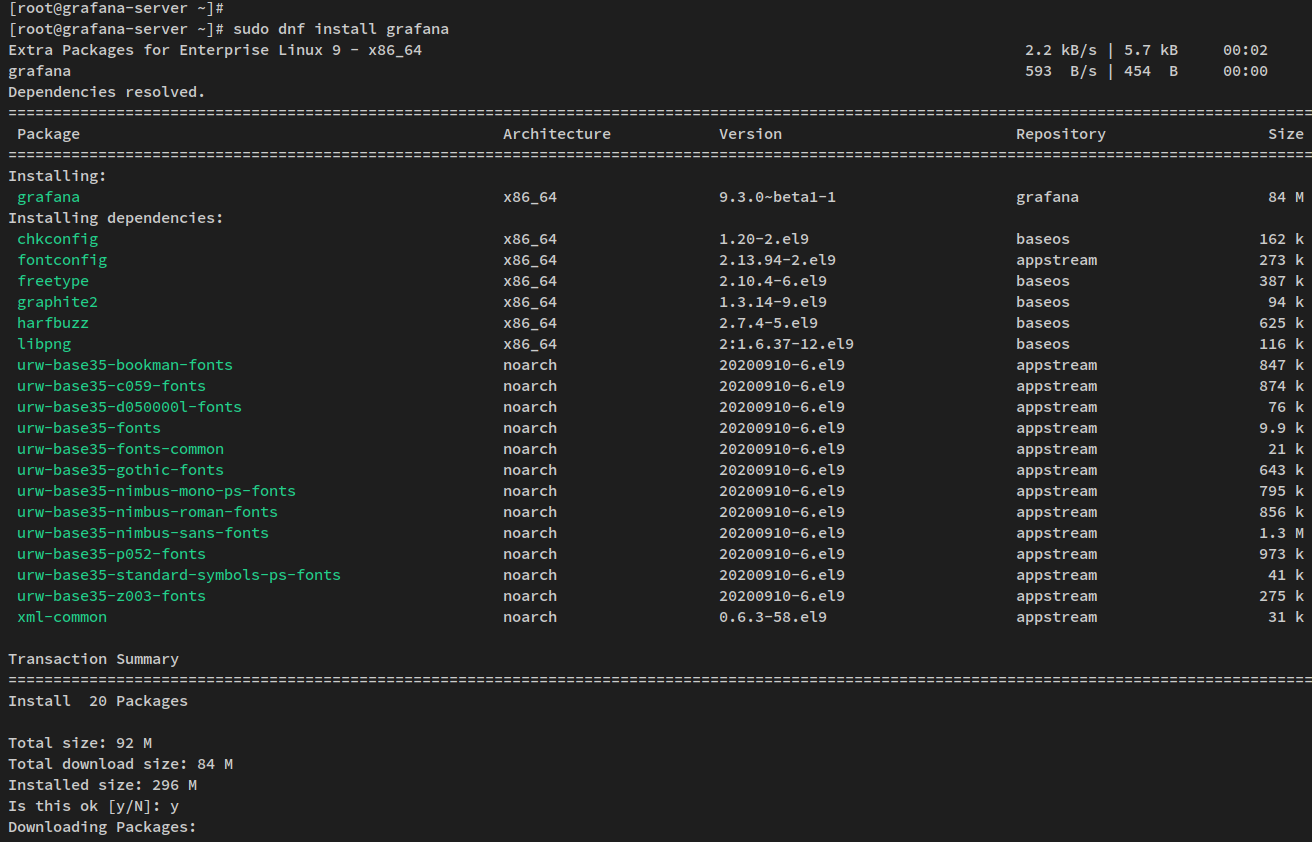
With the Grafana repository added, you can now install the Grafana package via the dnf command below.
sudo dnf install grafana
When prompted, input y to confirm the installation and press ENTER.
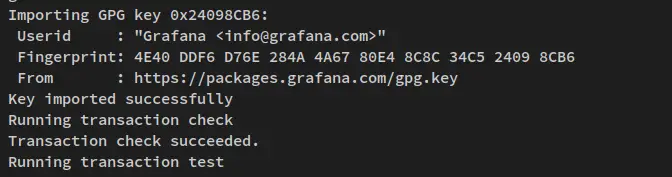
You will also be prompted to confirm the gpg key for the Grafana repository. Input y and press ENTER to add the gpg key to your system.
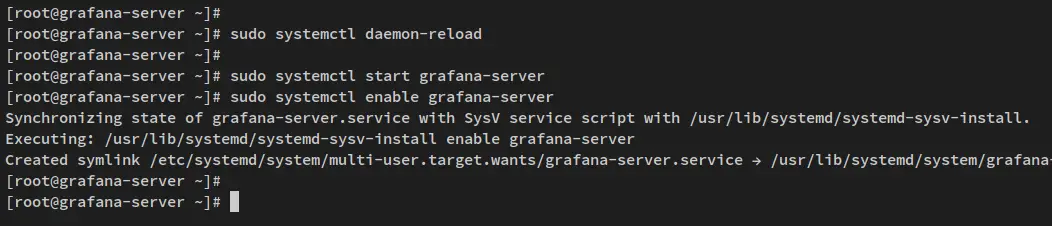
When the Grafana is installed, run the below systemctl command to reload systemd privileges.
sudo systemctl daemon-reload
Then, start and enable the Grafana service 'grafana-server'. The Grafana service should now be enabled and running.
sudo systemctl start grafana-server
sudo systemctl enable grafana-server
Verify the 'grafana-server' service via the below command to ensure that the service is running.
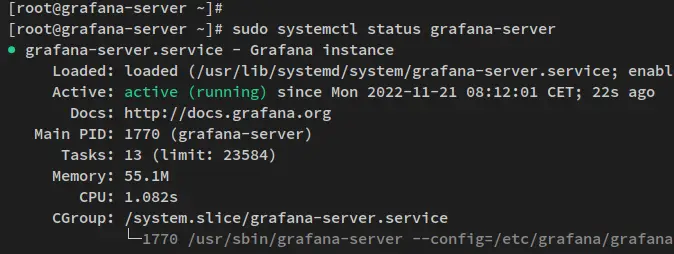
sudo systemctl status grafana-server
The below output confirms that the grafana-server is enabled and running. The grafana-server should now be run automatically upon the bootup.
Configuring Grafana
Now that the Grafana server is installed and running, you'll set up how the Grafana should be run via the configuration filer '/etc/grafana/grafana.ini'. In this example, you'll run grafana on localhost only with the local-domain grafana.hwdomain.io.
Open the Grafana configuration file '/etc/grafana/grafana.ini' using the below nano editor command.
sudo nano /etc/grafana/grafana.ini
Uncomment some below lines and change the default value as below.
[server]

# The IP address to bind to, empty will bind to all interfaces
http_addr = localhost

# The http port  to use
http_port = 3000

# The public facing domain name used to access grafana from a browser
domain = grafana.hwdomain.io
With this configuration, you configure Grafana to run at localhost only with the default TCP port 3000. You'll run Grafana with the local domain grafana.hwdomain.io, which is handled by the reverse proxy.
Save the file and close the editor when you are finished.
Now restart the 'grafana-server' service via the systemctl command to apply new changes.
sudo systemctl restart grafana-server
Grafana is configured, and up and running. You'll next install and configure Nginx as a reverse proxy for the Grafana server.
Setting up Nginx as a Reverse Proxy
In this step, you will install the Nginx web server and configure it as a reverse proxy for the Grafana server. Before installing Nginx, ensure you have a domain name or local domain resolving to your server and SSL certificates generated.
Run the dnf command below to install the Nginx web server to your system.
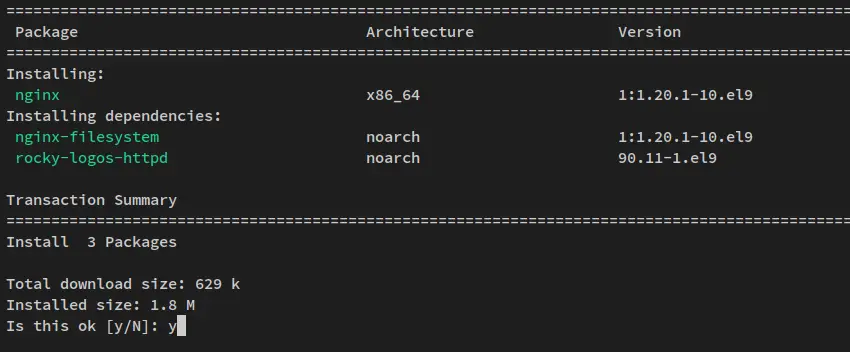
sudo dnf install nginx
Input y when prompted for the confirmation and press ENTER to proceed.
After installing Nginx, create a new Nginx server block file '/etc/nginx/conf.d/grafana.conf' using the below nano editor command.
sudo nano /etc/nginx/conf.d/grafana.conf
Add the following lines to the file and change the details domain name and path of SSL certificates.
# this is required to proxy Grafana Live WebSocket connections.
map $http_upgrade $connection_upgrade {
  default upgrade;
  '' close;
}

server {
    listen      80;
    server_name grafana.hwdomain.io;
    rewrite     ^   https://$server_name$request_uri? permanent;
}

server {
  listen      443 ssl http2;
  server_name grafana.hwdomain.io;

  root /usr/share/nginx/html;
  index index.html index.htm;

  ssl_certificate /etc/letsencrypt/live/grafana.hwdomain.io/fullchain.pem;
  ssl_certificate_key /etc/letsencrypt/live/grafana.hwdomain.io/privkey.pem;

  access_log /var/log/nginx/grafana-access.log;
  error_log /var/log/nginx/grafana-error.log;

  location / {
    proxy_set_header Host $http_host;
    proxy_pass http://localhost:3000/;
  }

  # Proxy Grafana Live WebSocket connections.
  location /api/live {
    rewrite  ^/(.*)  /$1 break;
    proxy_http_version 1.1;
    proxy_set_header Upgrade $http_upgrade;
    proxy_set_header Connection $connection_upgrade;
    proxy_set_header Host $http_host;
    proxy_pass http://localhost:3000/;
  }
}
With this configuration, you'll run Nginx as a reverse proxy for the grafana server that is running on localhost:3000. You'll also secure the grafana via a secure SSL/HTTPS connection. Also, you'll set up a reverse proxy for the grafana WebSocket connections.
Save the file and exit the editor when you are finished.
Next, run the below command to verify the Nginx configuration and ensure that you have the proper configuration.
sudo nginx -t
If you have the proper configuration, you should get the output message such as 'test successful - syntax ok'.
Now run the below systemctl command to start and enable the Nginx.
sudo systemctl start nginx
sudo systemctl enable nginx
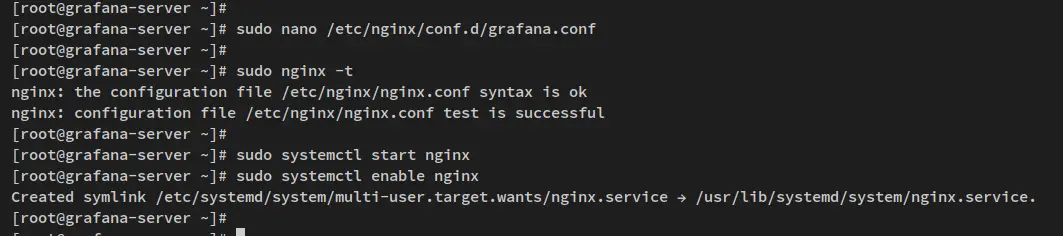
The Nginx service should now be running and enabled. Verify the Nginx service via the systemctl command below.
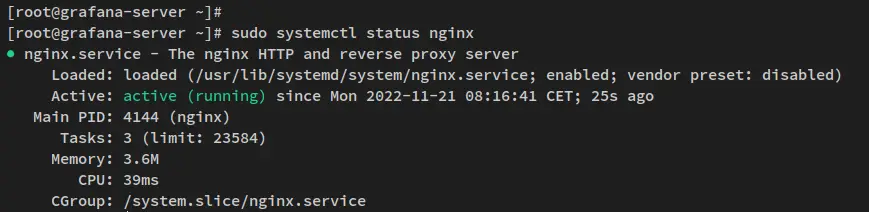
sudo systemctl status nginx
The following output confirms that the Nginx service is running and it's enabled. The Nginx service should be run automatically upon the bootup.
With the Nginx service up and running on both HTTP and HTTPS protocols, you'll then set up the firewalld to open both services.
Run the below firewall-cmd command to add the HTTP and HTTPS service to the firewalld.
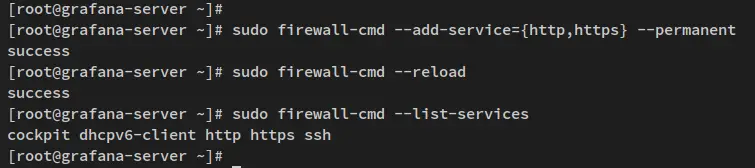
sudo firewall-cmd --add-service={http,https} --permanent
After that, reload the firewalld to apply changes and verify the list of enabled services on firerwalld.
sudo firewall-cmd --reload
sudo firewall-cmd --list-services
You should receive the following output - The HTTP and HTTPS services added t the firewalld.
After configured the firewalld, you will be able to access your grafana and Nginx reverse proxy installation.
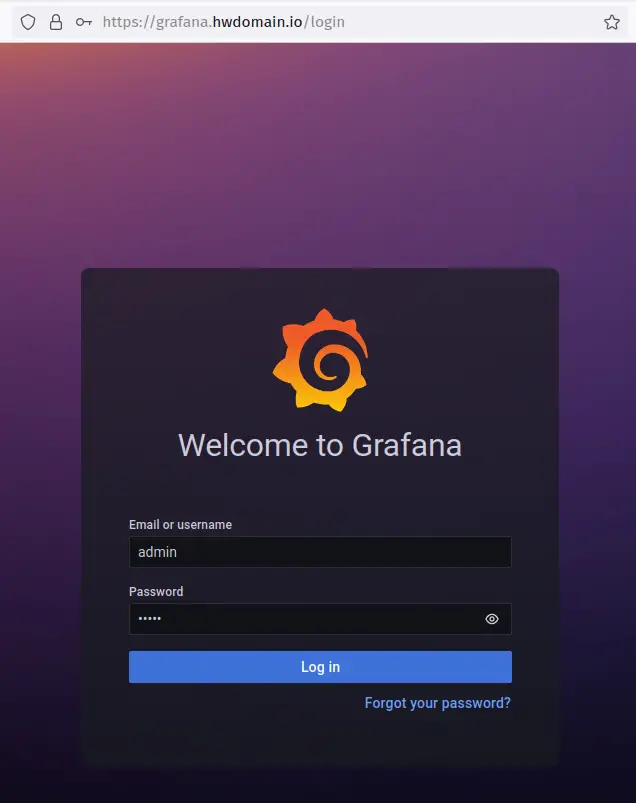
Open the web browser and visit the domain name for your grafana installation (i.e: https://grafana.hwdomain.io/), and you should get the grafana login page.
Log in with the default user/password 'admin'.
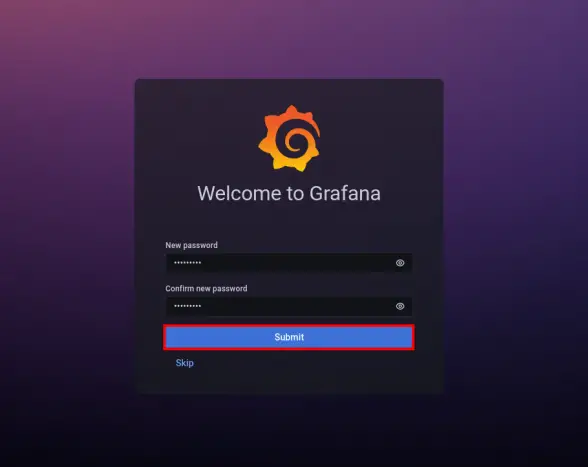
After logging in, you will be asked to change the default password. Input the new password for your grafana installation and press 'Submit' to confirm.
You should now get the grafana dashboard as the following screenshot.
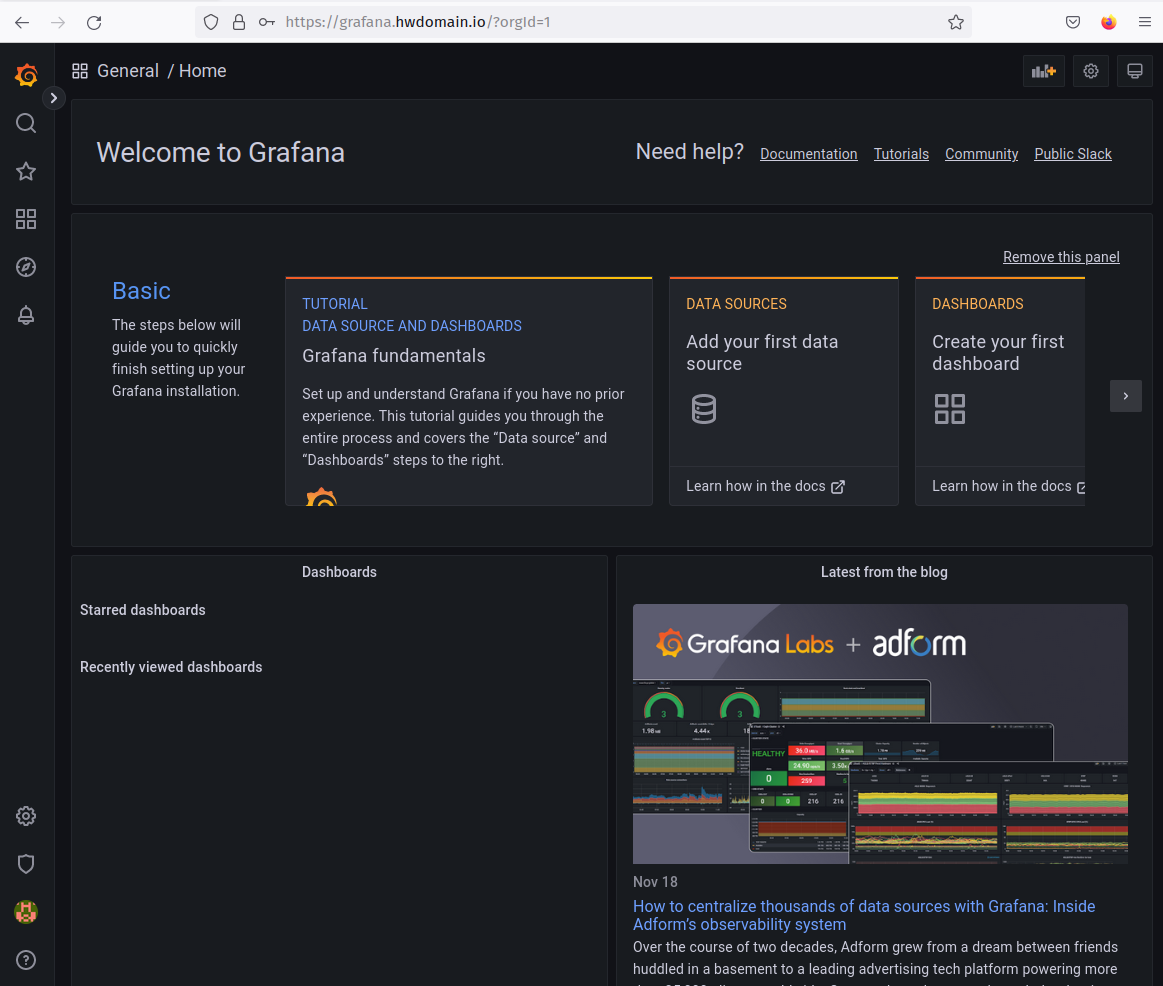
At this point, you have finished the grafana installation and configuration on the Rocky Linux 9 server. You also run the grafana with Nginx reverse proxy and secured the grafana installation via HTTPS and change the default admin user for grafana.
With this, you'll next install and configure Prometheus and node_exporter for gathering metrics of your system and add Prometheus as the data source to your grafana.
Installing Prometheus and Node Exporter
Prometheus is an open-source system monitoring and alerting toolkit. It's a powerful tool for collecting and querying metric data. The Prometheus works by pulling(scraping) real-time metrics from application services and hosts on a regular cadence by sending HTTP requests on metrics endpoints, then compresses and stores them in a time-series database.
The node_exporter is one of the most popular prometheus scrapers for pulling metrics of operating systems. The node_exporter is designed to monitor the host system, it exposes a wide variety of hardware- and kernel-related metrics.
You'll now install prometheus and node_exporter on the Rocky Linux 9 server.
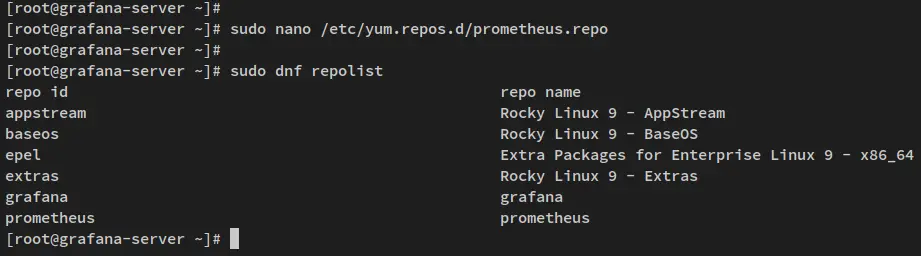
Create a new repository file '/etc/yum.repos.d/prometheus.repo' using the below nano editor command.
sudo nano /etc/yum.repos.d/prometheus.repo
Add the following lines to the file, which is the prometheus repository provided by Packagecloud.io.
[prometheus]
name=prometheus
baseurl=https://packagecloud.io/prometheus-rpm/release/el/$releasever/$basearch
repo_gpgcheck=1
enabled=1
gpgkey=https://packagecloud.io/prometheus-rpm/release/gpgkey
       https://raw.githubusercontent.com/lest/prometheus-rpm/master/RPM-GPG-KEY-prometheus-rpm
gpgcheck=1
metadata_expire=300
Save and close the file when you are finished.
You can now verify the list of available repositories on your system via the dnf command below.
sudo dnf repolist
In the below output confirm that the prometheus repository added to your system.
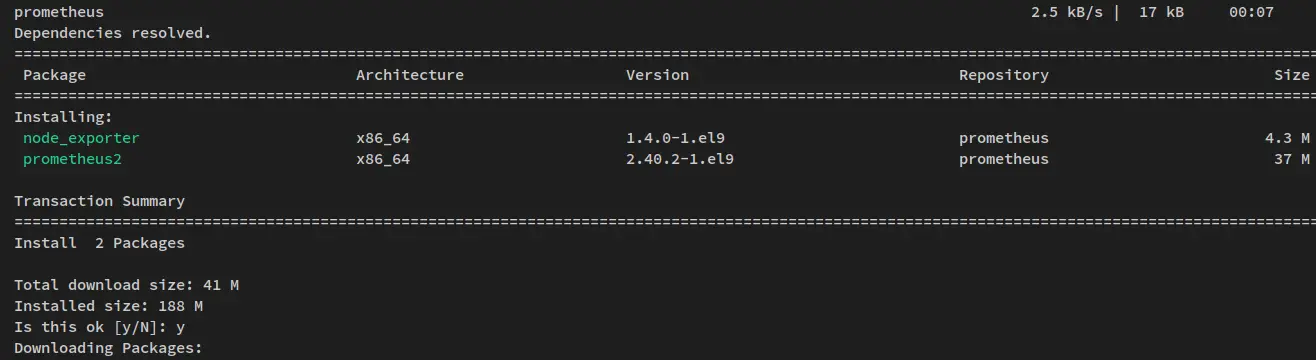
Now install prometheus and node_exporter packages via the following dnf command.
sudo dnf install prometheus2 node_exporter
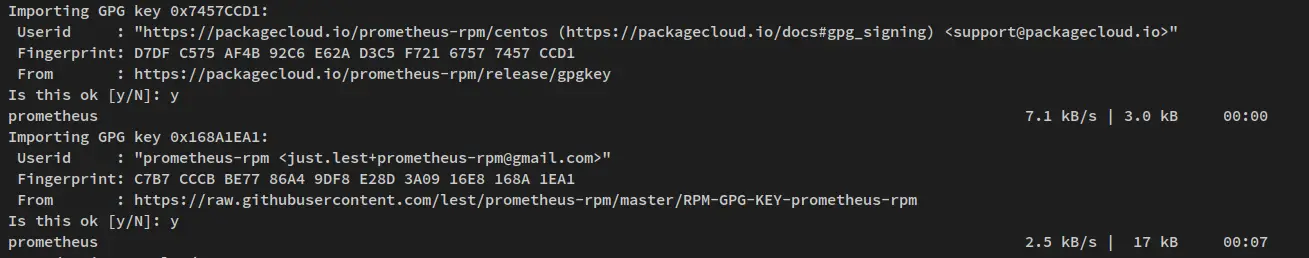
When prompted, input y to confirm and press ENTER. And the prometheus and node_exporter installation will begin.
Also, when prompted to add the GPG key, input y to confirm.
After prometheus and node_exporter is installed, run the following systemctl command to start and enable bot services, the prometheus, and node_exporter services.
sudo systemctl start prometheus node_exporter
sudo systemctl enable prometheus node_exporter
Now verify the promethues and node_exporter services using the below command.
sudo systemctl status prometheus node_exporter
In the below output confirm that the prometheus and node_exporter service is running and enabled. Both services will be run automatically at boot.

The prometheus is running on port 9090 by default, while node-exporter is running on default port 9100. You'll now add both ports 9090 and 9100 to the firewalld.
Run the below firewall-cmd command to add the prometheus and node_exporter port to the firewalld. Then, reload the firewalld to apply new changes.
sudo firewall-cmd --add-port={9090/tcp,9100/tcp} --permanent
sudo firewall-cmd --reload
With the firewalld configured, you can access the prometheus and node_exporter installation. But, you'll next go a step further by configuring both prometheus and node_exporter.
Configuring Prometheus and Node Exporter
After prometheus and node_exporter is installed, you will now set up both services with the following configurations:
- Enabling the basic authentication for prometheus.
- Enabling HTTPS/SSL on prometheus web interface.
- Setting u scrape_config for the target machine.
Enable basic_auth and HTTPS/SSL for Prometheus
On the default installation, prometheus comes without password authentication and runs on the HTTP protocol. To secure the installation, you'll then set up the basic_auth and enable HTTPS on your prometheus installation.
Before setting up the basic_auth on prometheus, run the following dnf command to install the 'httpd-tools' package. This package provides the command 'htpasswd' that can be used to generate a bcrypt password.
sudo dnf install httpd-tools -y
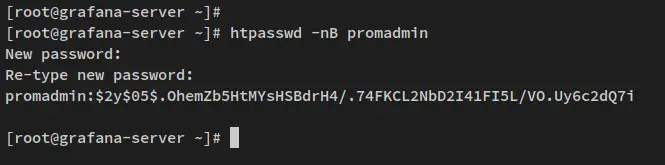
Next, run the below command to generate a password for your prometheus installation. In this example, you will use the user 'promadmin' as the default user for the prometheus basic_auth.
htpasswd -nB promadmin
When prompted, input the password that will be used for prometheus basic_auth and repeat the password.
In the below output, you can see the generated bcrypt password. Copy the username and generated password.
Now create a new prometheus configuration file '/etc/prometheus/web.yml' using the below nano editor command. This configuration will enable HTTPS/SSL and the basic_auth on your Prometheus installation.
sudo nano /etc/prometheus/web.yml
Add the following lines to the file and be sure to change the path of SSL certificates and the username and password that will be sued for your prometheus.
# tls certificates
tls_server_config:
  cert_file: fullchain.pem
  key_file: privkey.pem

# basic_auth
basic_auth_users:
  promadmin: $2y$05$.OhemZb5HtMYsHSBdrH4/.74FKCL2NbD2I41FI5L/VO.Uy6c2dQ7i
The 'tls_server_config' section allows you to enable secure HTTPS/SSL connections, and 'basic_auth_users' will enable the basic password authentication on your prometheus installation.
Save the file and exit the editor when you are finished.
Next, open the file '/etc/default/prometheus' using the following nano editor command.
sudo nano /etc/default/prometheus
Add the following line to the 'PROMETHEUS_OPTS' section.
--web.config.file=/etc/prometheus/web.yml
The option '--web.config.file' will specify the configuration or prometheus web interface. In this example, the configuration is '/etc/prometheus/web.yml'.
Save the file and exit the editor when you are done.
Setting up scrape_config for Target Machine
After enabled the prometheus basic_auth and HTTPS/SSL, you'll next add the target machine to the promethues 'scrape_config' section.
Open the promethues configuration file '/etc/prometheus/prometheus.yml' using the below nano editor command.
sudo nano /etc/prometheus/prometheus.yml
On the scrape_config section, change the default configuration with the following lines.
scrape_configs:
  # The job name is added as a label `job=<job_name>` to any timeseries scraped from this config.
  - job_name: "prometheus"

    # metrics_path defaults to '/metrics'
    # scheme defaults to 'http'.
    # add settings for certificate and authentication
    scheme: https
    tls_config:
      cert_file: /etc/prometheus/server.crt
      key_file: /etc/prometheus/server.key
      # if using self-signed certificate, set [true]
      insecure_skip_verify: true
    basic_auth:
      username: 'promadmin'
      password: 'password'

    static_configs:
      # if using a valid certificate, set the same hostname in the certificate
      - targets: ["localhost:9090"]

  - job_name: "node_exporter"

    static_configs:
      - targets: ["192.168.5.120:9100"]
With this configuration, you'll set up two jobs with the name 'prometheus' and 'node_exporter'. And be sure to change the basic_auth section on the 'promethues' job.
- On the 'prometheus' job, you will enable the HTTPS secure connection and enable the 'basic_auth' for authentication. In the 'prometheus' job, the target host is 'localhost:9090', which is the prometheus server.
- On the 'node_exporter' job, the target is the node_exporter service itself, which is running on port '9100'.
Now run the below systemctl command to restart both prometheus and node_exporter services and apply new changes.
sudo systemctl restart prometheus node_exporter
At this point, you have taken prometheus to the next step by enabling basic authentication and securing via SSL/HTTPS. You also added two scrapes for collecting metrics, the 'prometheus', and 'node_exporter'.
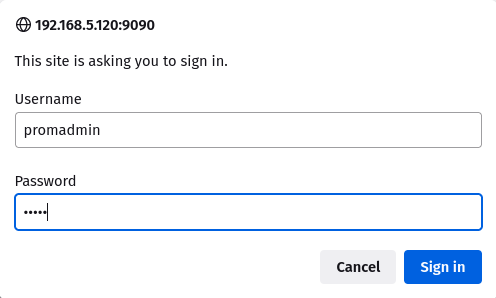
To verify your installation, open up the web browser and visit the server IP address with port '9090' (i.e: https://192.168.5.120:9090/).
You'll now be prompted with the basic authentication, input the user 'promadmin' and the password that you've created.
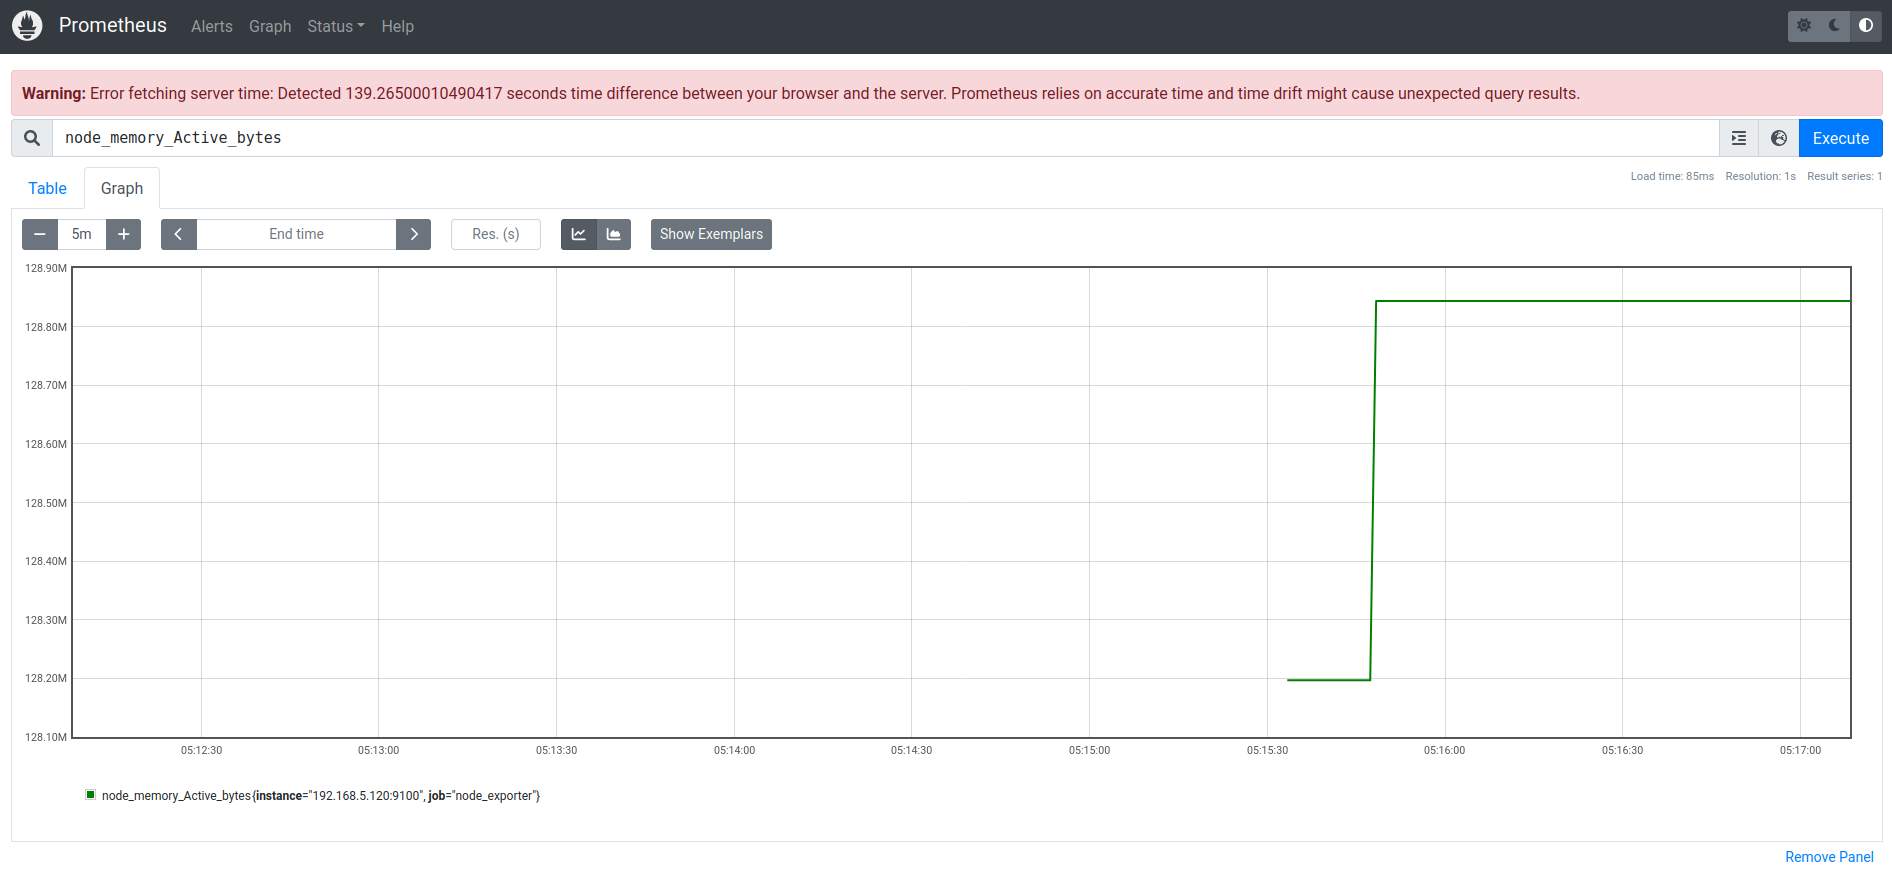
After logging in, you should have the promethues dashboard. Input the query such as 'node_memory_Active_bytes' and click 'Execute'. You should get the metrics from the query that you have executed.
The query 'node_memory_Active_bytes' is provided by the 'node_exporter' for checking the active memory.
Next, click on the 'Status' menu and select 'Target'. You should have two different jobs that you have created, the 'prometheus' and 'node_exporter'. Both the 'prometheus' and 'node_exporter' jobs status is up.

With the prometheus and node_exporter is configured, you'll next add the prometheus as a data source to grafana.
Adding Prometheus as Data Source to Grafana
Grafana supports multiple data sources such as MySQL, PostgreSQL, Influxdb, Graphite, Prometheus, and many more. In this step, you'll add the promethues as the data source to the grafana.
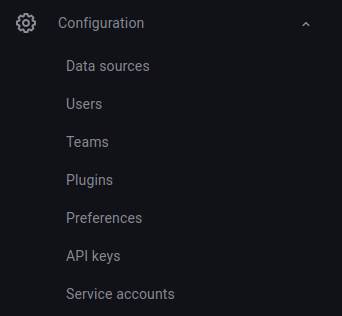
On the grafana dashboard, click the 'Configuration' menu and select 'Data Sources'.
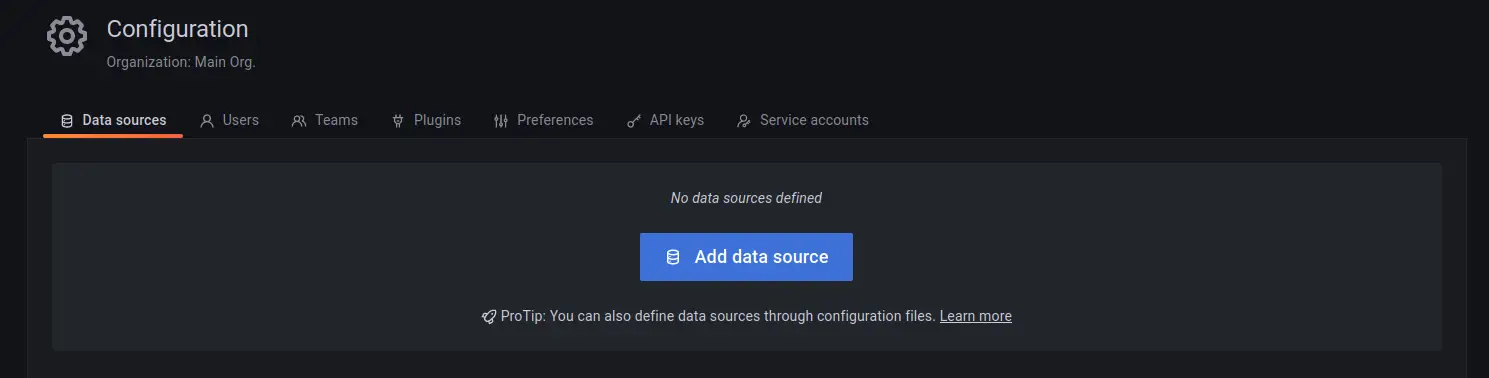
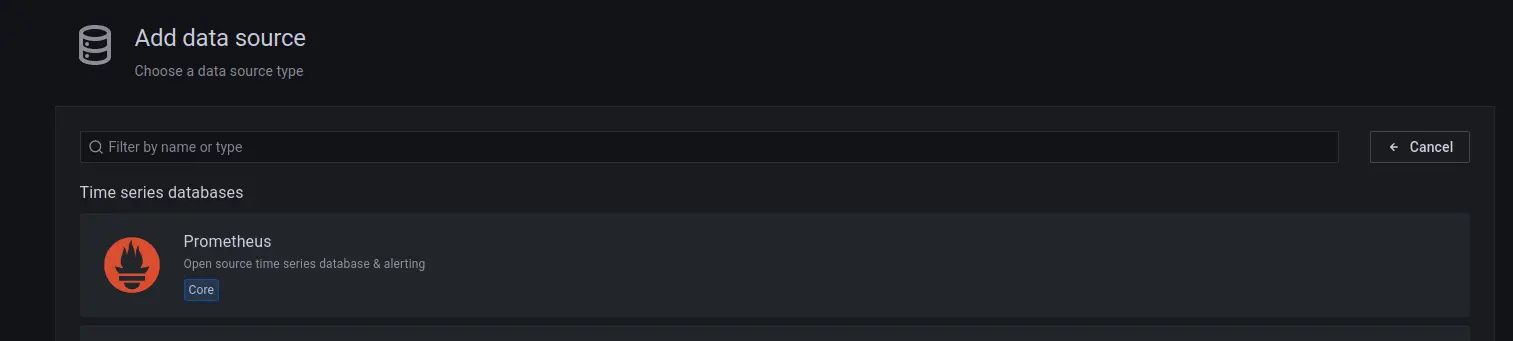
Now click 'Add data source' to add the new data source.
Select the data source type you want to add. This example is 'Prometheus'.
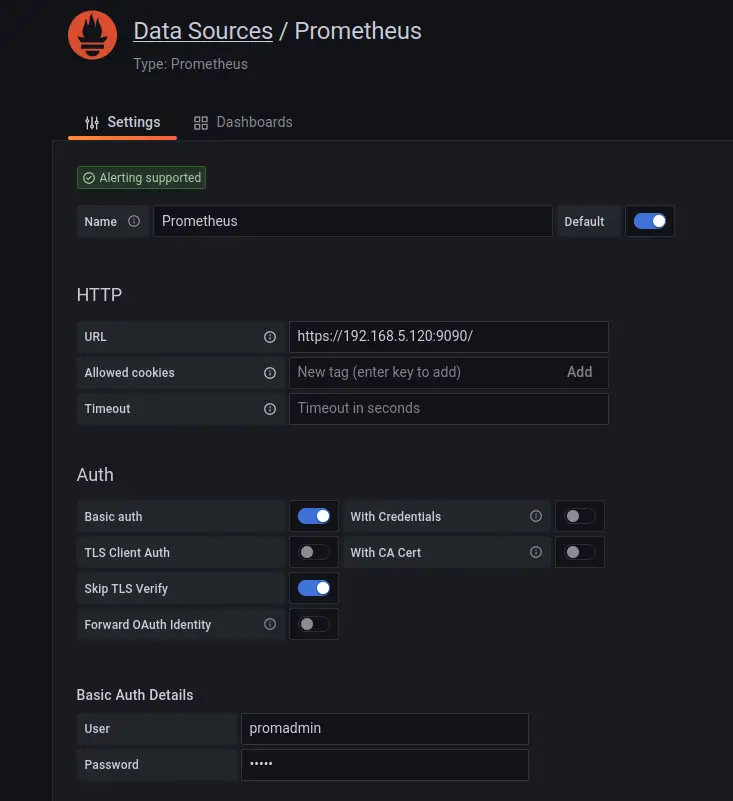
Now input details of prometheus configuration - the 'prometheus' scrape_config. Be sure to enable the 'Basic auth' and the 'Skip TLS Verify' (if you're using the self-signed certificates).
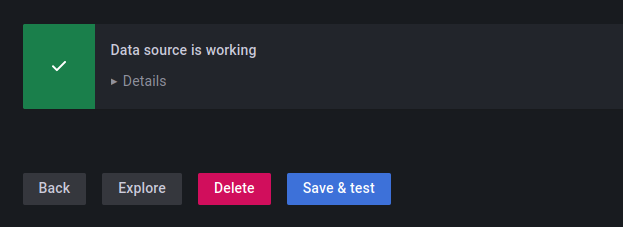
Scroll down to the bottom page and click the 'Save & test' to confirm. if you have the output message such as 'Data source is working', then you are ready to go and added the prometheus data source to grafana.
Setting up Dashboard Monitoring
With Prometheus added to Grafana as a data source, you can create a new dashboard for monitoring your system. You can create the dashboard manually for each cell or by importing some examples of the Grafana dashboard from the Grafana dashboard repository.
In this step, you'll set up the Grafana dashboard by importing the available dashboard online to Grafana.
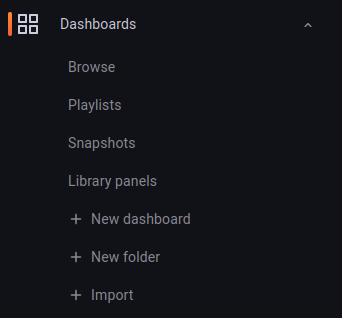
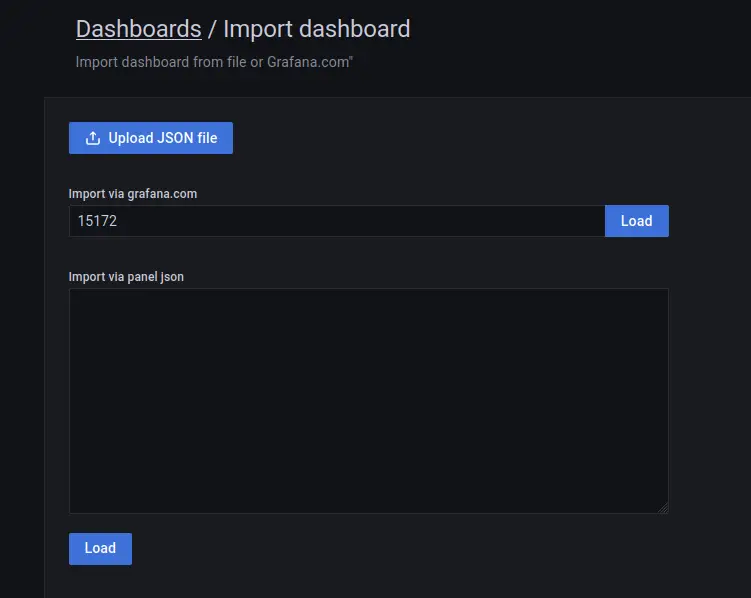
Click on the 'Dashboard' menu and select 'Import'.
Now you can find examples of a dashboard from the Grafana Dashboard repository. This example uses the Grafana dashboard with id '15172'.
Input the dashboard id you want to import, '15172', then click 'Load'.
Now, input the name of the new dashboard and select 'Prometheus' as the data source. Click 'Import' to confirm.
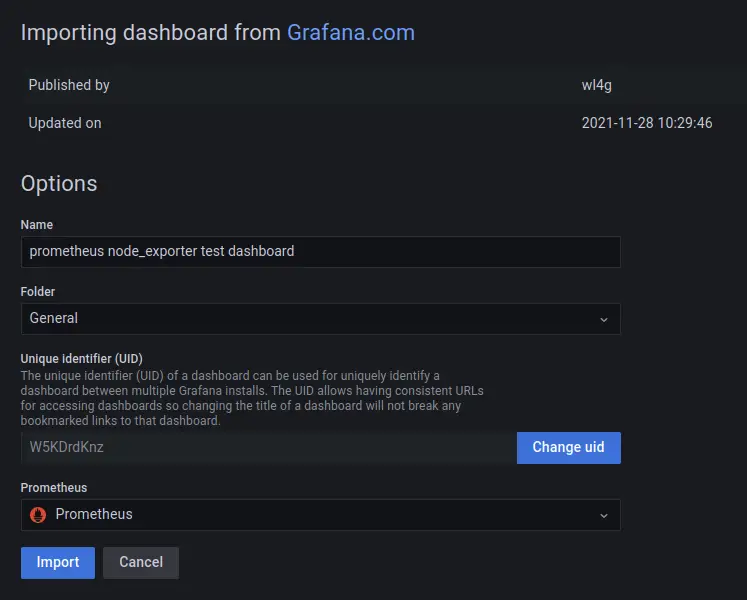
In the below screenshot confirm that the new grafana dashboard with the prometheus data source for monitoring systems is created.

Conclusion
In this tutorial, you installed Grafana for data visualization with Nginx as a reverse proxy on a Rocky Linux 9 server. You also installed the Prometheus and node_exporter along with Grafana.
The Prometheus runs with SSL/TLS connection enabled, basic_auth module enabled for user authentication, and configured two scrapes for collecting system metrics with the Prometheus itself and the node_expoter.
Lastly, you added Prometheus as a data source to Grafana and imported a dashboard for data visualization with data collected by Prometheus and node_exporter.
From here, you can add another exporter for your application to Prometheus and visualize all the metrics via the Grafana data visualization dashboard.

