
One of the biggest challenges for any software is to determine how changes impact user experience in the real world. Whether it’s the processing speed of video editing software or the smoothness of a browsing experience, there’s only so much you can tell from testing in a controlled lab environment. While local experiments can provide plenty of metrics, improvements to those metrics may not translate to a better user experience.
This can be especially challenging with complex client software running third-party code like Firefox, and it’s a big reason why we’ve undertaken the Speedometer 3 effort alongside other web browsers. Our goal is to build performance tests that simulate real-world user experiences so that browsers have better tools to drive improvements for real users on real webpages. While it’s easy to see that benchmarks have improved in Firefox throughout the year as a result of this work, what we really care about is how much those wins are being felt by our users.
In order to measure the user experience, Firefox collects a wide range of anonymized timing metrics related to page load, responsiveness, startup and other aspects of browser performance. Collecting data while holding ourselves to the highest standards of privacy can be challenging. For example, because we rely on aggregated metrics, we lack the ability to pinpoint data from any particular website. But perhaps even more challenging is analyzing the data once collected and drawing actionable conclusions. In the future we’ll talk more about these challenges and how we’re addressing them, but in this post we’d like to share how some of the metrics that are fundamental to how our users experience the browser have improved throughout the year.
Let’s start with page load. First Contentful Paint (FCP) is a better metric for felt performance than the `onload` event. We’re tracking the time it takes between receiving the first byte from the network to FCP. This tells us how much faster we are giving feedback to the user that the page is successfully loading, so it’s a critical metric for understanding the user experience. While much of this is up to web pages themselves, if the browser improves performance across the board, we expect this number to go down.
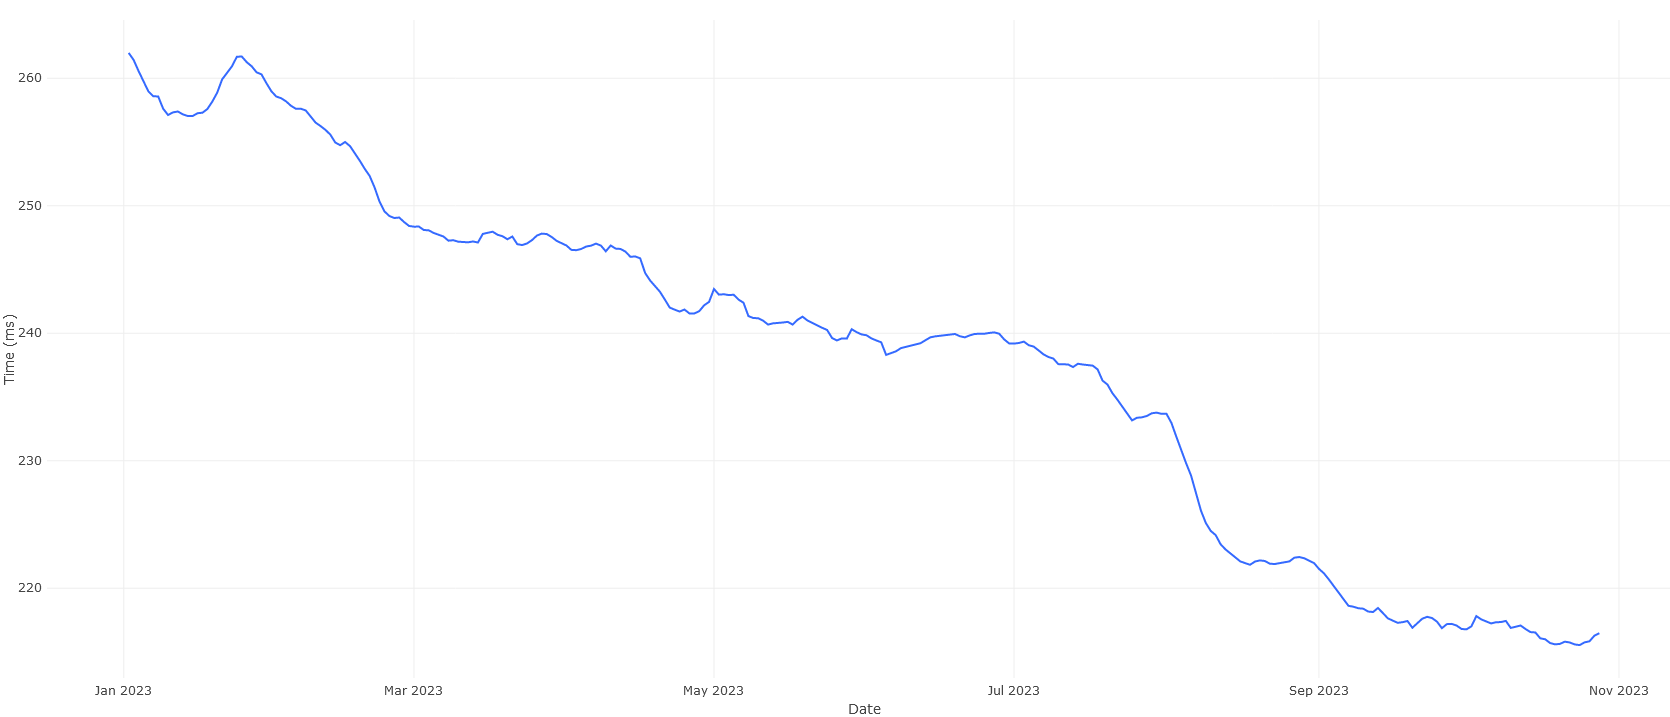
Image 1 – Median time from Response Start to First Contentful Paint in milliseconds
We can see that this time improved from roughly 250ms at the start of the year to 215ms in October. This means that a user receives feedback on page loads almost 15% faster than they did at the start of the year. And it’s important to note that this is all the result of optimization work that didn’t even explicitly target pageload.
In order to understand where this improvement is coming from, let’s look at another piece of timing data: the amount of time that was spent executing JavaScript code during a pageload. Here we are going to look at the 95th percentile, representing the most JS heavy pages and highlighting a big opportunity for us to remove friction for users.
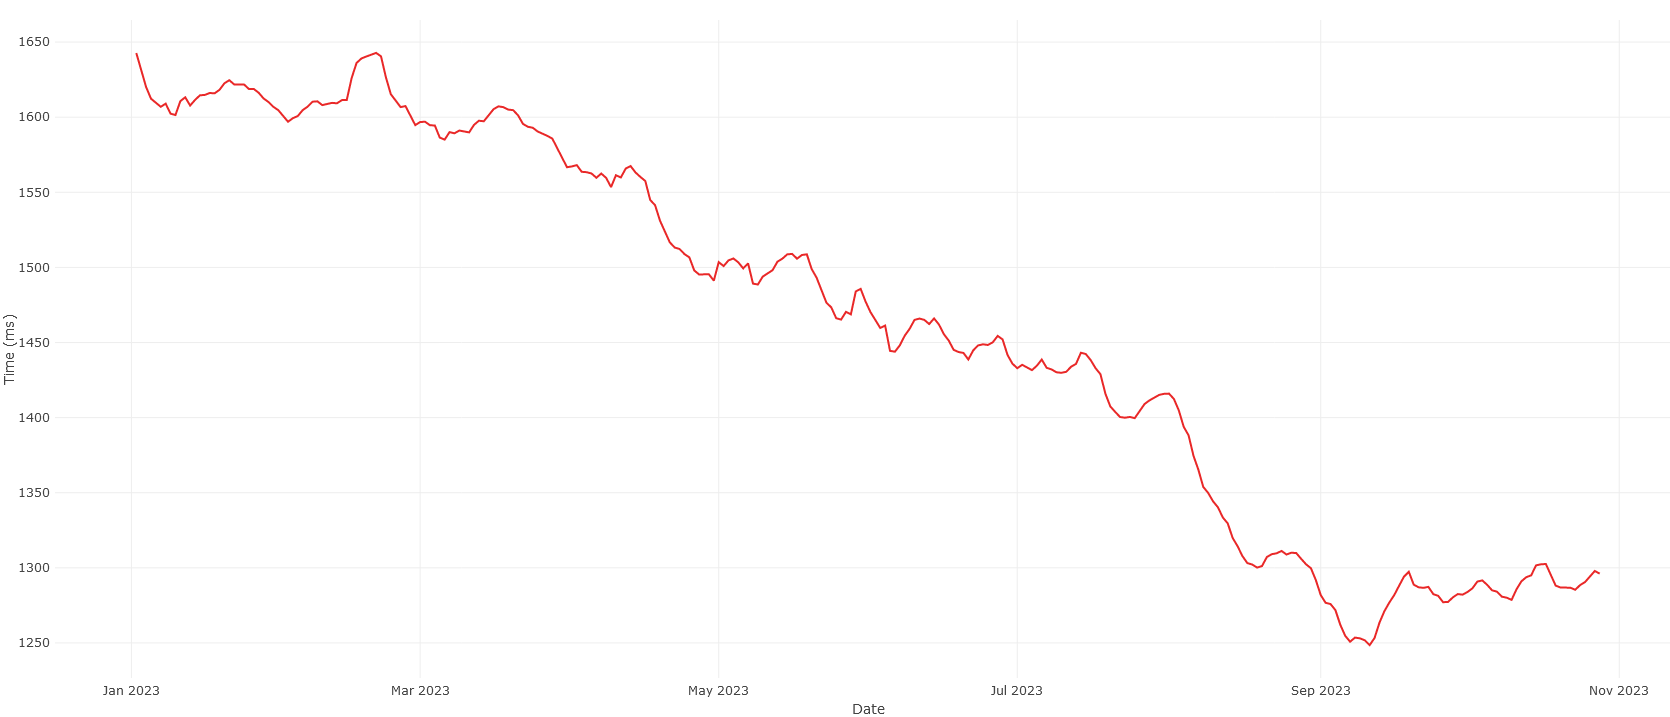
Image 2 – 95th Percentile of JS execution time during pageload in milliseconds
This shows the 95th percentile improving from ~1560ms at the beginning of the year, to ~1260ms in October. This represents a considerable improvement of 300ms, or almost 20%, and is likely responsible for a significant portion of the reduced FCP times. This makes sense, since Speedometer 3 work has led to significant optimizations to the SpiderMonkey JavaScript engine (a story for another post).
We’d also like to know how responsive pages are after they are loaded. For example, how smooth is the response when typing on the keyboard as I write this blogpost! The primary metric we collect here is the “keypress present latency”; the time between a key being pressed on the keyboard and its result being presented onto the screen. Rendering some text to the screen may sound simple, but there’s a lot going on to make that happen – especially when web pages run main thread JavaScript to respond to the keypress event. Most typing is snappy and primarily limited by hardware (e.g. the refresh rate of the monitor), but it’s extremely disruptive when it’s not. This means it’s important to mitigate the worst cases, so we’ll again look at the 95th percentile.
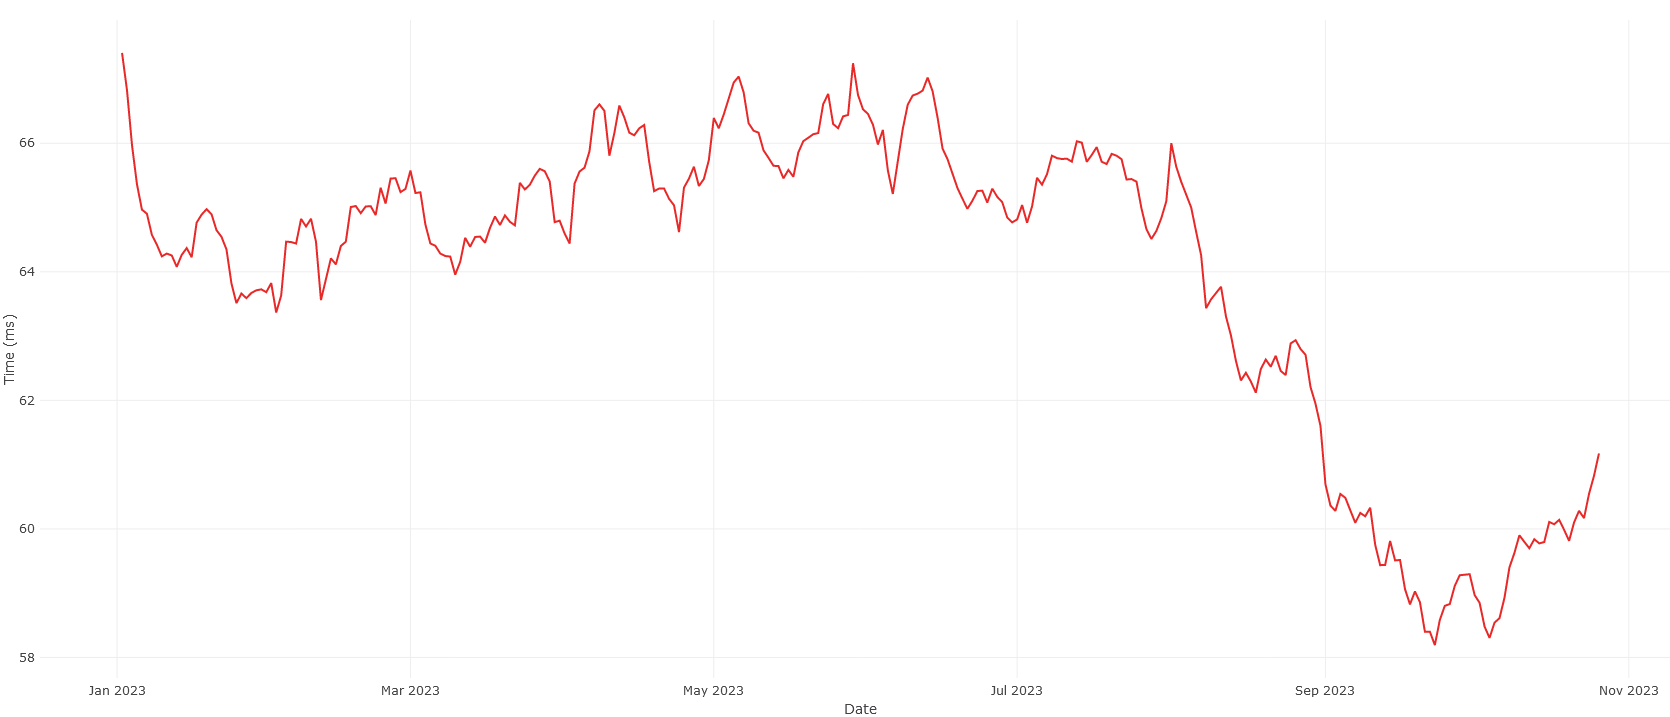
Image 3 – 95th Percentile of the keypress present latency
Once again we see a measurable improvement. The 95th percentile hovered around 65ms for most of the year and dropped to under 59ms after the Firefox 116 and 117 releases in August. A 10% improvement to the slowest keypresses means users are experiencing more instantaneous feedback and fewer disruptions while typing.
We’ve been motivated by the improvements we’re seeing in our telemetry data, and we’re convinced that our efforts this year are having a positive effect on Firefox users. We have many more optimizations in the pipeline and will share more details about those and our overall progress in future posts.