
Tom Mitchell’s classic 1997 book “Machine Learning” provides a chapter dedicated to statistical methods for evaluating machine learning models.
Statistics provides an important set of tools used at each step of a machine learning project. A practitioner cannot effectively evaluate the skill of a machine learning model without using statistical methods. Unfortunately, statistics is an area that is foreign to most developers and computer science graduates. This makes the chapter in Mitchell’s seminal machine learning text an important, if not required, reading by practitioners.
In this post, you will discover statistical methods recommended by Mitchel to evaluate and compare machine learning models.
After reading this post, you will know:
- How to calculate confidence intervals for classification accuracy or error.
- The statistical foundation for calculating confidence intervals.
- How to generally compare the performance of machine learning algorithms.
Kick-start your project with my new book Statistics for Machine Learning, including step-by-step tutorials and the Python source code files for all examples.
Let’s get started.

Statistics for Evaluating Machine Learning Models
Photo by Pierre (Rennes), some rights reserved.
Machine Learning Book
Tom Mitchell wrote what might be the classic textbook on applied machine learning, titled “Machine Learning” and released in 1997.
In the book he dedicated an entire chapter to the statistical methods required to evaluate machine learning models and algorithms. Specifically, Chapter 5 titled “Evaluating Hypotheses“.
Chapter 5 presents basic concepts from statistics and estimation theory, focusing on evaluating the accuracy of hypotheses using limited samples of data. This includes the calculation of confidence intervals for estimating hypothesis accuracy and methods for comparing the accuracy of learning methods.
— Page 16, Machine Learning, 1997.
In this post, we are going to take a closer look at this chapter and review the statistical methods recommended by Mitchell at that time. The fundamentals of statistical methods do not change and may be just as useful and relevant now, 20 years since the publication of the book.
It is important to note that when Mitchell refers to hypotheses, he is referring to learned models, the results of running a learning algorithm on a dataset. Evaluating and comparing hypotheses means comparing learned models, which is different from evaluating and comparing machine learning algorithms, which could be trained on different samples from the same problem or different problems.
Chapter 5 on evaluating hypotheses is divided into 7 parts; they are as follows:
- 5.1. Motivation
- 5.2. Estimating Hypothesis Accuracy
- 5.3. Basics of Sampling Theory
- 5.4. A General Approach for Deriving Confidence Intervals
- 5.5. Difference in Error of Two Hypotheses
- 5.6. Comparing Learning Algorithms
- 5.7. Summary and Further Reading
We will spend time looking at each section and summarize the statistical methods and recommendations made.
Need help with Statistics for Machine Learning?
Take my free 7-day email crash course now (with sample code).
Click to sign-up and also get a free PDF Ebook version of the course.
Motivation
The chapter starts off by stating the importance of evaluating hypotheses in machine learning.
Empirically evaluating the accuracy of hypotheses is fundamental to machine learning.
— Page 128, Machine Learning, 1997.
The chapter is motivated by three questions; they are:
- Given the observed accuracy of a hypothesis over a limited sample of data, how well does this estimate its accuracy over additional examples?
- Given that one hypothesis outperforms another over some sample of data, how probable is it that this hypothesis is more accurate in general?
- When data is limited, what is the best way to use this data to both learn a hypothesis and estimate its accuracy?
All three questions are closely related.
The first question raises concerns over errors in the estimate of model skill and motivates the need for confidence intervals.
The second question raises concerns about making decisions based on model skill on small samples and motivates statistical hypothesis testing.
And finally, the third question considers the economical use of small samples and motivates resampling methods such as k-fold cross-validation.
This chapter discusses methods for evaluating learned hypotheses, methods for comparing the accuracy of two hypotheses, and methods for comparing the accuracy of two learning algorithms when only limited data is available.
— Page 129, Machine Learning, 1997.
The motivation closes with a reminder of the difficulty of estimating the skill of a hypothesis. Specifically the introduction of bias and variance in the estimate of the skill of a model:
- Bias in the estimate. When the model is evaluated on training data, overcome by evaluating the model on a hold out test set.
- Variance in the estimate. When the model is evaluated on an independent test set, overcome by using larger tests sets.
Estimating Hypothesis Accuracy
The skill or prediction error of a model must be estimated, and as an estimate, it will contain error.
This is made clear by distinguishing between the true error of a model and the estimated or sample error.
One is the error rate of the hypothesis over the sample of data that is available. The other is the error rate of the hypothesis over the entire unknown distribution D of examples.
— Page 130, Machine Learning, 1997.
- Sample Error. Estimate of true error calculated on a data sample.
- True Error. Probability that a model will misclassify a randomly selected example from the domain.
We want to know the true error, but we must work with the estimate, approximated from a data sample. This raises the question of how good is a given estimate of error?
One approach is to calculate a confidence interval around the sample error that is large enough to cover the true error with a very high likelihood, such as 95%.
Assuming that the error measure is a discrete proportion, such as classification error, the calculation of the confidence interval is calculated as follows:
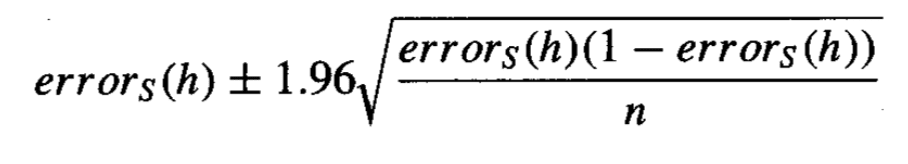
Calculation of Confidence Interval for Classification Error
Taken from Machine Learning, 1997.
Where error_s is the sample error, n is the total number of instances in the test set used to calculate the sample error and 1.96 is the critical value from the Gaussian distribution for a likelihood of 95%.
Basics of Sampling Theory
The equation to calculate the confidence interval from the previous section makes many assumptions.
This section works through these assumptions in order to provide a basis of understanding for the calculation.
This section introduces basic notions from statistics and sampling theory, including probability distributions, expected value, variance, Binomial and Normal distributions, and two-sided and one-sided intervals.
— Page 132, Machine Learning, 1997.
Usefully, a table is provided that summarizes the key concepts of this section, provided below.

Summary of Key Statistical Concepts for Calculating a Confidence Interval
Taken from Machine Learning, 1997.
This section provides an important statistical foundation for the confidence interval and is recommended reading.
To save repeating all of this theory, the crux of the section is as follows:
- Proportional values like classification accuracy and classification error fit a Binomial distribution.
- The Binomial distribution characterizes the probability of a binary event, such as a coin flip or a correct/incorrect classification prediction.
- The mean is the expected value in the distribution, the variance is the average distance that samples have from the mean, and the standard deviation is the variance normalized by the size of the data sample.
- Ideally, we seek an unbiased estimate of our desired parameter that has the smallest variance.
- Confidence intervals provide a way to quantify the uncertainty in a population parameter, such as a mean.
- The Binomial distribution can be approximated with the simpler Gaussian distribution for large sample sizes, e.g. 30 or more observations.
- The interval can be centered on the mean called two-sided, but can also be one-sided, such as a radius to the left or right of the mean.
A General Approach for Deriving Confidence Intervals
Given the equation to calculate the confidence intervals for proportional values and the statistical reasoning behind the equation, a general procedure is presented to calculate confidence intervals.
The procedure is summarized below.
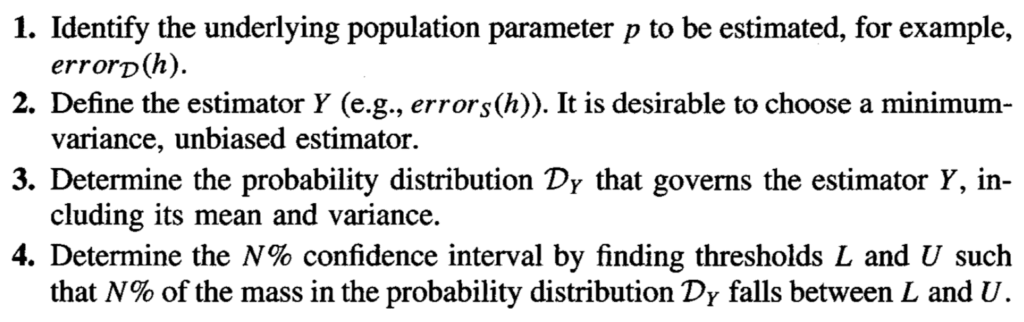
General Procedure for Calculating Confidence Intervals
Taken from Machine Learning, 1997.
The central limit theorem is also presented. It can be summarized by the finding that the sum (or normalized sum in the case of the mean) of independent observations will represent a sample from a Gaussian distribution. For example, the mean skill of a model on different independent data samples will be Gaussian.
This is an invaluable finding as we know so much about the Gaussian and can comment on the likelihood of two samples (mean values) belonging to the same or different Gaussian distributions, such as in the case of the skill of machine learning algorithms.
The Central Limit Theorem is a very useful fact because it implies that whenever we define an estimator that is the mean of some sample (e.g., errors(h) is the mean error), the distribution governing this estimator can be approximated by a Normal distribution for sufficiently large n.
— Page 143, Machine Learning, 1997.
Difference in Error of Two Hypotheses
This section looks at applying the general procedure for calculating confidence intervals to the estimated difference in classification error between two models.
The approach assumes that each model was trained on a different independent sample of the data. Therefore, the calculation of the confidence interval in the difference in error between the two models adds the variance from each model.
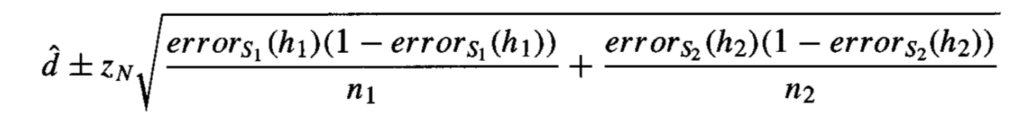
Confidence Interval for the Difference in Error Between Two Models
Taken from Machine Learning, 1997.
This section also introduces the idea of statistical hypothesis testing as an alternative to calculating confidence intervals.
In some cases we are interested in the probability that some specific conjecture is true, rather than in confidence intervals for some parameter.
— Page 145, Machine Learning, 1997.
Interestingly, the topic is motivated by the likelihood of a one-sided confidence interval containing the true estimate of error for a model in order to determine the probability of one model being better than another.
I found this explanation less clear than it should have been.
Comparing Learning Algorithms
This final content section of the chapter focuses on the comparison of machine learning algorithms.
This is different from comparing models (hypotheses) as comparing algorithms involves training them and evaluating them potentially on multiple different samples of data from the domain.
The comparison of two algorithms is motivated by estimating the expected or mean difference between the two methods. A procedure is presented that uses k-fold cross-validation where each algorithm is trained and evaluated on the same splits of the data. A final mean difference in error is calculated, from which a confidence interval can be estimated.
The calculation of the confidence interval is updated to account for the reduced number of degrees of freedom as each algorithm is evaluated on the same test set.
The paired Student’s t-test is introduced as a statistical hypothesis test for quantifying the likelihood that two means belong to the same (or different) distributions. This test can be used with the outlined procedure, but only if each train and test set contain independent samples, a fact that is not the case with default k-fold cross-validation.
In particular, in this idealized method we modify the procedure of Table 5.5 so that on each iteration through the loop it generates a new random training set Si and new random test set Ti by drawing from this underlying instance distribution instead of drawing from the fixed sample Do
— Page 148, Machine Learning, 1997.
The section ends by outlining practical considerations when comparing machine learning algorithms.
Mitchell reminds us that the Student’s t-test does not technically apply in the case where we use resampling methods. Nevertheless, he recommends using k-fold cross-validation or random sampling in order to estimate the variance in the estimate of model error, as they are the only methods available.
This is less than ideal as the expectations of the statistical test will be violated, increasing type I errors.
It is wise to keep in mind that statistical models rarely fit perfectly the practical constraints in testing learning algorithms when available data is limited. Nevertheless, they do provide approximate confidence intervals that can be of great help in interpreting experimental comparisons of learning methods.
— Page 150, Machine Learning, 1997.
Summary and Further Reading
The chapter ends with a summary of the main points hit, exercises that can be completed to confirm an understanding of the equations, and a great list of references and further reading.
Briefly, the main points are:
- Confidence intervals can be used to quantify the uncertainty in model error.
- The calculation of the confidence intervals importantly depends on the distribution of the quantity being estimated.
- A cause of errors in the evaluation of model skill is estimation bias, evaluating a model on the training dataset will introduce an optimistic bias.
- Another cause of errors in the evaluation of model skill is estimation variance, which can be decreased by increasing the hold out test size.
- Resampling with the k-fold cross-validation procedure provides an effective way to compare machine learning algorithms.
- When using statistical methods, we must make assumptions, such as assumptions around the distribution of parameters. Even with confidence intervals, we don’t know what is true, just what is likely.
Interestingly, two technical reports by Thomas Dietterich are referenced. Dietterich went on to publish the important 1998 paper titled “Approximate Statistical Tests for Comparing Supervised Classification Learning Algorithms” that describes the unreliability of the paired Student’s t-test when comparing machine learning algorithms with random resampling and k-fold cross-validation.
Further Reading
This section provides more resources on the topic if you are looking to go deeper.
- Machine Learning, 1997.
- Tom Mitchell Homepage
- Tom M. Mitchell on Wikipedia
- Thomas Dietterich on Wikipedia
- Approximate Statistical Tests for Comparing Supervised Classification Learning Algorithms, 1998.
Summary
In this post, you discovered statistical methods to evaluate and compare machine learning models.
Specifically, you learned:
- How to calculate confidence intervals for classification accuracy or error.
- The statistical foundation for calculating confidence intervals
- How to generally compare the performance of machine learning algorithms.
Do you have any questions?
Ask your questions in the comments below and I will do my best to answer.
Get a Handle on Statistics for Machine Learning!

Develop a working understanding of statistics
...by writing lines of code in python
Discover how in my new Ebook:
Statistical Methods for Machine Learning
It provides self-study tutorials on topics like:
Hypothesis Tests, Correlation, Nonparametric Stats, Resampling, and much more...
Discover how to Transform Data into Knowledge
Skip the Academics. Just Results.


 for Evaluating GANs")
 for Evaluating GANs")

Nice! I consider this a really important topic that is sometimes overlooked.
A Bayesian approach to this topic would be really interesting…do you know any reference about it?
Thanks Peter.
Not off-hand, try a search on scholar.google.com
Hi Jason,
Thank you for writing this nice post. Are you considering writing a blog post about statistical tests for comparing machine learning models with concrete Python examples (or a case study)?
Best,
Elie
Yes, I have some written and scheduled.
Thanks for the informative article, I just have a couple questions:
Firstly, can the methods in this post be used to evaluate regression algorithms rather than classification? What’s the best way to make confidence intervals and to compare algorithms when it comes to regression with limited data?
My second question is: Regarding the comparison of algorithms, if I understand correctly, you’re saying that this method is the only way to estimate variance of model error but that this method breaks assumptions and is unreliable. So what then do you recommend doing to compare algorithms?
Here are the portions of your post I’m referring to:
– “Mitchell reminds us that the Student’s t-test does not technically apply in the case where we use resampling methods. Nevertheless, he recommends using k-fold cross-validation or random sampling in order to estimate the variance in the estimate of model error, as they are the only methods available.”
– “…unreliability of the paired Student’s t-test when comparing machine learning algorithms with random resampling and k-fold cross-validation.”
Thanks
The methods are focused on classification models and are not suitable for regression.
I have many examples of calculating confidence intervals generally, perhaps start here:
https://machinelearningmastery.com/confidence-intervals-for-machine-learning/
More on comparing algorithms here, you can use the 5×2 and Student’s t-test for comparing error (MSE/RMSE) for regression algorithms.
https://machinelearningmastery.com/statistical-significance-tests-for-comparing-machine-learning-algorithms/
Hi Jason,
I’m curious how you would extend this approach to 1) non-necessarily-normal test statistics (e.g. something like AUC or a more complex ranking metric), and 2) a two-model comparison.
This seems like it should be a common setting when comparing two models when the normal approximation doesn’t hold, but I haven’t found much in the way of resources on this topic.
Thanks!
Great question!
I’d recommend this:
https://machinelearningmastery.com/statistical-significance-tests-for-comparing-machine-learning-algorithms/
Thanks for the pointer. My understanding is that the linked post and the Dietterich paper are focused on testing algorithms, rather than models. However, I’m curious if there is an approach which would work when you want to know which model is better, even if they came from the same algorithm (cases 3 and 4 in the Dietterich paper, I think).
Thanks!
Evan
Yes.
Comparing different algorithms vs different algorithm configs the same thing, e.g. comparing sample means to discover which algorithm/config performs best.