How to Install TIG Stack (Telegraf, InfluxDB, and Grafana) on Rocky Linux
On this page
- Prerequisites
- Step 1 - Configure Firewall
- Step 2 - Install InfluxDB
- Step 3 - Create InfluxDB Database and User Credentials
- Step 4 - Install Telegraf
- Step 5 - Verify if Telegraf stats are being stored in InfluxDB
- Step 6 - Install Grafana
- Step 7 - Set up Grafana Data Source
- Step 8 - Set up Grafana Dashboards
- Step 9 - Configure Alerts and Notifications
- Conclusion
The TIG (Telegraf, InfluxDB and Grafana) Stack is an acronym for a platform of open-source tools to make the collection, storage, graphing and alerting of system metrics easier. You can monitor and visualize metrics such as memory, disk space, logged-in users, system load, swap usage, uptime, running processes etc. from one place. The tools used in the stack are as follows:
- Telegraf - is an open-source metrics collection agent for collecting and sending data and events from databases, systems and IoT sensors. It supports various output plugins such as InfluxDB, Graphite, Kafka, etc to which it can send the collected data.
- InfluxDB - is an open-source time-series database written in the Go language. It is optimized for fast, high-availability storage and is suitable for anything involving large amounts of time-stamped data, including metrics, events and real-time analytics.
- Grafana - is an open-source data visualization and monitoring suite. It supports various input plugins such as Graphite, ElasticSearch, InfluxDB, etc. It provides a beautiful dashboard and metric analytics, allowing you to visualize and monitor any kind of system metrics and performance data.
In this tutorial, you will learn how to install and configure the TIG Stack on a single Rocky Linux 8 based server.
Prerequisites
-
A server running Rocky Linux 8.
-
A non-sudo user with root privileges.
-
SELinux Disabled.
-
Ensure that everything is updated.
$ sudo dnf update
Step 1 - Configure Firewall
The first step is to configure the firewall. Rocky Linux comes with the Firewalld firewall.
Check if the firewall is running.
$ sudo firewall-cmd --state
You should get the following output.
running
Check the current allowed services/ports.
$ sudo firewall-cmd --permanent --list-services
It should show the following output.
cockpit dhcpv6-client ssh
Allow 8086 port to run InfluxDB and 3000 port to run Grafana Server.
$ sudo firewall-cmd --permanent --add-port=8086/tcp
$ sudo firewall-cmd --permanent --add-port=3000/tcp
Reload the firewall.
$ sudo systemctl reload firewalld
Step 2 - Install InfluxDB
To install InfluxDB, first, you need to create a repo file for it.
Create and open the influxdb.repo file for editing.
$ sudo nano /etc/yum.repos.d/influxdb.repo
Paste the following code in it.
[influxdb]
name = InfluxDB Repository - RHEL $releasever
baseurl = https://repos.influxdata.com/rhel/$releasever/$basearch/stable
enabled = 1
gpgcheck = 1
gpgkey = https://repos.influxdata.com/influxdb.key
Save the file by pressing Ctrl + X and entering Y when prompted.
You have the option of installing InfluxDB 1.8.x or 2.0.x. However, it is better to use the latest version. Install InfluxDB.
$ sudo dnf install influxdb2
Start and Enable the InfluxDB service.
$ sudo systemctl enable influxdb
$ sudo systemctl start influxdb
Step 3 - Create InfluxDB Database and User Credentials
To store the data from Telegraf, you need to set up the Influx database and user.
InfluxDB comes with a command-line tool named influx for interacting with the InfluxDB server. Think of influx as the mysql command-line tool.
Run the following command to perform the initial configuration for Influx.
$ influx setup
> Welcome to InfluxDB 2.0!
? Please type your primary username navjot
? Please type your password ***************
? Please type your password again ***************
? Please type your primary organization name howtoforge
? Please type your primary bucket name tigstack
? Please type your retention period in hours, or 0 for infinite 360
? Setup with these parameters?
  Username:          navjot
  Organization:      howtoforge
  Bucket:            tigstack
  Retention Period:  360h0m0s
 Yes
> Config default has been stored in /home/username/.influxdbv2/configs.
User    Organization    Bucket
navjot  howtoforge      tigstack
You need to set up your initial username, password, organization name, the primary bucket name to store data and retention period in hours for that data.
You can also perform this setup by launching the URL http://<serverIP>:8086/ in your browser. Once you have performed the initial setup, you can log in to the URL.
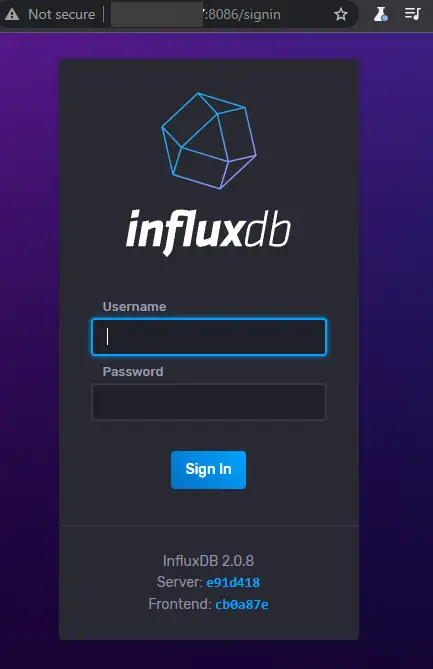
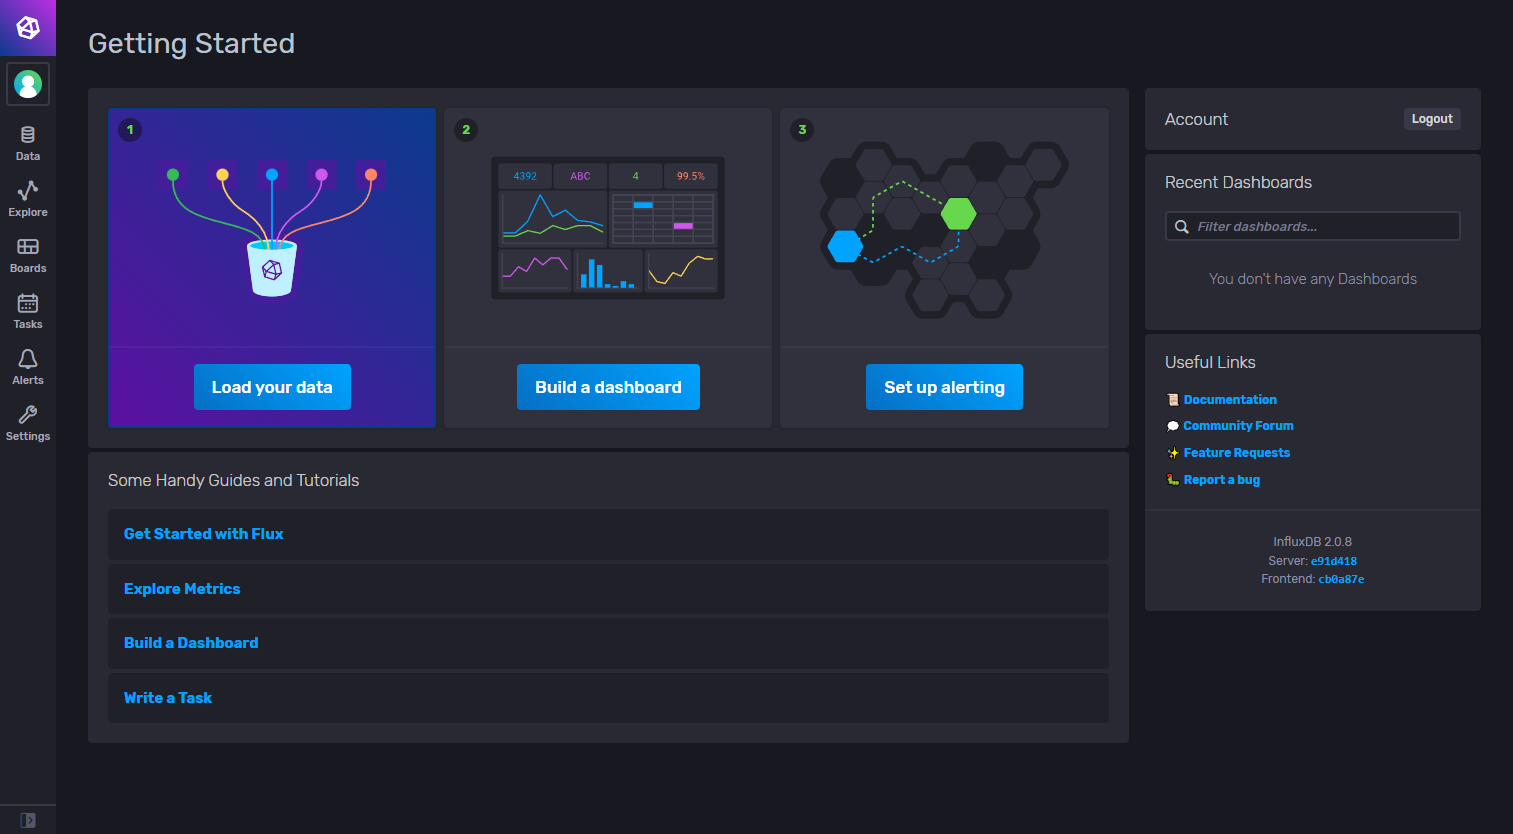
You should be greeted with the following dashboard.
The initial setup process creates a default token that has full read and write access to all the organizations in the database. You need a new token for security purposes which will only connect to the organization and bucket we want to connect to.
To create a new token, click on the Data option from the left sidebar. Next, click on the Tokens section.
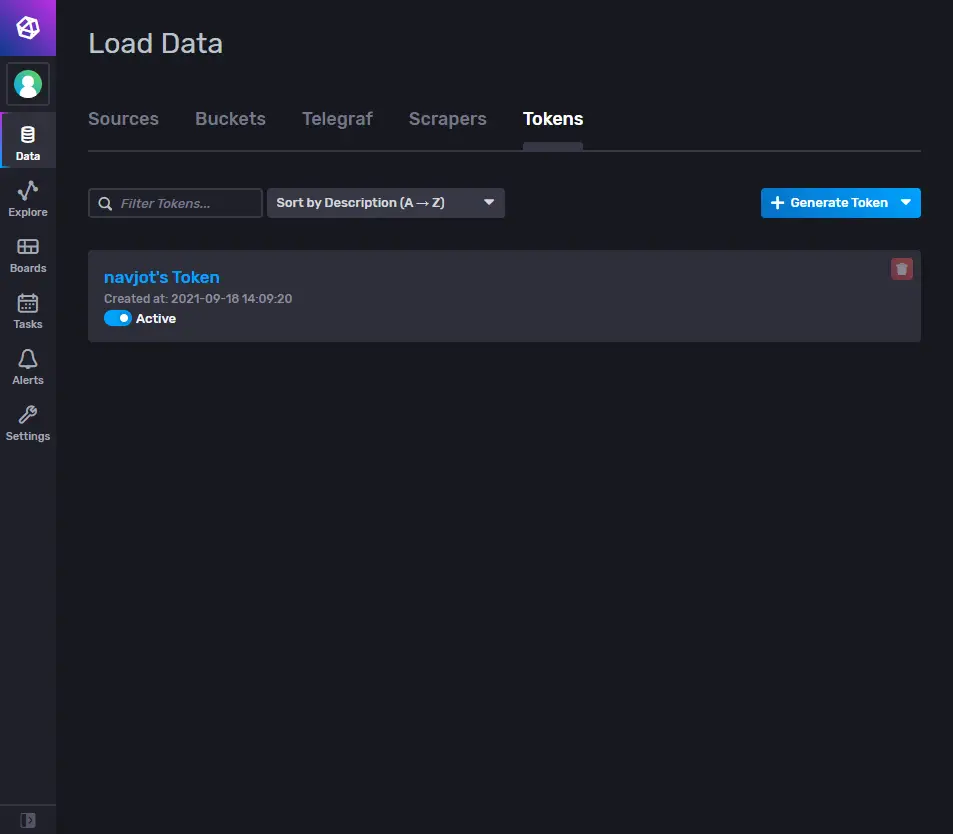
Here, you will see the default token that we created at the time of the initial configuration. Click on the Generate Token button and select the Read/Write Token option to launch a new overlay popup.
Give a name to the Token and select the default bucket we created under both Read and Write sections.
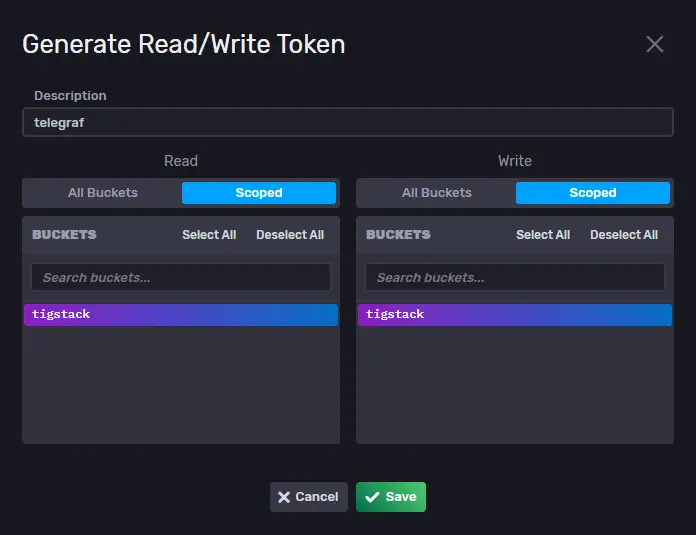
Click Save to finish creating the token. Click on the name of the newly created token to reveal a popup with the token value. Save it for now since we will need it later on.
This completes the installation and configuration of InfluxDB. Next, we need to install Telegraf.
Step 4 - Install Telegraf
Telegraf and InfluxDB share the same repository. It means you can install Telegraf directly.
$ sudo dnf install telegraf
Enable and Start the Telegraf service.
$ sudo systemctl enable telegraf
$ sudo systemctl start telegraf
Telegraf is a plugin-driven agent and has 4 types of plugins:
- Input plugins collect metrics.
- Processor plugins transform, decorate, and filter metrics.
- Aggregator plugins create and aggregate metrics.
- Output plugins define the destinations where metrics are sent including InfluxDB.
Telegraf stores its configuration for all these plugins in the file /etc/telegraf/telegraf.conf. The first step is to connect Telegraf to InfluxDB by enabling the influxdb_v2 output plugin. Open the file /etc/telegraf/telegraf.conf for editing.
$ sudo nano /etc/telegraf/telegraf.conf
Find the line [[outputs.influxdb_v2]] and uncomment out by removing the # in front of it. Edit out the code below it in the following way.
[[outputs.influxdb_v2]]
  urls = ["http://localhost:8086"]
  token = "$INFLUX_TOKEN"
  organization = "howtoforge"
  bucket = "tigstack"
Paste the InfluxDB token value saved earlier in place of the $INFLUX_TOKEN variable in the code above.
Search for the line INPUT PLUGINS and you will see the following input plugins enabled by default.
# Read metrics about cpu usage
[[inputs.cpu]]
  ## Whether to report per-cpu stats or not
  percpu = true
  ## Whether to report total system cpu stats or not
  totalcpu = true
  ## If true, collect raw CPU time metrics
  collect_cpu_time = false
  ## If true, compute and report the sum of all non-idle CPU states
  report_active = false

# Read metrics about disk usage by mount point
[[inputs.disk]]
  ## By default stats will be gathered for all mount points.
  ## Set mount_points will restrict the stats to only the specified mount points.
  # mount_points = ["/"]

  ## Ignore mount points by filesystem type.
  ignore_fs = ["tmpfs", "devtmpfs", "devfs", "iso9660", "overlay", "aufs", "squashfs"]

[[inputs.diskio]]
....
....

# Get kernel statistics from /proc/stat
[[inputs.kernel]]
  # no configuration


# Read metrics about memory usage
[[inputs.mem]]
  # no configuration

# Get the number of processes and group them by status
[[inputs.processes]]
  # no configuration


# Read metrics about swap memory usage
[[inputs.swap]]
  # no configuration


# Read metrics about system load & uptime
[[inputs.system]]
  ## Uncomment to remove deprecated metrics.
You can configure additional input plugins depending upon your requirement, including Apache Server, Docker containers, Elasticsearch, iptables firewall, Kubernetes, Memcached, MongoDB, MySQL, Nginx, PHP-fpm, Postfix, RabbitMQ, Redis, Varnish, Wireguard, PostgreSQL, etc.
Once you are finished, save the file by pressing Ctrl + X and entering Y when prompted.
Restart the Telegraf service once you have finished applying the changes.
$ sudo systemctl restart telegraf
Step 5 - Verify if Telegraf stats are being stored in InfluxDB
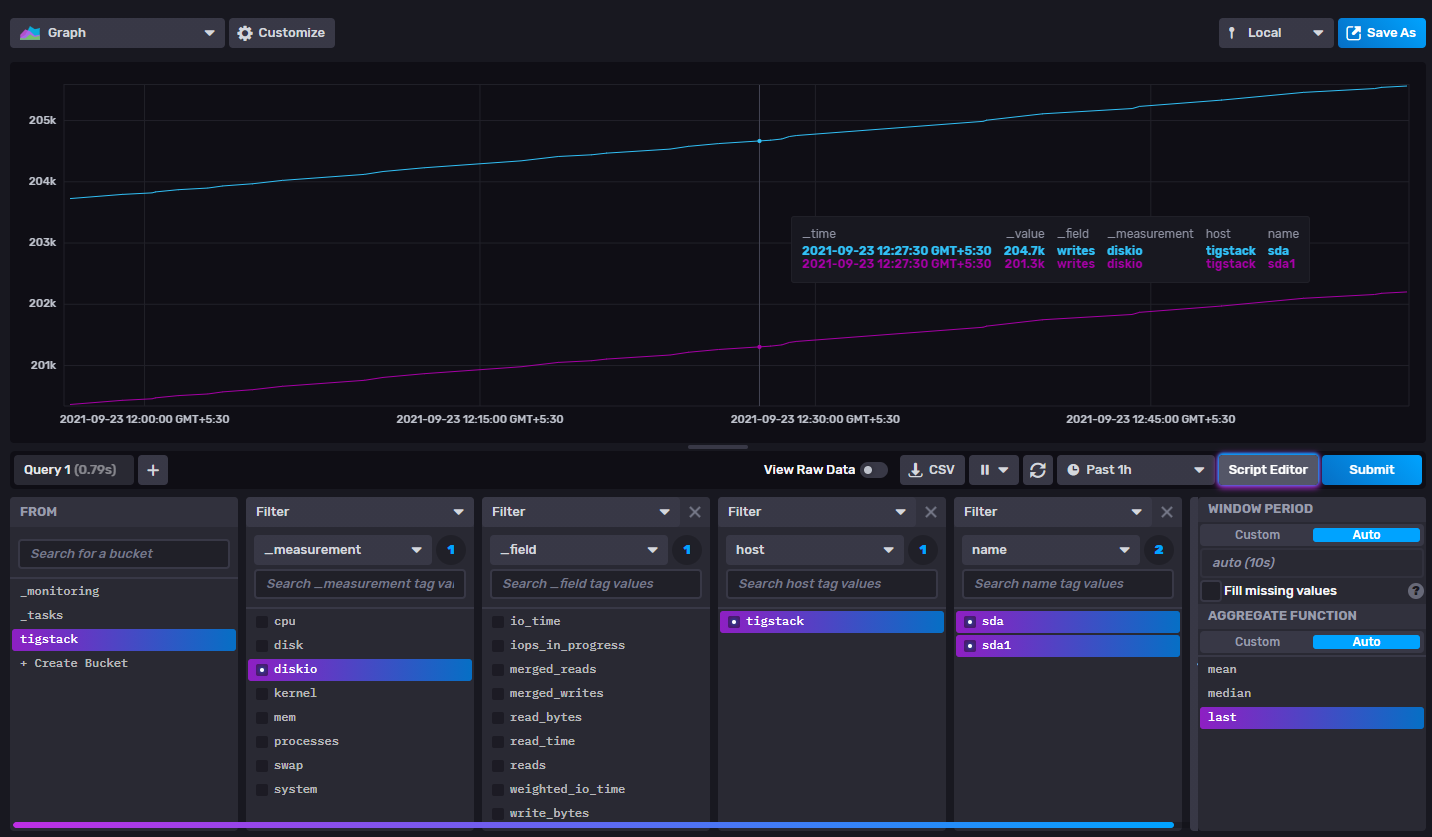
Before proceeding further, you need to verify if Telegraf stats are correctly collected and fed into the InfluxDB. Open the InfluxDB UI in your browser and visit the Data >> Buckets >> tigstack. You should be greeted with the following page.

Click on the bucket name and then click on one of the values in the _measurement filter, and keep clicking on other values as and when they appear. Once you are done, click the Submit button. You should see a graph at the top.
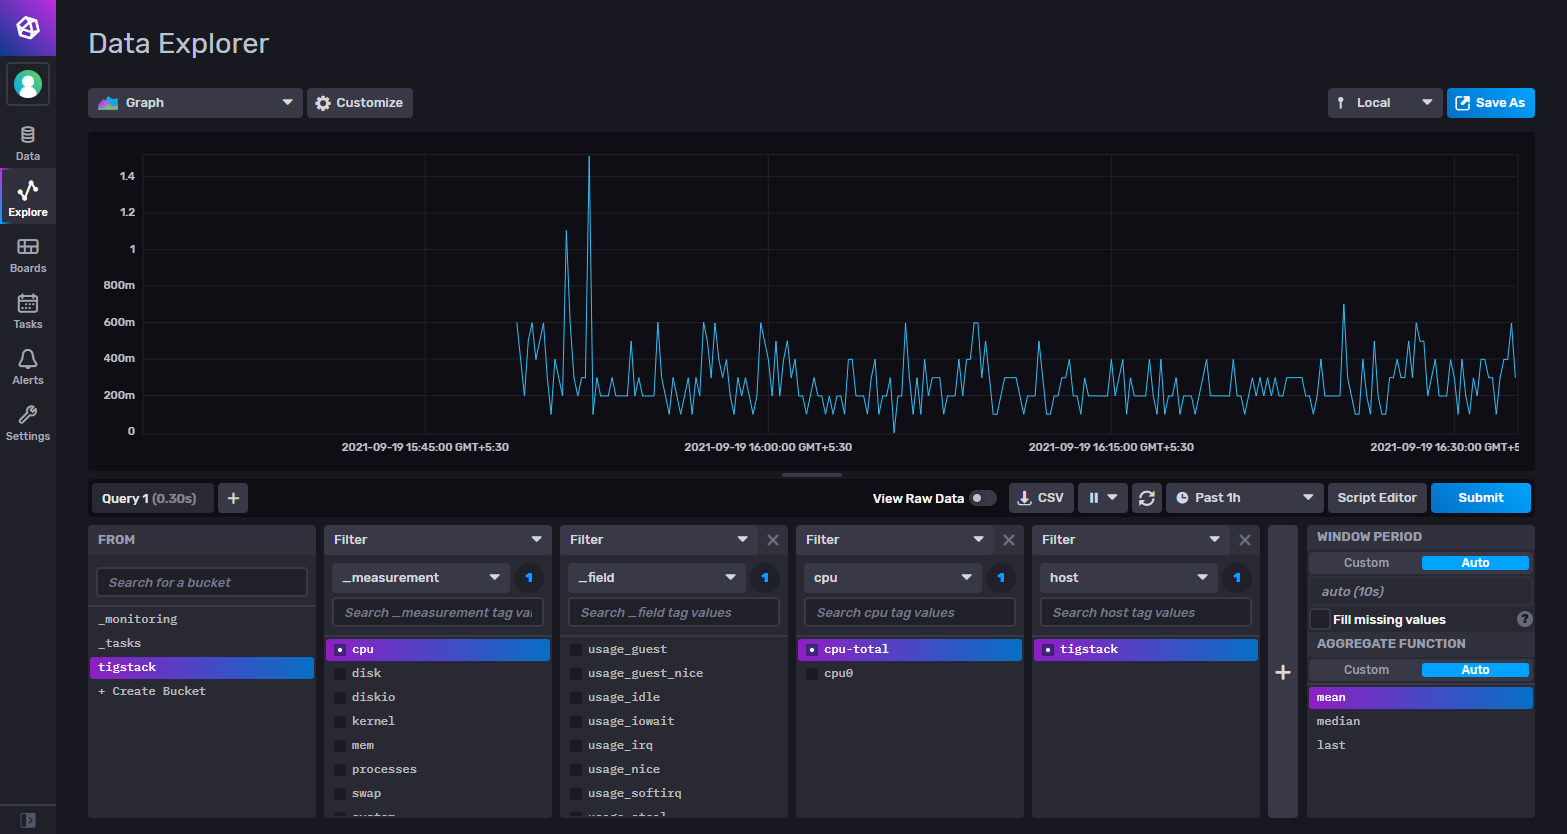
This should confirm that the data is being passed on correctly.
Step 6 - Install Grafana
Create and open the file /etc/yum.repos.d/grafana.repo for editing.
$ sudo nano /etc/yum.repos.d/grafana.repo
Paste the following code in it.
[grafana]
name=grafana
baseurl=https://packages.grafana.com/oss/rpm
repo_gpgcheck=1
enabled=1
gpgcheck=1
gpgkey=https://packages.grafana.com/gpg.key
sslverify=1
sslcacert=/etc/pki/tls/certs/ca-bundle.crt
Save the file by pressing Ctrl + X and entering Y when prompted.
Install Grafana.
$ sudo dnf install grafana
Start and Enable the Grafana service.
$ sudo systemctl start grafana-server
$ sudo systemctl enable grafana-server
Step 7 - Set up Grafana Data Source
Launch the URL http://<serverIP>:3000 in your browser and the following Grafana login page should greet you.
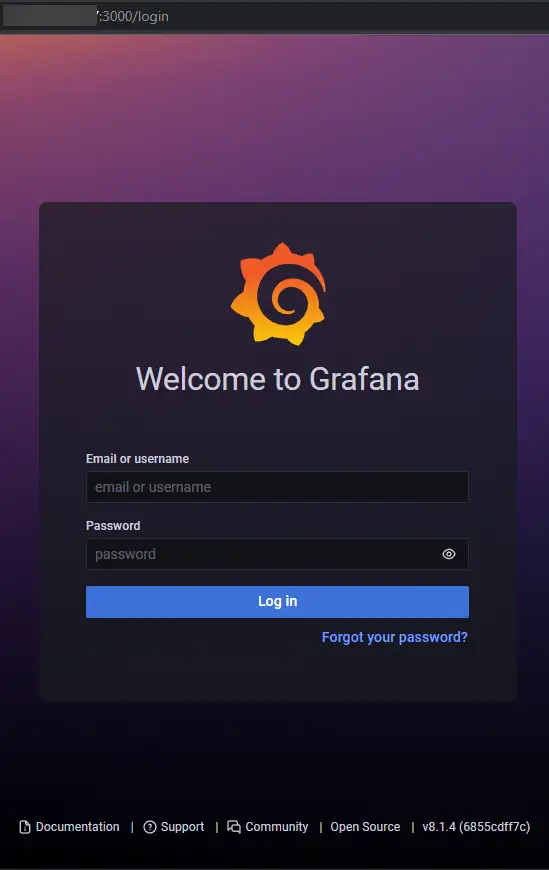
Login with the default username admin and password admin. Next, you need to set up a new default password.

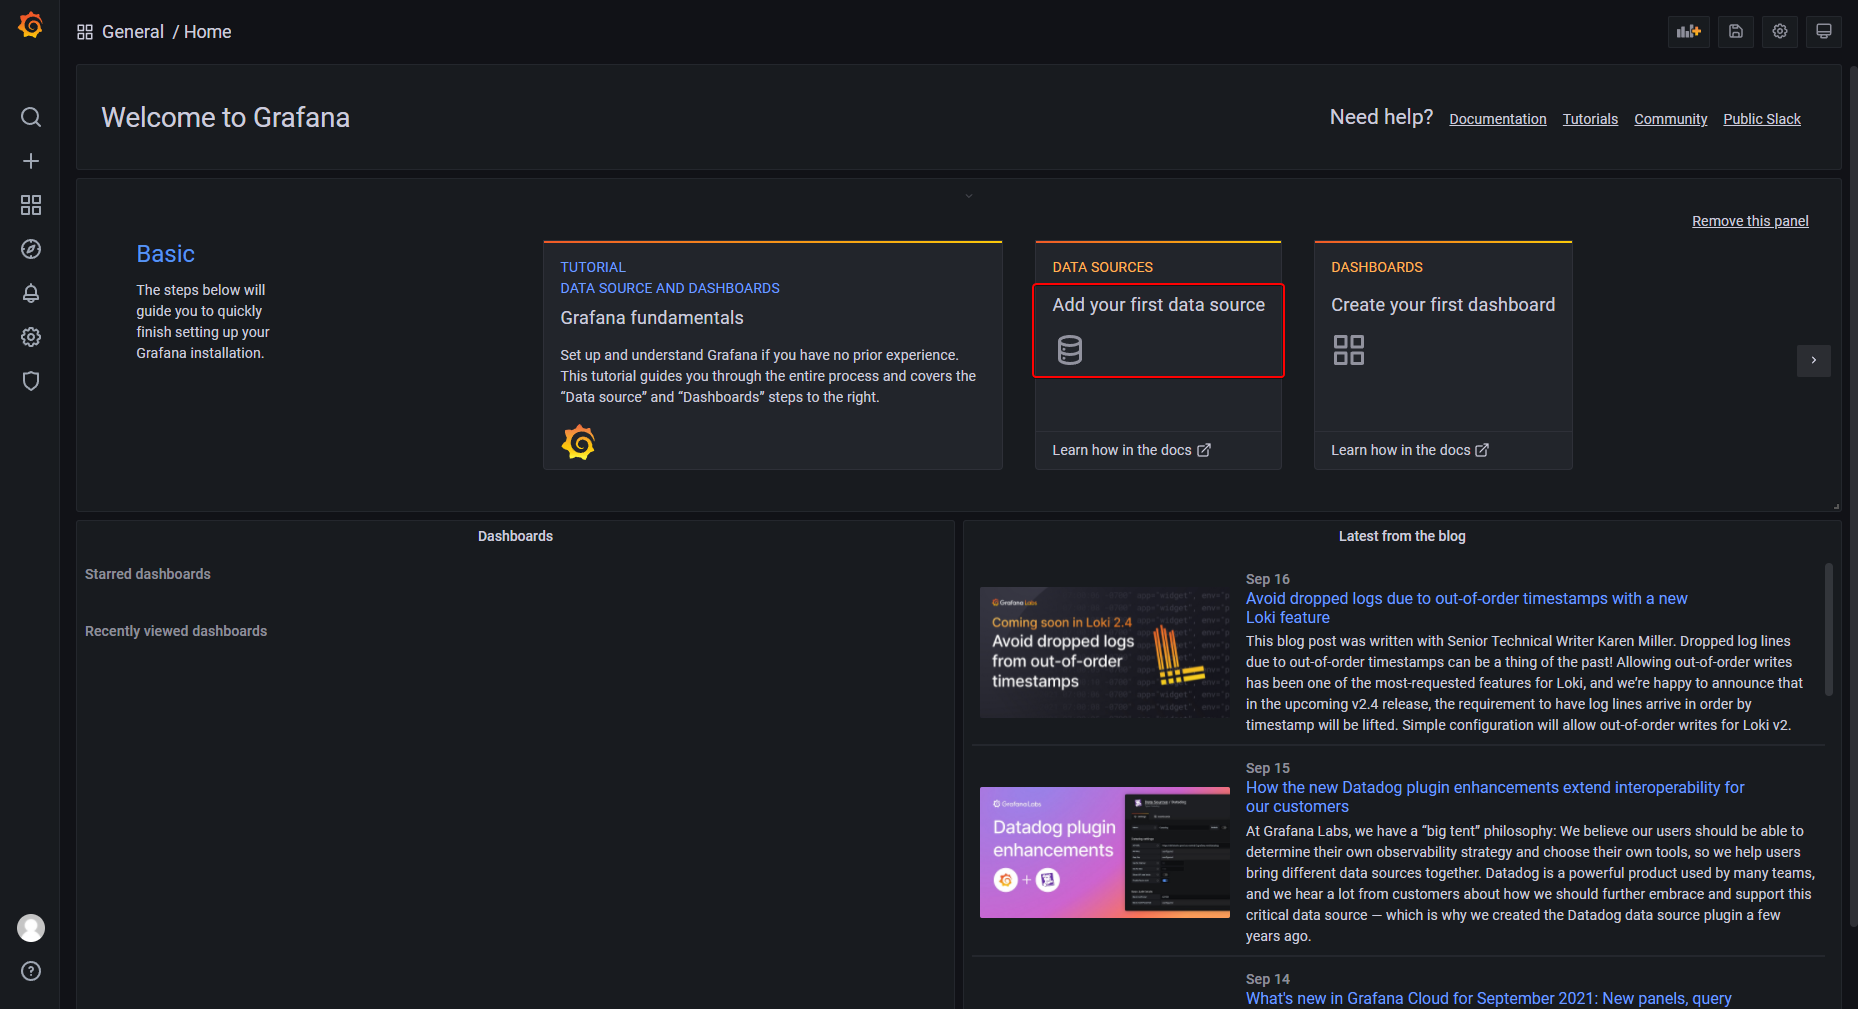
You shall be greeted with the following Grafana homepage. Click on the Add your first data source button.
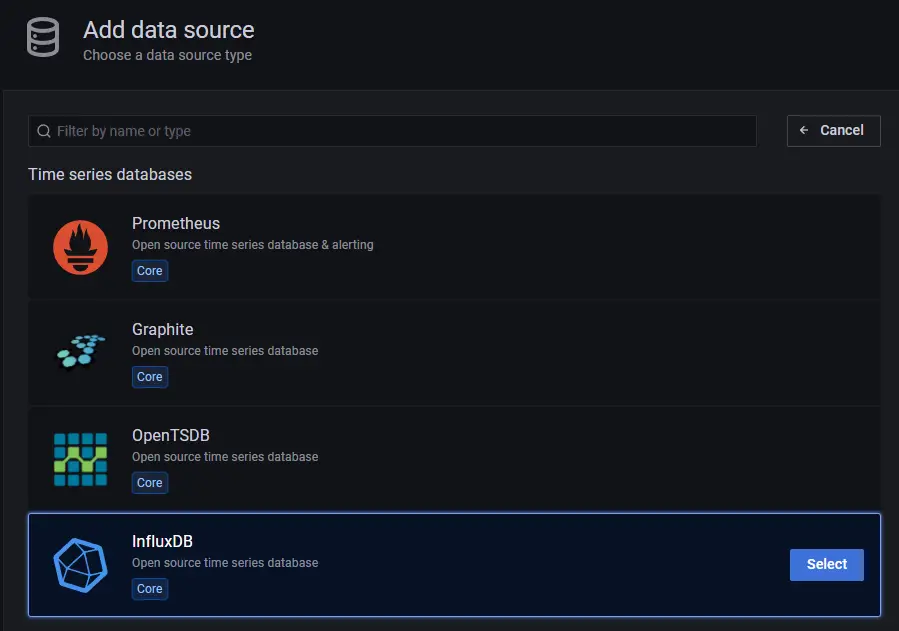
Click the InfluxDB button.
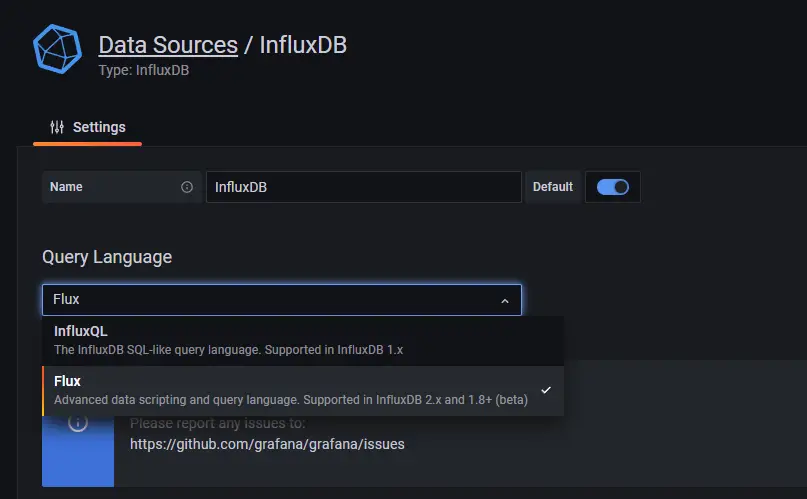
On the next page, select Flux from the dropdown menu as the query language. You can use InfluxQL as the query language, but it is more complicated to configure since it supports only InfluxDB v1.x by default. Flux supports InfluxDB v2.x and is easier to set up and configure.
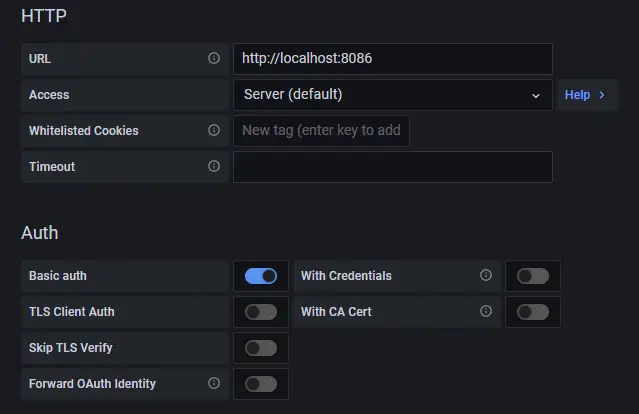
Enter the following values.
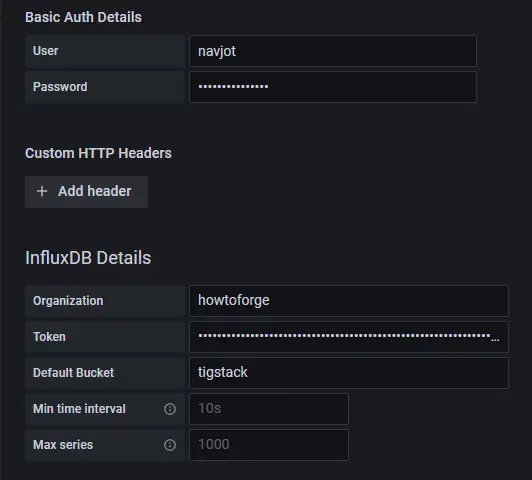
URL: http://localhost:8086 Access: Server Basic Auth Details User: navjot Password:
InfluxDB Details Organization: howtoforge Token:
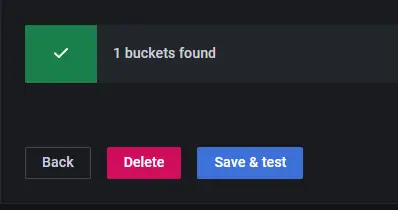
Click on the Save and test button and you should see a confirmation message verifying the setup is successful.
Step 8 - Set up Grafana Dashboards
The next step is to set up Grafana Dashboards. Click on the + sign and select Dashboards to open the Dashboard Create screen.
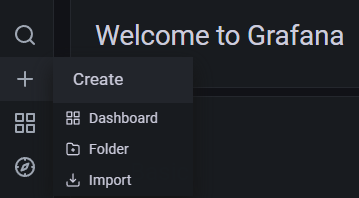
On the next page, click on the Add an empty panel button to launch the following screen.
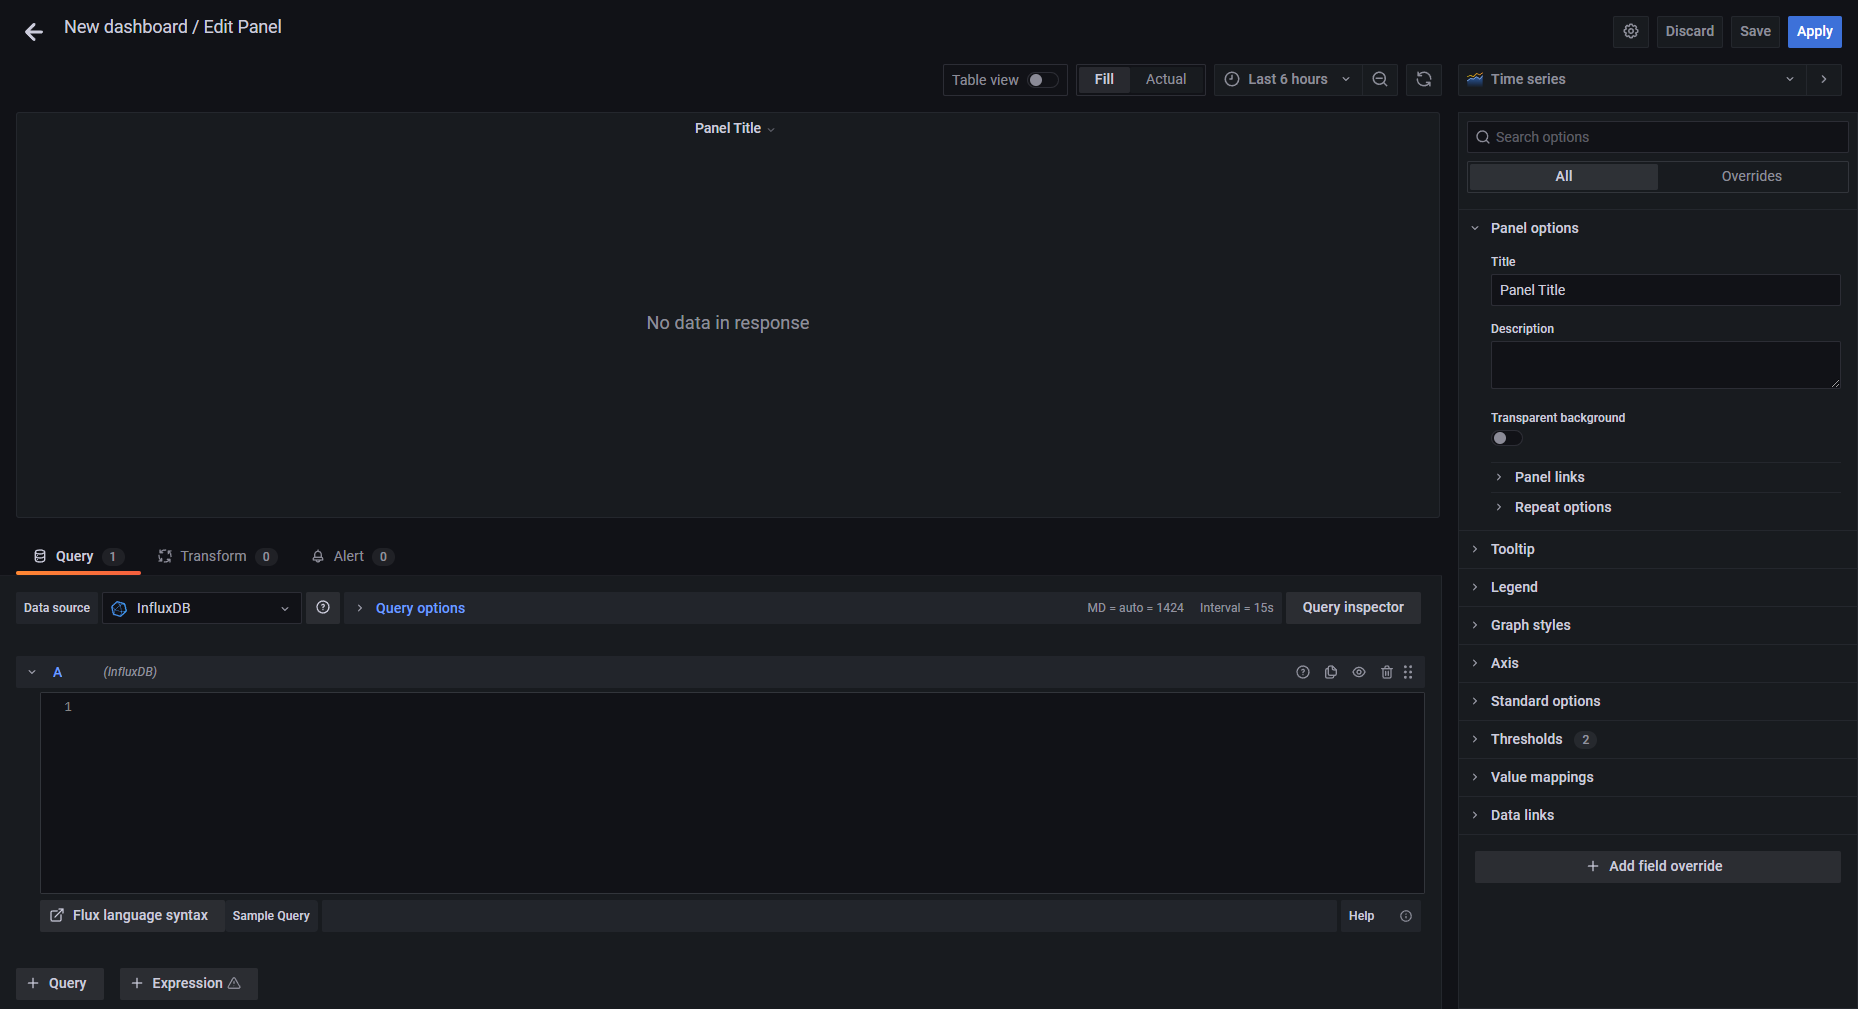
Paste the following code in the Query Editor. This
from(bucket: "NAMEOFYOUBUCKET")
  |> range(start: v.timeRangeStart, stop: v.timeRangeStop)
  |> filter(fn: (r) => r["_measurement"] == "cpu")
  |> filter(fn: (r) => r["_field"] == "usage_idle")
  |> filter(fn: (r) => r["cpu"] == "cpu-total")
  |> filter(fn: (r) => r["host"] == "NAMEOFYOURHOST")
  |> aggregateWindow(every: v.windowPeriod, fn: mean, createEmpty: false)
  |> map(fn: (r) => ({ r with _value: r._value * -1.0 + 100.0 }))
  |> toFloat()
  |> yield(name: "mean")
Use the bucket name which we used above. And the name of the host which you can retrieve from the file /etc/hostname.
The above code will calculate the CPU Usage and generate a graph for it. Give the Panel a Title. Click the Query inspector button to verify if your query is working successfully. Once you are satisfied with the result, click on the Apply button to proceed.
You can also name the axis by using the Label field on the right under the Axis section.

Click the Apply button to save the panel.
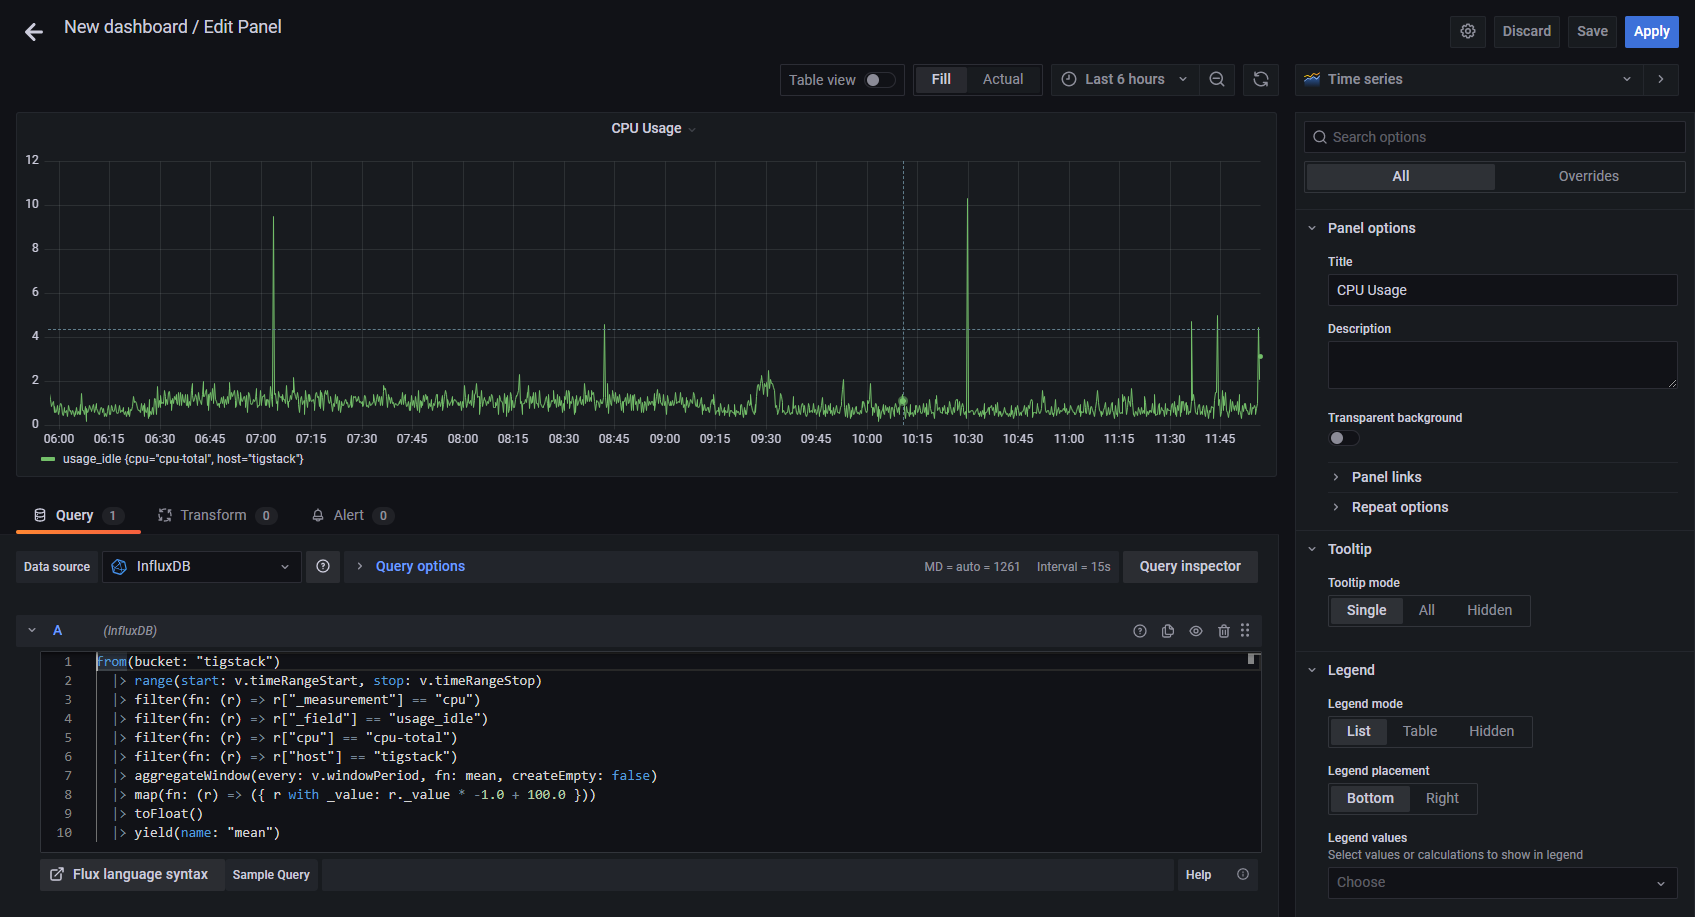
Click the Save Dashboard button, once finished.

Give a name to the dashboard and click Save to finish.

It will open the dashboard and then click on the Add Panel button to create another panel.
Repeat the process by creating another panel for RAM Usage.
from(bucket: "NAMEOFYOUBUCKET")
  |> range(start: v.timeRangeStart, stop: v.timeRangeStop)
  |> filter(fn: (r) => r["_measurement"] == "mem")
  |> filter(fn: (r) => r["_field"] == "used_percent")
  |> filter(fn: (r) => r["host"] == "NAMEOFYOURHOST")
  |> aggregateWindow(every: v.windowPeriod, fn: mean, createEmpty: false)
  |> yield(name: "mean")
And use the following code for displaying the HDD Usage.
from(bucket: "NAMEOFYOURBUCKET")
  |> range(start: v.timeRangeStart, stop: v.timeRangeStop)
  |> filter(fn: (r) => r["_measurement"] == "disk")
  |> filter(fn: (r) => r["_field"] == "used")
  |> filter(fn: (r) => r["path"] == "/")
  |> filter(fn: (r) => r["host"] == "NAMEOFYOURHOST")
  |> aggregateWindow(every: v.windowPeriod, fn: mean, createEmpty: false)
  |> map(fn: (r) => ({ r with _value: r._value / 1000000.0 }))
  |> toFloat()
  |> yield(name: "mean")
You can create an unlimited number of panels.
The above code is based on the Flux Scripting language. Fortunately, you don't need to learn the language to write queries. You can generate the query from the InfluxDB URL. 'Even though learning the language can benefit in optimizing the queries.
You need to go back to the InfluxDB dashboard and open the Explore page to get the query.
Click on the bucket name and then click on one of the values in the _measurement filter, and keep clicking on other values as and when they appear. Once you are done, click the Script Editor button and you should see the following page. The graph should also be updated.
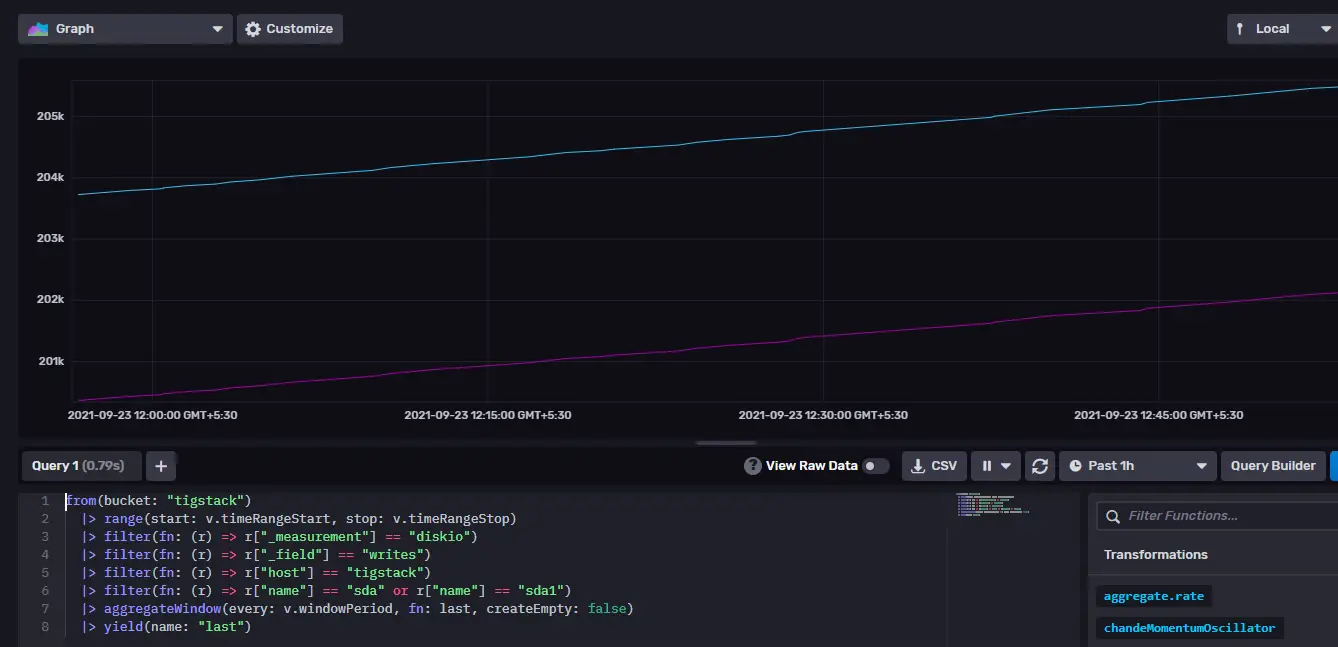
Copy the query shown and you can now use it in the Grafana dashboard to build your graphs.
Step 9 - Configure Alerts and Notifications
The primary use of setting up monitors is to get alerts on time when the value goes beyond a certain threshold.
The first step is to set the destination where you want to get alerts. You can receive notifications via Email, Slack, Kafka, Google Hangouts Chat, Microsoft Teams, Telegram etc.
We will be enabling email notifications for our tutorial. To set up Email notifications, we need to configure the SMTP service first. Open the /etc/grafana/grafana.ini file for configuring SMTP.
$ sudo nano /etc/grafana/grafana.ini
Find the following line [smtp] in it. Uncomment the following lines and enter the values for the custom SMTP server.
[smtp]
enabled = true
host = email-smtp.us-west-2.amazonaws.com:587
user = YOURUSERNAME
# If the password contains # or ; you have to wrap it with triple quotes. Ex """#password;"""
password = YOURUSERPASSWORD
;cert_file =
;key_file =
;skip_verify = false
from_address = [email protected]
from_name = HowtoForge Grafana
# EHLO identity in SMTP dialog (defaults to instance_name)
;ehlo_identity = dashboard.example.com
# SMTP startTLS policy (defaults to 'OpportunisticStartTLS')
;startTLS_policy = NoStartTLS
Save the file by pressing Ctrl + X and entering Y when prompted.
Restart the Grafana server to apply the settings.
$ sudo systemctl restart grafana-server
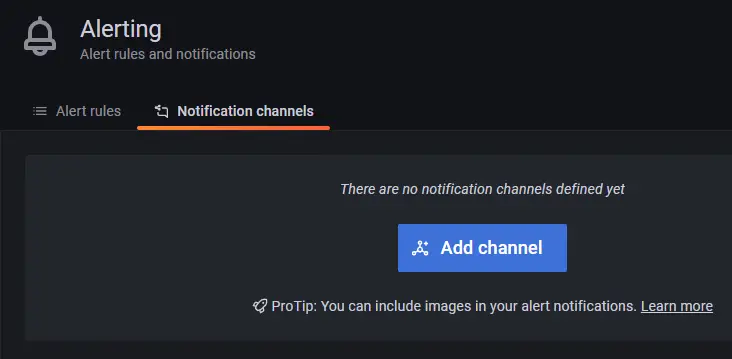
Open the Grafana page and click on the Alert icon and click on Notification channels.

Click on the Add Channel button.
Enter the details to set up the Email notification channel.
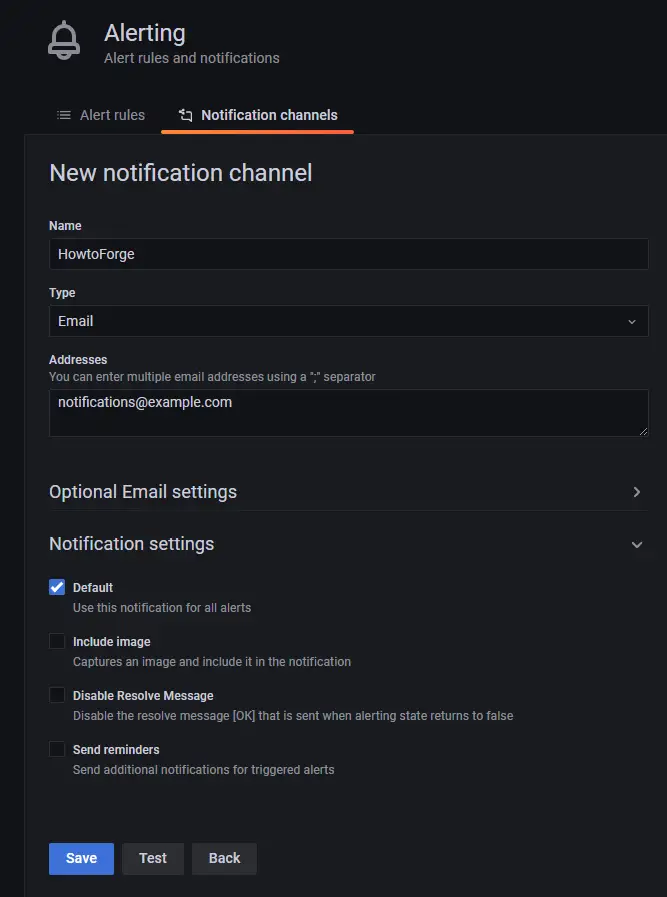
Click Test to see if the email settings are working. Click Save when finished.
Now that we have set up notification channels, we need to set up alerts on when to receive these emails. To set up the alerts, you need to go back to the dashboard panels.
Click on Dashboard >> Manage to open the Dashboard page.

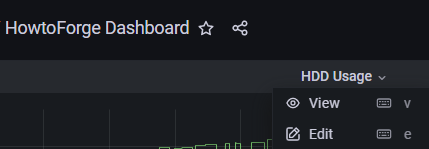
Click on the dashboard we just created and you will get its homepage with different panels. To edit the panel, click on the name of the panel and a dropdown menu will popup. Click on the Edit link to proceed.
Click on the Alert Panel and click on the Create Alert button to set up a new alert.

You can now configure the conditions under which Grafana will send the alert.

Rule
- Name - Enter a descriptive name for the alert
- Evaluate every - Specify how often Grafana should evaluate the alert. It is also called an evaluation interval. You can set any value you desire here.
- For - Specify how long the query needs to violate the threshold before the alert is triggered. Change the time according to your needs.
Conditions
Grafana works on a query of the following format to determine when to launch an alert.
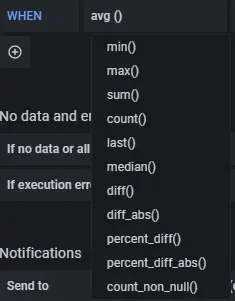
avg() OF query(A, 15m, now) IS BELOW 14
- avg() controls how the value for each series should be reduced to a comparable value against the threshold. You can click on the function name to select a different function such as avg(), min(), max(), sum(), count(), etc.
-
query(A, 15m, now) The letter in the bracket defines what query to execute from the Metrics tab. The next two parameters define the time range. 15m, now means from 15 minutes ago to now.
-
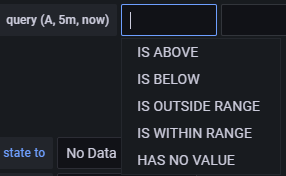
IS BELOW 14 Defines the type of threshold and the threshold value. You can click on IS BELOW to select a different threshold type.


You can add a second condition below it by clicking on the + button beneath the first condition. Currently, you can only use AND and OR operators between multiple conditions.
No Data & Error Handling
You can configure how Grafana should handle queries that return no data or only null values using the following conditions:
- No Data - Set the rule state to
NoData - Alerting - Set the rule state to
Alerting - Keep Last State - Keep the current rule state, whatever it is
- Ok - Set the alert rule state to Ok, as in you will get an alert even if things are okay.
You can tell Grafana how to handle execution or timeout errors.
- Alerting - Set the rule state to
Alerting - Keep Last State - Keep the current rule state, whatever it is
Notifications
You can specify alert rule notifications along with a detailed message about the rule. You can add anything in your message or information you want to include related to the alert.
- Send to - Select the notification channel to which we configured earlier to send the alerts.
- Message - Enter a text message to send along with your alert.
- Tags - Specify a list of tags (key/value) to be included in the notification. They are not supported by all notification channels (including Email), so you can leave them empty. They are usually used to send variables and their values in the mail.
Once you are finished, click the button Test rule to see if everything is working fine. Click the Apply button on the top right to finish adding the alert.
You should now start getting alerts on your email.
Conclusion
This concludes the tutorial about installing and configuring the TIG Stack on a Rocky Linux 8 Based server. If you have any questions, post them in the comments below.

