Memory is a relatively scarce resource on many consumer computers, so a feature to limit how much memory a process uses seems like a good idea, and Microsoft did indeed implement such a feature. However:
- They didn’t document this (!)
- Their implementation doesn’t actually save memory
- The implementation can have a prohibitively high CPU cost
This feature works by limiting the working set of a process – the amount of memory mapped into the address-space of the process – to 32 MiB. Before reading any farther take a moment to guess what the maximum slowdown might be from this feature. That is, if a process repeatedly touched more than 32 MiB of memory – let’s say 64 MiB of memory – then how much longer could these memory operations take compared to if the working set was not limited? Take a moment and write down your guess. The answer is later in this post.
This exploration started when a Chrome user tweeted at me that they kept seeing Chrome’s setup.exe hogging the CPU. Investigating weird Chrome performance problems is literally my job so we started chatting. Eventually they used UIforETW’s circular-buffer recording mode (leave tracing running, save the buffers when the problem happens) to capture an ETW trace. They filed a Chromium bug and shared the trace and I took a look.
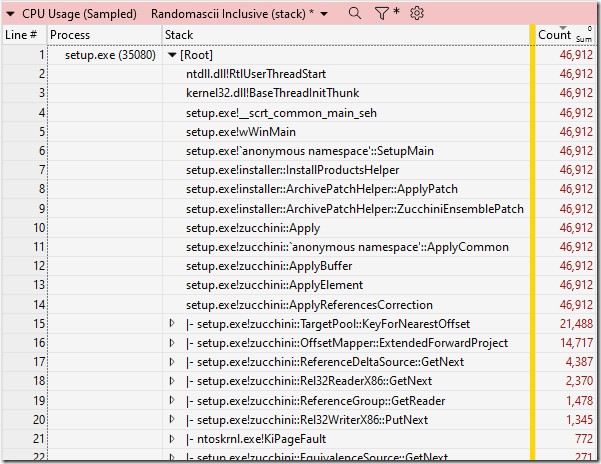
The trace did indeed show lots of CPU time being spent in setup.exe (the sampling rate is 1 kHz so each sample represents approximately 1 ms of CPU time), but there was nothing obviously out of order:
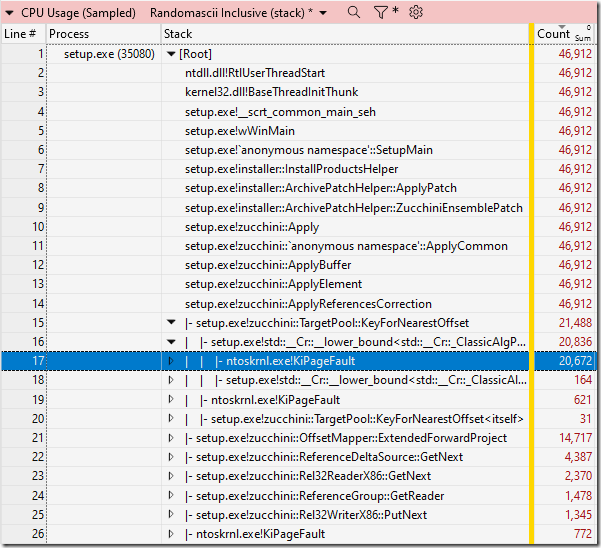
That is, at a first glance there was nothing obviously out of order, however as soon as I drilled down into the hottest call stack I saw something peculiar:
A few hundred samples spent in KiPageFault seemed maybe plausible, but more than 20,000 samples is definitely weird.
KiPageFault is triggered whenever a process touches memory that is not currently in the working set of the process. The memory faulted in might be a zeroed page (first use of an allocated page), a page from the standby list (pages in memory that contain data), a compressed page, or a page that is backed by a file (a memory mapped file or the page file). Whatever the source, this function adjusts the page tables to make the page visible inside the process, and then restarts the faulting instruction.
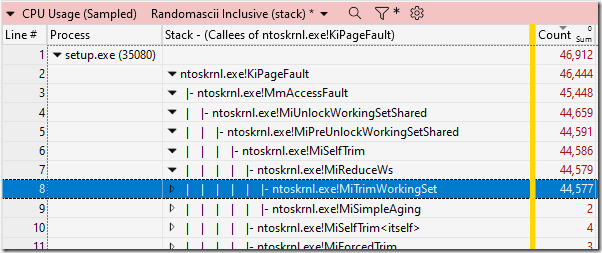
Since KiPageFault is showing up on multiple call stacks (memory can get paged in from almost anywhere, after all) I needed to use a butterfly view to find out the total cost, and get some hints as to why so much time was being spent there. So, I right-clicked on KiPageFault and selected View Callees, By Function. This showed me two very interesting details:
The first detail is that of the 46,912 CPU samples taken from this process fully 46,444 of them (99%!) were inside KiPageFault. That is remarkable. In a steady-state process (not allocating excessively) on a system with sufficient memory (this system had 64 GiB of RAM and roughly 47 GiB of that was available) the number of page faults should be close to zero, and this was a long way from that.
The other detail is that most of the time inside of KiPageFault was spent in MiTrimWorkingSet. This makes sense. But at the same time it is, actually, pretty weird. It looks like every time a page is faulted in to the process the system immediately trims the working set, presumably removing another page from the working set. Doing this is expensive, and increases the odds of future page faults. So, it makes sense in that it explains why the process is spending so much time in KiPageFault, but it is weird because I don’t know why Windows would be doing this.
 ETW traces contain a wealth of information so I looked at the “Total Commit” table and found that setup.exe only had 47.418 MiB of commit. This measures the total amount of allocated memory in this process, plus a few other types of memory such as stack, and modified global variables. 47.418 MB is a pretty tiny amount and should take less than 10 ms to fault in (see Hidden Costs of Memory Allocation for details), and there were no new allocations during the trace, so the KiPageFault overhead was definitely excessive.
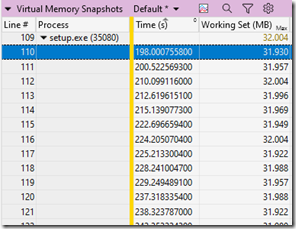 I then looked in the “Virtual Memory Snapshots” table at the Working Set column. This column contains working-set information sampled occasionally – 19 times during the 48 seconds I looked at. These samples showed the working set varying between 31.922 MiB and 32.004 MiB. That is, the sampled working set went as low as 80 KiB below 32 MiB, and as high as 4 KiB above 32 MiB. That is a very tight range.
Procrastination
I thought that SetProcessWorkingSetSize might be involved in triggering this behavior, and a coworker suggested SetPriorityClass with PROCESS_MODE_BACKGROUND_BEGIN could be a factor, so I thought about doing some experimentation with these functions. But, the issue was reported on Windows 11 and I assumed that there must be some odd-ball configuration triggering this edge case behavior so I didn’t think my tests would be fruitful so I did nothing for three weeks.
I finally got back to the bug and decided to start by doing the simplest possible test. I wrote code that allocated 64 MiB of RAM, touched all of it, then used EmptyWorkingSet, SetProcessWorkingSetSize, and SetPriorityClass with PROCESS_MODE_BACKGROUND_BEGIN, then touched the memory again. I used some Sleep(5000) calls and Task Manager to monitor the working set. I was not expecting the simplest possible test to reveal the problem.
My tests showed that EmptyWorkingSet and SetProcessWorkingSetSize both emptied the working set almost to nothing, but the working set “refilled” when the memory was touched again. So, the documentation for these functions (as crazy and archaic as it sounds) seems to be mostly accurate. And, unless they were called extremely frequently these functions could not cause the problem.
On the other hand, my tests showed that SetPriorityClass with PROCESS_MODE_BACKGROUND_BEGIN caused the working set to be trimmed to 32 MiB, and kept it there when I touched all the memory again. That is, while touching 64 MiB of memory would normally fault those pages in and push the working set to 64 MiB or higher, instead the working set stayed capped.
Whoa. That’s crazy. It wasn’t supposed to be that simple. I refined the test code more but it’s still fairly simple. In its final form the code allocates 64 MiB of memory and then repeatedly walks over that memory (writing once to each page) to see how many times it can walk over the memory in a second. Then it does the same thing with the process set to background mode. The difference is dramatic:
The performance of scanning the memory in the normal mode is quite consistent, taking about 0.2 ms per scan. Scanning in background mode normally takes about 250 times as long per scan (two hundred and fifty times as long!!!). Sometimes the background-mode scanning goes dramatically slower – up to about 800 times as long per scan, 160 ms for 64 MiB.
This dramatic increase in CPU time is not a great way to reduce the impact of background processes.
Limiting the Working Set Doesn’t Save Memory!
Okay, so PROCESS_MODE_BACKGROUND_BEGIN makes some operations take more than 250 times as long to run, but at least it saves memory. Right? Right?
Well, no. Not really. Not in any situation I can imagine.
Trimming the working set of a process doesn’t actually save memory. It just moves the memory from the working set of the process to the standby list. Then, if the system is under memory pressure the pages in the standby list are eligible to be compressed, or discarded (if unmodified and backed by a file), or written to the page file. But “eligible” is doing a lot of heavy lifting in that sentence. The OS doesn’t immediately do anything with the page, generally speaking. And, if the system has gobs of free and available memory then it may never do anything with the page, making the trimming pointless. The memory isn’t “saved”, it’s just moved from one list to another. It’s the digital equivalent of paper shuffling.
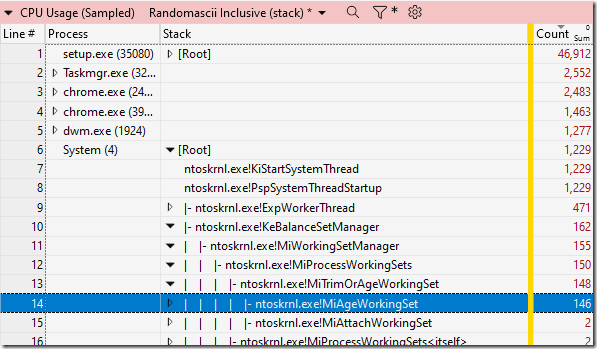
Another reason this trimming is pointless is because the system already has a (much more efficient) mechanism for managing working sets. Every second the system process wakes up and runs KeBalanceSetManager. Among other things this function calls MiProcessWorkingSets which calls MiTrimOrAgeWorkingSet:
All I know about this system is the names of the functions and the frequency of its operation, but I feel pretty confident in speculating about roughly what it’s doing, and it seems like a strictly better solution to the problem. Here’s why MiTrimOrAgeWorkingSet is better than PROCESS_MODE_BACKGROUND_BEGIN:
- Trimming the working set once per second is far more efficient (uses less CPU time) than trimming it after every page fault, and it greatly reduces the odds of trimming a page just before it is needed
- Trimming the working set once per second is just as memory efficient as trimming after every page fault because trimming doesn’t immediately save memory anyway
- Trimming the working set every second can more easily respond to changes in memory pressure, doing nothing when there is lots of free memory, and then aggressively trimming rarely-touched pages from idle processes when conditions change.
Resolution
As far as Chrome is concerned the solution to this problem was simple – don’t call this function, and therefore don’t put Chrome’s setup process into this mode. We still run in low-priority mode, but not the problematic “background” mode.
But this function remains, waiting to snare some future developer. The easiest thing that Microsoft could do would be to change the documentation to acknowledge this behavior. I have in mind a large, red, bold-faced label saying “if your process uses more than 32 MiB of memory then this may make your program run 250 times slower and it won’t really save memory so maybe use THREAD_MODE_BACKGROUND_BEGIN instead.” But fixing the documentation would not be as valuable as fixing the background mode. I have trouble imagining any scenario where capping the working set would be better than the working-set trimming implemented in the system process, so removing this functionality seems like a pure win.
And fixing the background mode would avoid the need for the ugly large, red, bold-faced warning label.
Ironically the impetus for using PROCESS_MODE_BACKGROUND_BEGIN in Chrome was a 2012 Chrome bug (predating my time on the team, and I’ve been there a while) complaining that the updater was using too much CPU time.
This recent issue was reported on Windows 11, but I found a Mozilla bug discussing this flag that linked to a Stack Overflow answer from 2015 that pointed out that PROCESS_MODE_BACKGROUND_BEGIN limited the working set to 32 MiB on Windows 7. This issue has been known for eight years, on many versions of Windows, and it still hasn’t been corrected or even documented. I hope that changes now.
Addendums
To clarify, it is the working-set that is trimmed to 32 MiB, not the private working set. So, the 32 MiB number includes code as well as data, for what it’s worth.
Also, after posting this I was playing around and found that when I reset the process with PROCESS_MODE_BACKGROUND_END this causes the working set to be trimmed. That’s harmless, but weird. Why would taking the process out of background mode cause the working set to be trimmed as if the process had called EmptyWorkingSet?
A twitter user posted a bit of history and a tool (untested!) to list working-set state for processes on the system.


and as high as 4 KiB above* 32 MiB
Fixed. Thanks.
I am reminded of another limit which used to be (and most likely still is) hard-coded too low: the buffer used for file-copying in Explorer.
On my Windows 10 machine, dragging a file from one HDD partition to another made the drive sound like it was going to shatter.
I realized the buffer was so tiny that most of the time copying was spent flinging the read-head back and forth between partitions, rather than reading and writing.
Writing a small copy-program that used a modest 64 MiB buffer just to test, resulted in file-copying that was both silent and three times as fast.
This reminds me of a similar issue when setting the file system cache size to an explicit value which would also page in/out with huge amounts of CPU on specific OS versions when a low value e.g. 20 MB was used. Setting a limit is not so bad, but the implementation to enforce the limit was somewhat surprising.
How do you set the file system cache size? Not because I want to, but because I’m curious.
The file system cache on Windows (and every other OS I have looked at) just uses available memory so its size varies tremendously. On my home laptop it is currently 15.6 GB, and constraining it to 20 MB would be quite counterproductive.
The method is SetSystemFileCacheSize (https://learn.microsoft.com/en-us/windows/win32/api/memoryapi/nf-memoryapi-setsystemfilecachesize). If you set a hard upper limit you will find funny issues if you are doing then a lot of cached IO operations.
Interesting. Definitely a foot gun, but at least its behavior is documented. And, an easy way to flush the disk cache sounds interesting.
Yeah, Windows is for games and toys that is true.
Interesting article. However for me the link to “don’t call this function” shows only a blank page. Just for Your information.
Weird. The link works fine for me, even in an incognito window.
It’s a link to the change that removed our calls to the problematic function.