
Images are an integral part of our surroundings, and having the ability to manipulate them or transform their appearance is a valuable skill. Image processing finds its application in a wide range of fields, including data visualization and machine learning, where automated systems handle thousands of images simultaneously.
In this article, we will look into a basic image processing technique that involves the conversion of RGB (Red, Green, Blue) images into Grayscale (black and white) images. To accomplish this, we will make use of Matplotlib, a popular Python library known for its capabilities in creating plots and visualizing data. Additionally, we will explore some practical examples of converting RGB images to grayscale using Matplotlib.
Also Read: A Beginner’s Guide to Reading an Image in OpenCV Using Python
Why Convert Colorful to Monochrome?
You might be wondering why we even bother converting beautiful and colourful images to dull grayscale ones. Converting from RGB to grayscale is widely done for the following reasons:
- Reduce the complexity of computations while processing images: Colourful images have a higher number of data channels compared to grayscale ones that have only one data channel. This can reduce the time and number of computations required for processing the image.
- Lesser size: Grayscale images are smaller in size compared to colourful images. In comparison, a single pixel of an RGB image is 24 bits (8 bits per colour) whereas in grayscale, each pixel would just be 8 bits, hence, reducing the overall size of the image by 1/3rd.
- Better analysis of images: Since they only contain information about the brightness of the image and no additional colours, complexities that arise due to factors like saturation and hue of the images are completely eliminated.
Now that we have understood why grayscale conversions are more advantageous. Let’s see how to do the conversion.
Converting RGB Images to Grayscale Using Matplotlib
An essential step before jumping into an example would be to have the Matplotlib and NumPy libraries installed on our system. Numpy is a widely used Python library to perform mathematical computations on numerical arrays. Here, we’ll mainly use Numpy to store the weights of the RGB colour channels as an array which will be later used to calculate the brightness of each red, green and blue pixel in the image.
The command to install both packages simultaneously is as follows:
pip install matplotlib numpy
Now we can look at an example along with the step-by-step procedure.
The image we’ll be using throughout this tutorial will be the following image, saved as “test_img.png” in the same directory as our program.

In this example, we’ll first load in an RGB image and then use the formula for luminance conversion to convert each of the pixel values in the colour image to grayscale. Let’s look at the step-by-step procedure to implement this.
Step 1: Import the Necessary Libraries and Dependencies
import matplotlib.pyplot as plt
import matplotlib.image as mpimg
import numpy as np
Step 2: Load the RGB Image into the Program
The image present in our directory must be loaded into our program in order to manipulate it. This can be done using Matplotlib’s image dependency which provides numerous functions to work with images. Here, we’ll use the imread() function, which takes the path to an image as input and loads it into our program.
rgb_image = mpimg.imread('test_img.png')
Note that test_img.png should be replaced with the name of the image you are using or the path to the image of your choice.
imread() returns the pixels of the image a multi-dimensional array containing the intensities of red, green and blue components respectively. The intensity value of each component can vary from anywhere between 0 to 255. This array is stored in rgb_image.
Step 3: Convert the RGB Image to Grayscale
This is done using the Numpy library’s dot() function, which is used to calculate the dot product (scalar product) of two arrays. To convert RGB to grayscale we use the formula:
0.2989 * R + 0.5870 * G + 0.1140 * B
Here, 0.2989, 0.5870 and 0.1140 are constant weight values given to red, green and blue respectively. These have been scientifically calculated based on how the human eye perceives different colours. Our goal here is to multiply each pixel’s RGB value by their corresponding weight values. The pixel values can be obtained from the rgb_image array.
We can store the weights in a list weights for easy computation.
weights = [0.2989, 0.5870, 0.1140]
gray_image = np.dot(rgb_image[..., :3], weights)
The rgb_image[…, :3] indicates that for the first two dimensions we select all the elements (denoted by the ‘…‘ operation) and for the last dimension we use the slice operation (‘:’) to select only the first three elements, that is the red, green and blue channel values.
Step 4: Visualizing the Images Using Matplotlib
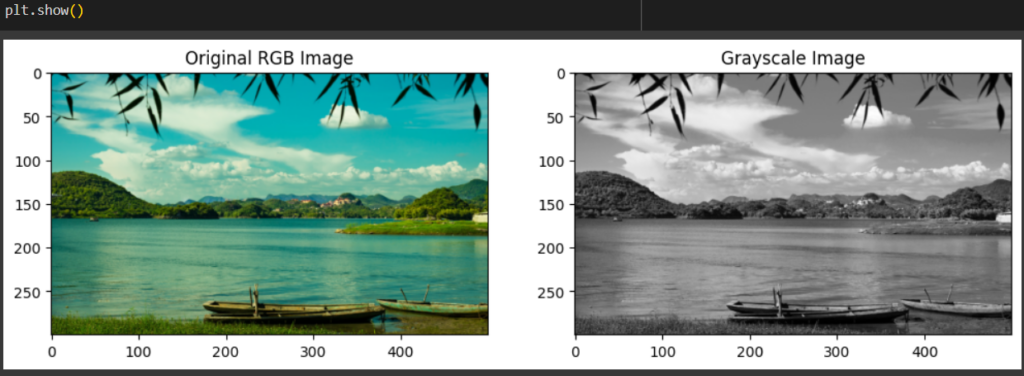
To see the results of our conversion we use Matplotlib to make a plot of our images. We divide our plot into two subplots using the subplots() function. subplots(1,2) indicate that we’re dividing our plot into 2, horizontally. The left side will contain our original RGB image. We can plot the left side as follows:
figure, (left,right) = plt.subplots(1,2,figsize=(12, 6))
left.imshow(rgb_image)
left.set_title('Original RGB Image')
Here, we have a total plot of size 1200×600. We use the imshow() function on the left subplot to display the RGB image. We use set_title() to give it a title.
We can do the same on the right subplot, to display the grayscale image.
right.imshow(gray_image, cmap='gray')
right.set_title('Grayscale Image')
Here we use the cmap parameter in imshow() to set a colour map value on the grayscale image.
Step 5: Displaying the Plot
The above steps can be combined into a single code as follows:
import matplotlib.pyplot as plt
import matplotlib.image as mpimg
import numpy as np

rgb_image = mpimg.imread('test_img.png')

weights = [0.2989, 0.5870, 0.1140]
gray_image = np.dot(rgb_image[..., :3], weights)

figure, (left,right) = plt.subplots(1,2,figsize=(12, 6))
left.imshow(rgb_image)
left.set_title('Original RGB Image')

right.imshow(gray_image, cmap='gray')
right.set_title('Grayscale Image')

plt.show()
Using plt.show() we can display our plot.
Output:
Conclusion
Transforming RGB images into grayscale may dull their visual appeal, but it carries significant benefits for image processing. In this article, we’ve delved into these advantages in-depth, along with a practical demonstration of how to perform this conversion using straightforward NumPy array operations and functions. Additionally, we’ve explored the technique to show both the original and grayscale images side by side using Matplotlib’s subplots.
Reference
https://stackoverflow.com/questions/12201577/how-can-i-convert-an-rgb-image-into-grayscale-in-python