This is part of an ongoing series of post by Grant as he takes his vast knowledge of SQL Server and applies it to adding PostgreSQL and shares it with you so you can skip learn from his triumphs and mistakes. For more you can go to the Learning PostgreSQL with Grant series home page
While there are many features within PostgreSQL that are really similar to those within SQL Server, there are some that are unique. One of these unique features is called VACUUM. In my head, I compare this with the tempdb in SQL Server. Not because they act in any way the same or serve similar purposes. They absolutely do not. Instead, it’s because they are both fundamental to behaviors within their respective systems, and both are quite complex in how they work, what they do, and the ways in which we can mess them up.
VACUUM is a complex, deep, topic, so this article will only act as an introduction. I’ll have to follow up with more articles, digging into the various behaviors of this process. However, let’s get started. VACUUM, and the very directly related, ANALYZE, are vital processes in a healthy PostgreSQL environment. Most of the time these will be running in an automated fashion, and you’ll never deal with them directly. However, since these processes are so important, I am going to introduce them now.
The PostgreSQL VACUUM Process
At its core, VACUUM is pretty simple. PostgreSQL doesn’t actually, physically, remove the data when you issue a DELETE statement. Instead, that data is logically marked as deleted internally and then won’t show up in queries against the table. For an UPDATE statement, a new row is added and the old row is logically marked as deleted. As you can imagine, if nothing is done, your database will eventually fill your disk (unless you define a TABLESPACE for the tables and limit its size, and that’s another article). The first function then of VACUUM is to remove those rows from the table. That’s it. Nice and simple.
Well, of course it’s not that simple.
VACUUM has a second behavior called ANALYZE. The ANALYZE process examines the tables and indexes, generating statistics, and then stores that information in a system catalog (system table) called pg_statistic. In short, VACUUM ANALYZE is the PostgreSQL equivalent of UPDATE STATISTICS in SQL Server.
I told you that VACUUM was both complex and integral to the behavior of PostgreSQL. Without it you not only will fill your drives, but you won’t have up to date statistics. There’re even more behaviors wrapped up within the VACUUM process, but we’re not going to cover them all here. In fact, we’re not even going to go very deep into the two standard behaviors, cleaning up your tables and maintaining your statistics, because each of these are very deep topics all on their own. We are going to go over the basics of how these processes work and why you need to pay attention to them.
VACUUM
Making VACUUM work is very simple. This command will ensure that the space is retrieved from all tables:
|
1 |
VACUUM; |
While the space from the removed rows is reclaimed for reuse, the actual size of your database won’t shrink. The exception to this is when there are completely empty pages at the tail end of the table. In that case, you can see the space being completely reclaimed.
The PostgreSQL equivalent to SHRINK would be to run VACUUM like this:
|
1 |
VACUUM (FULL); |
This command will rebuild all the tables in the database into new tables. That comes with significant overhead and will most certainly cause blocking while the data is being moved. This will also cause significant IO on the system. However, it’ll remove every empty page, reclaiming space for the operating system. Again, similar to SHRINK, running this regularly is not considered a good practice. In fact, Ryan Booz, who kindly did some technical edits on this article says, “running this at all is not considered a good practice.” The core issue is that while running this command, the standard automated VACUUM processes are blocked, possibly setting you up to need to run this process again, then again, then… Well, you get the point.
You can also target specific tables when running VACUUM manually:
|
1 |
VACUUM radio.antenna; |
You can even specify a list of tables:
|
1 |
VACUUM radio.antenna, radio.bands, radio.digitalmodes; |
In either of these cases, instead of accessing every table in the database to which I have permissions, only the table or tables listed will go through the VACUUM cleanup process.
To really see what’s happening, we can take advantage of an additional parameter, VERBOSE. I’m going to load up a table with some data and then remove that data. Then, we’ll run VACUUM:
|
1 2 3 4 5 6 7 8 |
INSERT INTO radio.countries (country_name) SELECT generate_series(1,15000,1); DELETE FROM radio.countries WHERE country_id BETWEEN 3 AND 12000; VACUUM (VERBOSE) radio.countries; |
The results are as follows (yours may vary some, but should be similar):
vacuuming "hamshackradio.radio.countries"
finished vacuuming "hamshackradio.radio.countries": index scans: 1
pages: 0 removed, 81 remain, 81 scanned (100.00% of total)
tuples: 11998 removed, 3004 remain, 0 are dead but not yet removable
removable cutoff: 1305, which was 0 XIDs old when operation ended
new relfrozenxid: 1304, which is 3 XIDs ahead of previous value
index scan needed: 64 pages from table (79.01% of total) had 11998 dead item identifiers removed
index "pkcountry": pages: 77 in total, 58 newly deleted, 65 currently deleted, 7 reusable
avg read rate: 12.169 MB/s, avg write rate: 12.169 MB/s
buffer usage: 729 hits, 3 misses, 3 dirtied
WAL usage: 388 records, 0 full page images, 96719 bytes
system usage: CPU: user: 0.00 s, system: 0.00 s, elapsed: 0.00 s
I’m not 100% on everything going on here, as this series says, learning with Grant. However, there is easily spotted information. 11,998 tuples removed with 3004 remaining. You can also see the pages for the pkcountry index where there was 77 pages, but 58 were deleted and 7 are reusable. On top of all that, you get the performance metrics at the end for just how long everything took and the I/O involved. This is all useful stuff.
For anyone following along in the series, if you want to clean up your table after this little test, here are the scripts I used:
|
1 2 3 4 5 |
DELETE FROM radio.countries WHERE country_id > 2; ALTER TABLE radio.countries ALTER COLUMN country_id RESTART WITH 3; |
I could probably run VACUUM on the table again to see more results.
Now, there are simply metric tonnes more details on everything VACUUM does and how it does it. However, these are the basics. Let’s shift over and look at ANALYZE for a minute.
ANALYZE
One thing that PostgreSQL shares with SQL Server is the use of statistics on tables as a means of row estimation within the query optimization process. And, just like SQL Server, these statistics can get out of date as the data changes over time. While there is an automated process to handle this (more on that later), you may find, just like SQL Server, that you need to intervene directly. So, built in to the VACUUM process is the ability to update statistics through the ANALYZE parameter:
|
1 |
VACUUM (ANALYZE); |
Just as with the VACUUM command at the start, this will examine all the tables that I have access to within the database in question and run ANALYZE against them.
Interestingly, you can run ANALYZE as a separate process. This will do the same thing as the preceding statement:
|
1 |
ANALYZE; |
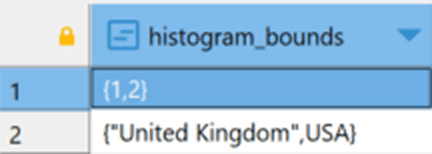
You can run the commands separately primarily as a mechanism of control and customization. The actions performed are the same. To see this in action, I want to look at the radio.countries table and the statistics there, after running ANALYZE to be sure that it reflects the two rows in the table:
|
1 2 3 4 5 6 7 8 |
VACUUM (ANALYZE) radio.countries; SELECT ps.histogram_bounds FROM pg_stats AS ps WHERE ps.tablename = 'countries'; |
Now, as with SQL Server, there’s a whole lot to statistics. I’m just displaying the histogram here so we can see why kind of data might be in it. The results are here:
I’m going to rerun the data load script from above, and then immediately look at the statistics in pg_stats again. Since there is an automatic VACUUM process (more on that later) that runs about once a minute by default, I want to see the stats before they get fixed by an automated ANALYZE process:
|
1 2 3 4 5 6 7 8 9 10 11 12 13 14 15 16 17 18 19 |
INSERT INTO radio.countries (country_name) SELECT generate_series(1,15000,1); SELECT ps.histogram_bounds FROM pg_stats AS ps WHERE ps.tablename = 'countries'; VACUUM (ANALYZE) radio.countries; SELECT ps.histogram_bounds FROM pg_stats AS ps WHERE ps.tablename = 'countries'; |
The first result set (not pictured) from pg_stats is exactly the same as the figure above. This is because they automated VACUUM process hasn’t run ANALYZE yet and I didn’t do a manual ANALYZE. Then, of course, I do the ANALYZE and the results of the histogram change to this:
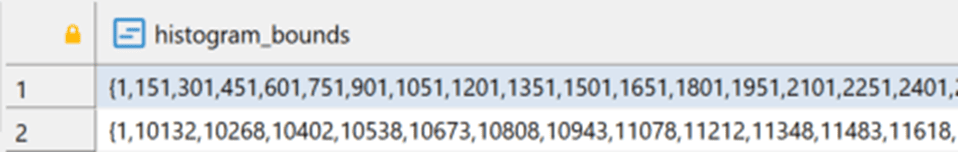
It just keeps going from there, out to the width of the values in the histogram for the table (again, another article we’ll be covering in the future).
I can also take advantage of the VERBOSE parameter to see what’s happening when ANALYZE runs. This time I’ll just run the ANALYZE command though:
|
1 2 3 |
DELETE FROM radio.countries WHERE country_id BETWEEN 3 AND 12000; ANALYZE (VERBOSE) radio.countries; |
And the output is here:
analyzing "radio.countries"
"countries": scanned 81 of 81 pages, containing 3004 live rows and 11998 dead rows; 3004 rows in sample, 3004 estimated total rows
You can see that it’s now scanned a smaller set of rows to arrive at a new set of statistics and a new histogram. You can also see the deleted rows in the output. I ran this separately so that it didn’t do both a VACUUM and ANALYZE. This is how you can break these things down and take more direct control.
I’ve hinted at it several times throughout the article. There is an automatic VACUUM process that we need to discuss, the autovacuum deamon.
Autovacuum
Enabled by default, there is a deamon process within PostgreSQL that will automatically run both VACUUM and ANALYZE on the databases on your system completely automatically. The process is pretty sophisticated and highly customizable, so you can make a lot of changes to the base behavior.
Basically, autovacuum runs against every database on the server. The default number of threads that can be operating at the same time is 3, set through autovacuum_max_workers, which you can configure. It launches every 60 second by default through the autovacuum_naptime value, also configurable. You’re going to see a pattern, most of the settings can be configured.
Then, there’s a threshold to determine if a given table will go through the VACUUM and ANALYZE processes. VACUUM has to exceed the autovacuum_vacuum_threshold value, the default of which is 50 tuples, or rows. It’s a little more complicated than that because there’s a calculation involving the autovacuum_vacuum_insert_threshold, which has a default of 1,000 tuples, which is then added to the autovacuum_vacuum_insert_scale_factor, by default, 20% of the rows of a given table. This value is then multiplied by the number of tuples in the table. All of that lets us know which tables will get the VACUUM process run against them. ou can see the formula laid out here in the documentation.
ANALYZE is similar. The autovacuum_analyze_threshold, 50 tuples by default, is calculated against the autovacuum_analyze_scale_factor, 10% of the table, and the number of tuples to arrive at the analyze threshold value.
All of these settings can be controlled at the server level, or, at the table level, allowing a high degree of control over exactly how both your automatic VACUUM and your automatic ANALYZE operate. You may find, similar to statistics updates in SQL Server, that the automated processes need to be either adjusted, or augmented with the occasional manual update. As stated earlier, statistics in PostgreSQL provide the same kind of information to the optimizer as they do in SQL Server, so getting them as right as possible is quite important.
Conclusion
As I said at the beginning, the VACUUM process is a very large, involved, topic. I’ve only scratched the surface with this introduction. However, the basics are there. We have an automatic, or manual, process that cleans out deleted tuples. Then, we have an automatic, or manual, process ensuring that our statistics are up to date. While taking control of these processes and adjusting the automated behaviors, or running them manually is relatively straightforward, knowing when and where to make those adjustments is a whole different level of knowledge.
Load comments