How to Monitor PostgreSQL with Prometheus and Grafana on Ubuntu 22.04
In this tutorial, you'll set up Prometheus and Grafana Monitoring Platforms to monitor the PostgreSQL database server. You'll install and set up the postgres_exporter to gather PostgreSQL server matrics and expose them to the Prometheus server. At the end of this tutorial, you'll set up the dashboard monitoring for the PostgreSQL server via the Grafana data visualization platform.
Prerequisites
To complete this tutorial, you'll need the following requirements:
- A server with Prometheus and Grafana installed on top of it.
- A target server with a PostgreSQL database server installed.
- A non-root user with sudo/root administrator privileges.
Below are some guides for the installation of each component.
How to Install Prometheus and Grafana Monitoring Platform on Ubuntu 22.04 Server.
How to Install PostgreSQL Database Server on Ubuntu 22.04 Server.
Now let's get started When all prerequisites are finished and in place.
PostgreSQL Server Configuration
The PostgreSQL server provides two different password encryption methods: md5 and scram-sha-256. Both password encryptions can be configured via the PostgreSQL config file 'postgresql.conf'.
In this step, you'll set up PostgreSQL to use the 'scram-sha-256' password encryption.
This example uses the PostgreSQL server v14 that is installed on an Ubuntu system, so the PostgreSQL configuration files is stored in the '/etc/postgresql/14/main' directory.
Move to the working directory to the '/etc/postgresql/14/main' directory and open the configuration file 'postgresql.conf' via the nano editor command.
cd /etc/postgresql/14/main
sudo nano postgresql.conf
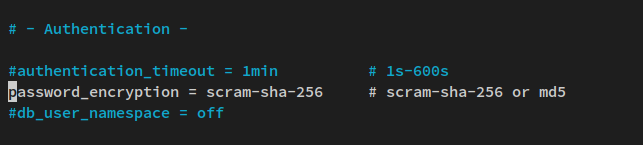
Uncomment the option 'password_encryption' and change the value to 'scram-sha-256'.
password_encryption = scram-sha-256 # scram-sha-256 or md5
Save the file and exit the editor when you are finished.
Next, open the config file 'pg_hba.conf' via the nano editor command below. The file 'pg_hba.conf' is the configuration where password authentication methods are defined for hosts or IP addresses.
sudo nano pg_hba.conf
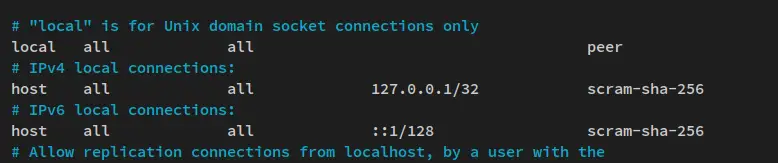
Change the default authentication methods for the host '127.0.0.1/32' and '::1/128' to 'scram-sha-256'. With this, the authentication method 'scram-sha-256' will be used for every client connection to the PostgreSQL server '127.0.0.1'.
# "local" is for Unix domain socket connections only
local   all             all                                     peer
# IPv4 local connections:
host    all             all             127.0.0.1/32            scram-sha-256
# IPv6 local connections:
host    all             all             ::1/128                 scram-sha-256
Save and exit the editor when you're done.
Lastly, run the below systemctl command utility to restart the PostgreSQL service and apply the changes.
sudo systemctl restart postgresql
With the PostgreSQL server configured, you'll next install the 'postgres_exporter' that allows you to gather metrics of the PostgreSQL server.
Downloading postgres_exporter
The 'postgres_exporter' is a prometheus exporter for the PostgreSQL server metrics. It supports multiple versions of PostgreSQL such as 9.4, 9.5, 9.6, 10, 11, 12, 13, and 14. The 'postgres_exporter' is a single binary file application, it's mainly written in Go.
You'll download the 'postgres_exporter' in these steps on the PostgreSQL server.
To start, run the below command to create a new system user 'postgres_exporter' on your PostgreSQL server.
sudo useradd -M -r -s /sbin/nologin postgres_exporter
After that, download the 'postgres_exporter' binary file via the wget command below. Be sure to check the 'postgres_exporter' GitHub page to get the latest version of 'postgres_exporter'. At the time of this writing, the latest version of postgres_exporter is v0.12.
wget https://github.com/prometheus-community/postgres_exporter/releases/download/v0.12.0-rc.0/postgres_exporter-0.12.0-rc.0.linux-amd64.tar.gz
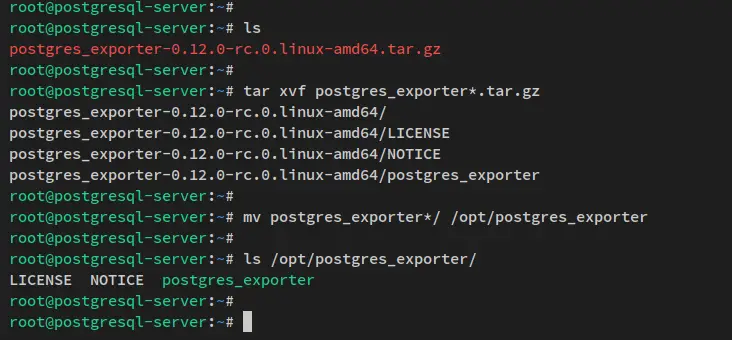
Next, run the below tar command to extract the postgres_exporter package. Then, move the extracted directory of postgres_exporter to the '/opt/postgres_exporter'.
tar xvf postgres_exporter*.tar.gz
mv postgres_exporter*/ /opt/postgres_exporter
Lastly, verify the list of files and directories on the 'postgres_exporter' directory. You should see the 'postgres_exporter' binary is available.
ls /opt/postgres_exporter
With the 'postgres_exporter' binary file downloaded, you'll then configure the 'postgres_exporter' for gathering PostgreSQL server metrics.
Configuring postgres_exporter
In this step, you'll configure the 'postgres_exporter' to gather PostgreSQL metrics, and this can be done by defining the PostgreSQL user and password. You'll also set up and configure the systemd service for the 'postgres_exporter'.
With the 'postgres_exporter', you can expose metrics for all available databases on the PostgreSQL server, or you can expose specific databases that you want to monitor. You can also use secure SSL mode or non-SSL mode.
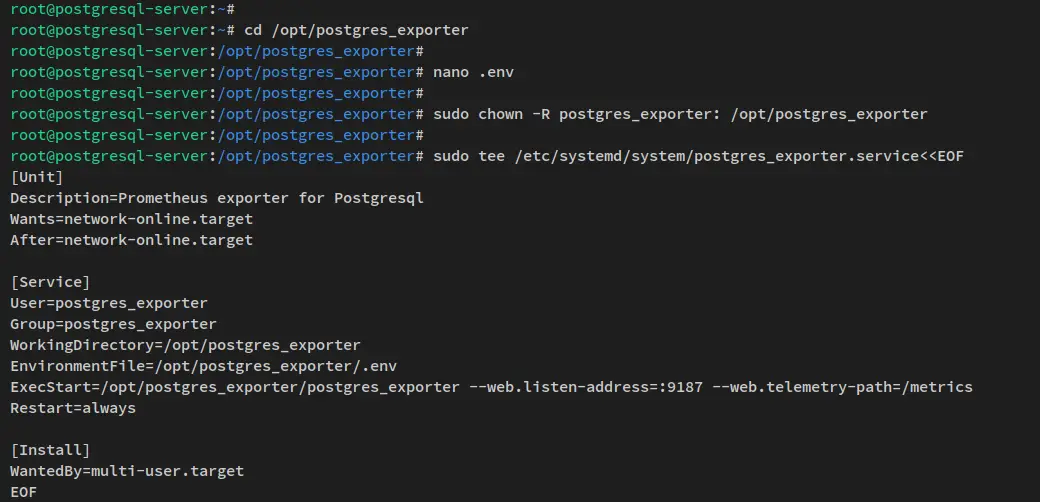
Move the current working directory to '/opt/postgres_exporter'. via the cd command below.
cd /opt/postgres_exporter
Now create a new file '.env' using the below nano editor command.
nano .env
Add the following lines to the file. Also, be sure to change the details of the PostgreSQL user, password, and host. With this '.env' file, you'll scrape and gathers PostgreSQL metrics from all available databases. You can also gather metrics from a specific PostgreSQL database, and adjust the following config file.
# Format
#DATA_SOURCE_NAME=postgresql://username:password@localhost:5432/postgres?sslmode=disable

# Monitor all databases via postgres_exporter
DATA_SOURCE_NAME="postgresql://postgres:strongpostgrespassword@localhost:5432/?sslmode=disable"

# Monitor specific databases on the PostgreSQL server
# DATA_SOURCE_NAME="postgresql://username:password@localhost:5432/database-name?sslmode=disable"
Save the file and exit the editor when you're finished.
Next, run the below chown command to change the ownership of the '/opt/postgres_exporter' directory to the user 'postgres_exporter'.
sudo chown -R postgres_exporter: /opt/postgres_exporter
After that, run the below command to create a new systemd service file '/etc/systemd/system/postgres_exporter.service'. With this, you can easily manage the 'postgres_exporter' via the systemctl command utility.
sudo tee /etc/systemd/system/postgres_exporter.service<<EOF
[Unit]
Description=Prometheus exporter for Postgresql
Wants=network-online.target
After=network-online.target

[Service]
User=postgres_exporter
Group=postgres_exporter
WorkingDirectory=/opt/postgres_exporter
EnvironmentFile=/opt/postgres_exporter/.env
ExecStart=/opt/postgres_exporter/postgres_exporter --web.listen-address=:9187 --web.telemetry-path=/metrics
Restart=always

[Install]
WantedBy=multi-user.target
EOF
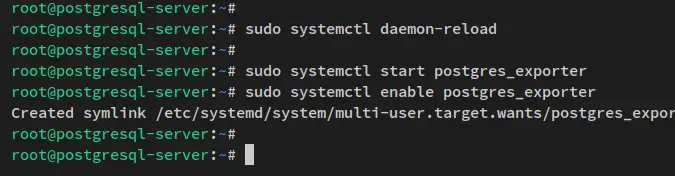
Now run the below systemctl command to reload the systemd manager and apply the changes.
sudo systemctl daemon-reload
After the systemd manager is reloaded, start and enable the 'postgres_exporter' service via the systemctl command utility below.
sudo systemctl start postgres_exporter
sudo systemctl enable postgres_exporter
The 'postgres_exporter' should be running and scrape metrics from the PostgreSQL server. Also, it should be enabled and will be run automatically upon the bootup.
Lastly, run the below command to verify the 'postgres_exporter' service status. Also, ensure that the 'postgres_exporter' is running and enabled.
sudo systemctl status postgres_exporter
You'll receive the output similar to this - the 'postgres_exporter' service is running and it's enabled.
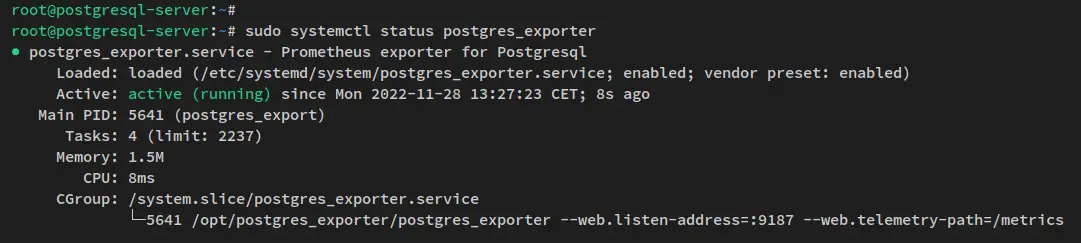
At this point, the 'postgres_exporter' is running on the default TCP port '9187' on the PostgreSQL server. This exposes PostgreSQL metrics to the Prometheus server, but before that, you'll also need to set up the firewalld on the PostgreSQL server.
Setting up Firewall
In this step, you'll set up the firewall to open the default port of 'postgres_exporter' - TCP 9187. After that, you'll verify that the 'postgres_exporter' metrics is accessible via the web browser.
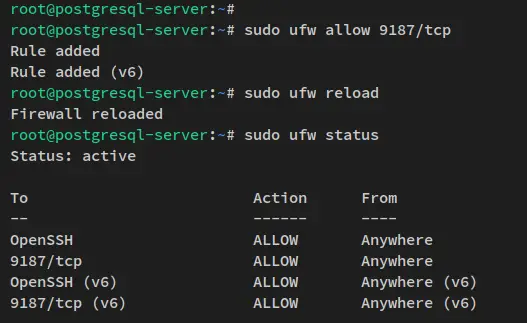
For Ubuntu systems that used UFW as the firewall, run the below ufw command to add port 9187 to the ufw firewall. Then, reload the firewall to apply the changes.
sudo ufw allow 9187/tcp
sudo ufw reload
You can now verify the list of ports on UFW via the ufw command below.
sudo ufw status
You'll receive the output like the following - the postgres_exporter port 9187 is added to the firewalld.
For RHEL-based distributions that use firewalld as the default firewall, run the below firewall-cmd command to add port 9187 to the firewalld. Then, reload the firewalld to apply new changes.
sudo firewall-cmd --add-port=9187/tcp --permanent
sudo firewall-cmd --reload
After that, run the below command to verify that the postgres_exporter port 9187 is added.
sudo firewall-cmd --list-ports
You should now see that port 9187 is added to the firewall.
Lastly, open your web browser and visit your PostgreSQL server IP address followed by the 'postgres_exporter' port 9187 (i.e: http://192.168.5.21:9187/metrics).
You should see the details of PostgreSQL server metrics gathered by the 'postgres_exporter'.
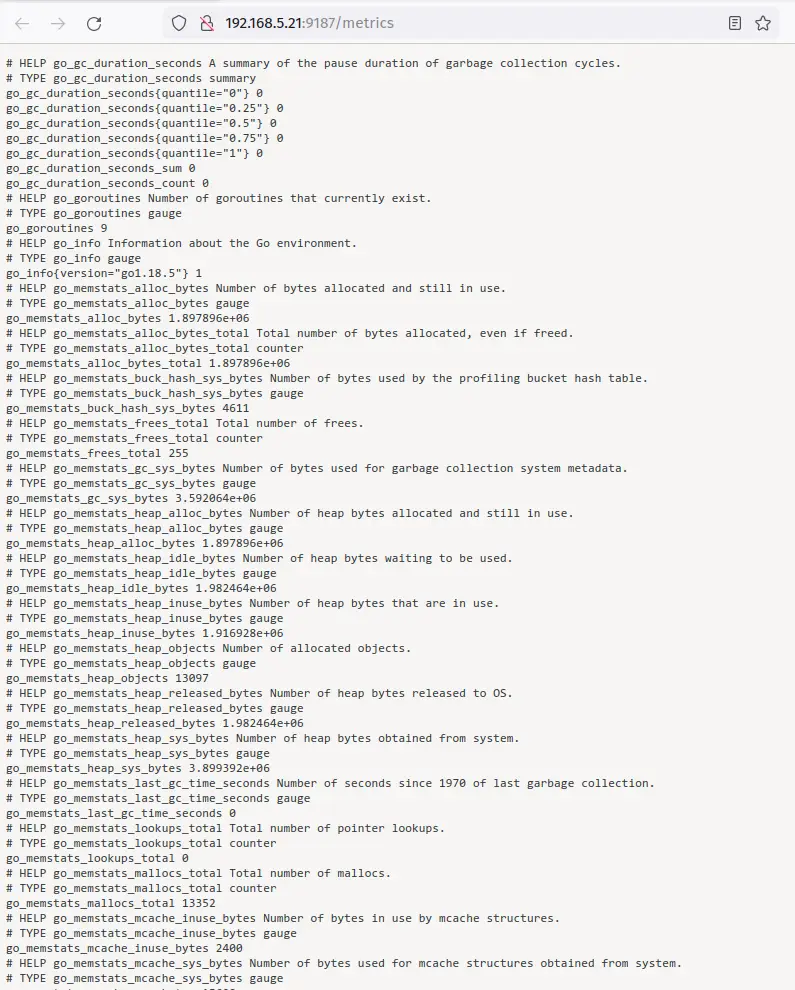
With the firewall configured and the 'postgres_exporter' is accessible, you'll next add the 'postgres_exporter to the Prometheus 'scrape_configs' target.
Adding postgres_exporter to Prometheus
Back to the Prometheus server, then open the Prometheus config file '/etc/prometheus/prometheus.yml' using the below nano editor command.
sudo nano /etc/prometheus/prometheus.yml
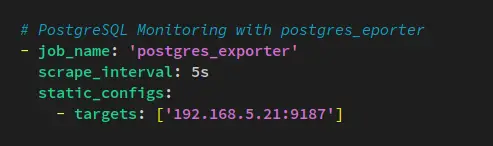
Under the 'scrape_configs' section, add the following lines to the file. In this example, you'll set up a new job for gathering PostgreSQL server metrics with the name 'postgres_exporter', and the target server of PostgreSQL is '192.168.5.21:9187', which is the metrics that are exposed by the 'postgres_exporter' service.
  # PostgreSQL Monitoring with postgres_exporter
  - job_name: 'postgres_exporter'
    scrape_interval: 5s
    static_configs:
      - targets: ['192.168.5.21:9187']
Save the file and exit the editor when you're finished.
Now run the below systemctl command to restart the Prometheus service and apply the changes.
sudo systemctl restart prometheus
With the new scrape_configs created and the Prometheus server restarted, you'll then verify the 'postgres_exporter' via the Prometheus web dashboard.
open up your web browser and visit the Prometheus server IP address followed by the default port 9090 (i.e: https://192.168.5.100:9090).
Log in to the Prometheus server with your username and password, when you have the basic_auth enabled.
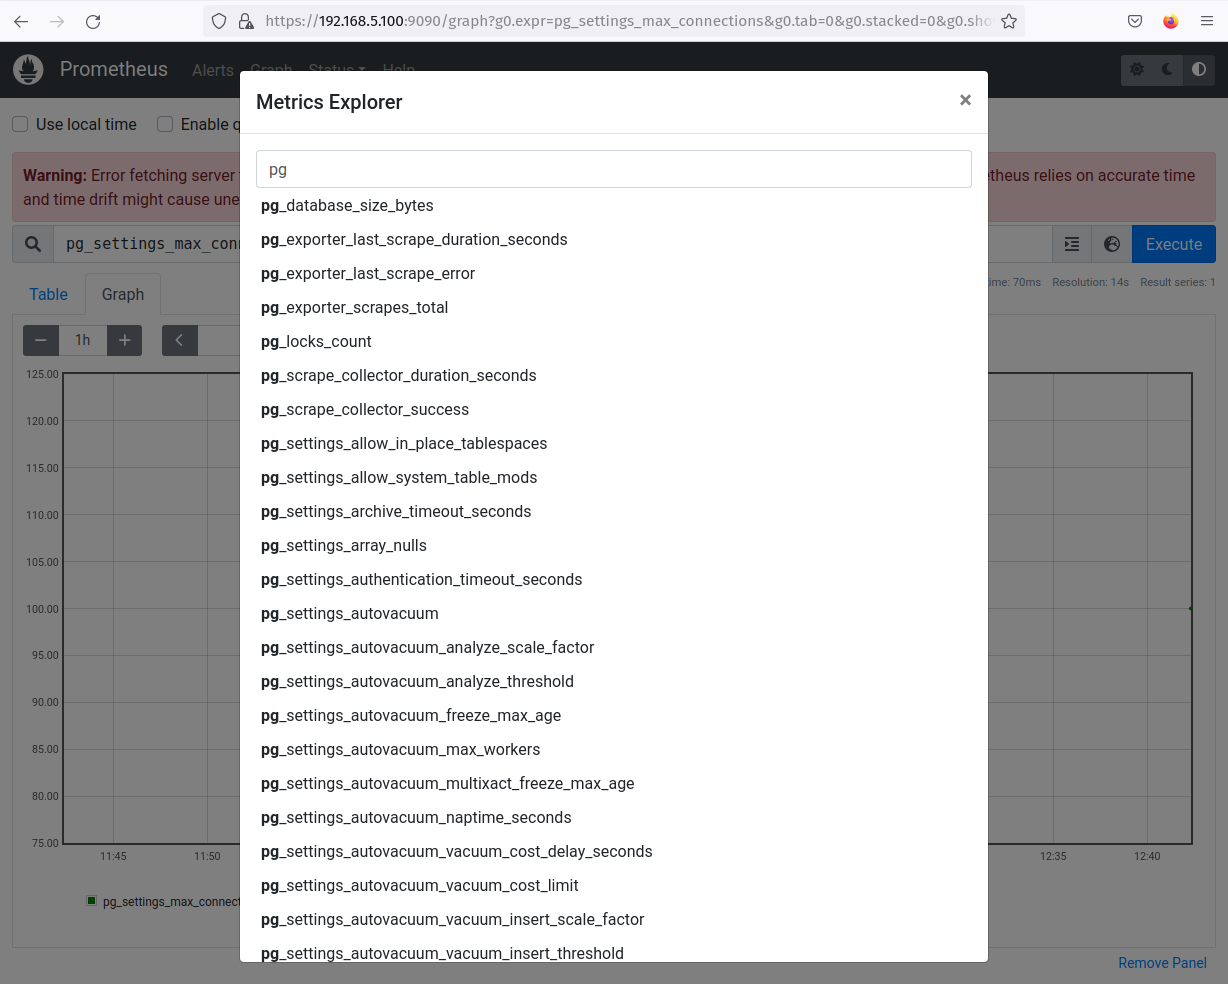
On the Prometheus dashboard, click the 'browser' icon to get the list of Prometheus queries. Then, input 'pg' to filter queries starting with 'pg'. You'll then receive the output like the following screenshot.
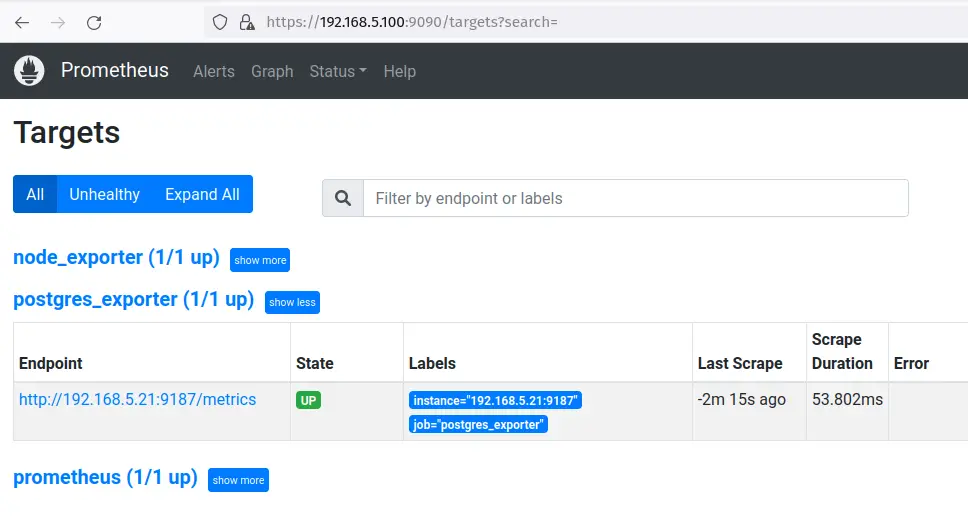
Next, click on the Status menu and select Targets, and you should see the job name 'postgres_exporter' is up and running on the PostgreSQL server with IP address '192.168.5.21:9187'.
Now that the 'postgres_exporter' is added to the Prometheus server and the metric from the PostgreSQL server is now available on Prometheus.
In the next steps, you'll set up the Grafana dashboard for monitoring the PostgreSQL server.
Setting up Dashboard Monitoring via Grafana
Open your Grafana domain name or the server IP address, then log in to the Grafana dashboard using your username and password.
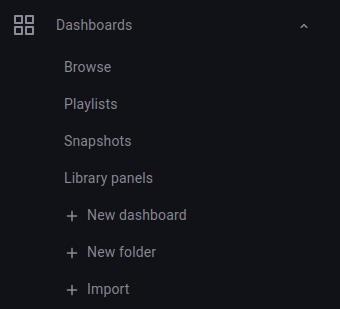
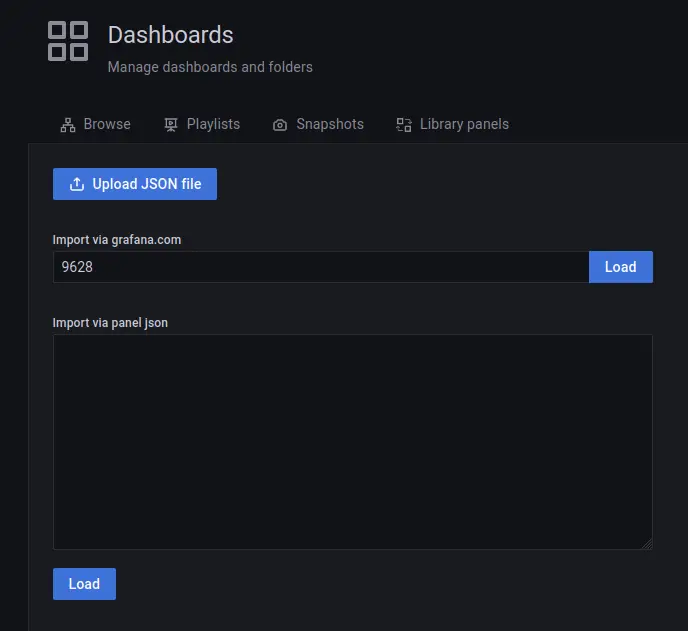
After logging in, click on the Dashboard menu and select Import.
Input the PostgreSQL dashboard id 'xxx' and click Load. The PostgreSQL dashboard id '9628' is available on the Grafana Dashboard repository.
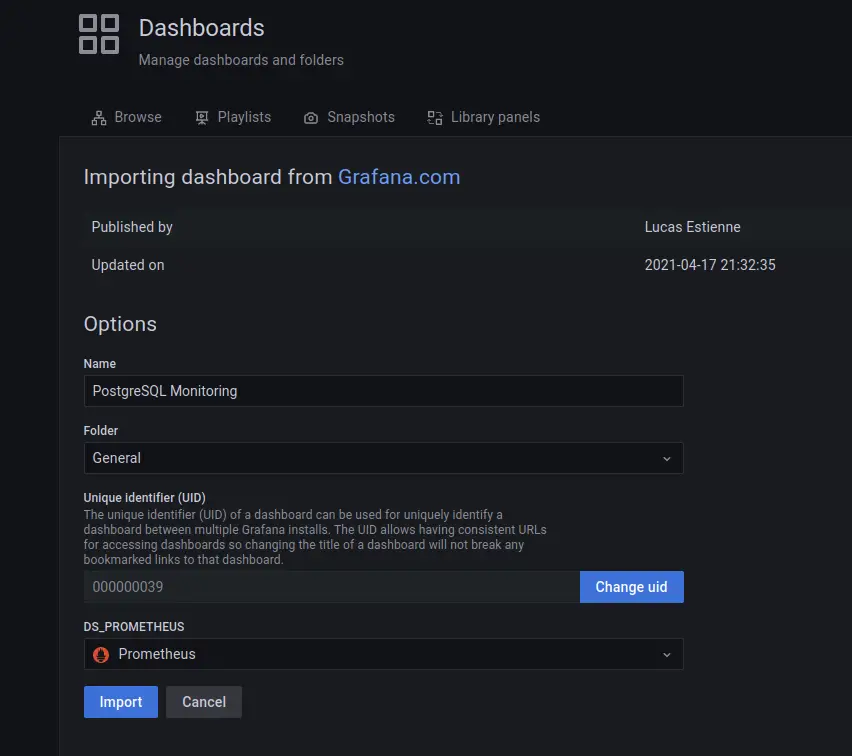
Next, input the new dashboard and select 'Prometheus' as the data source. Then click Import to apply.
In this example, you'll create a new dashboard with the name 'PostgreSQL Monitoring'.
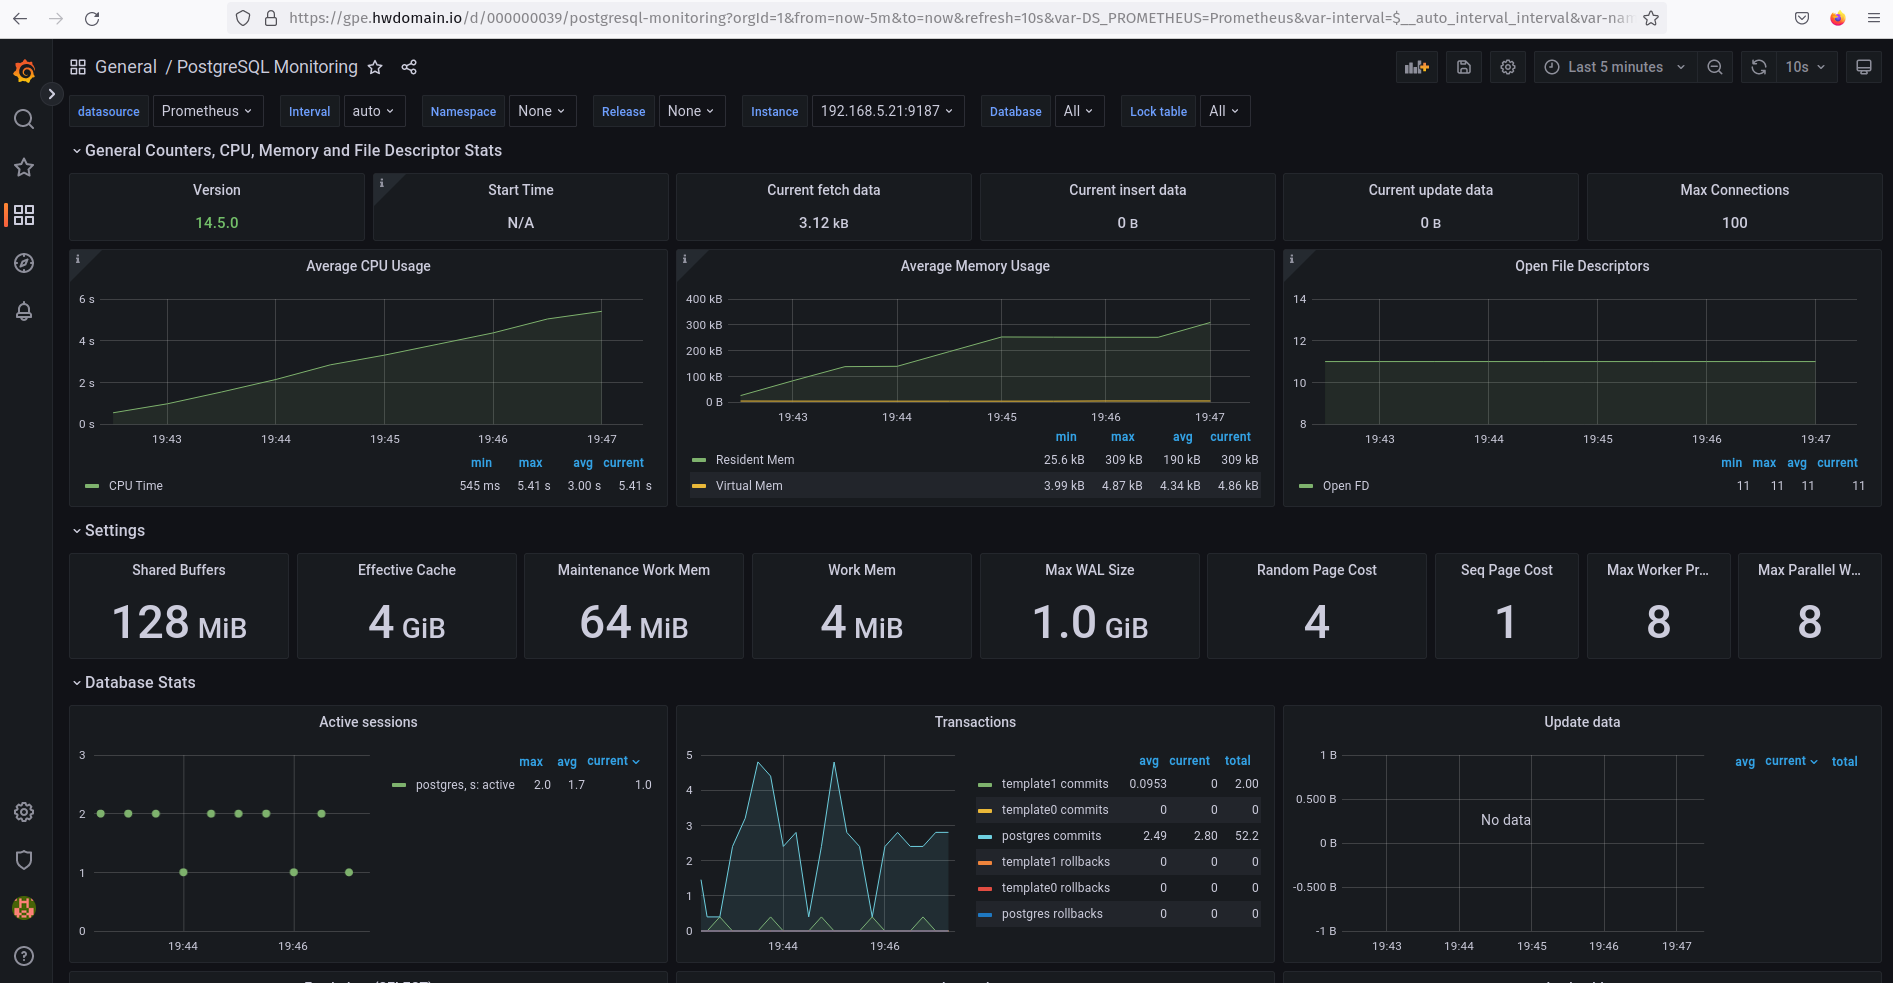
After the Grafana dashboard is imported, check your new dashboard and you should see the PostgreSQL dashboard monitoring as below.
Conclusion
Congratulations! You've now finished the PostgreSQL Server monitoring with Prometheus and Grafana via the 'postgres_exporter'. You've also created a specific dashboard for your PostgreSQL Server monitoring. With this, you can get insightful details about what is going on in your PostgreSQL.
You can now check the Prometheus Community GitHub page to get details of available exporters on Prometheus. This allows you to monitor your applications via Grafana and Prometheus Monitoring Stack.

