
Go execution tracer
Introduction
Ever wondered how are your goroutines being scheduled by the go runtime? Ever tried to understand why adding concurrency to your program has not given it better performance? The go execution tracer can help answer these and other questions to help you diagnose performance issues, e.g, latency, contention and poor parallelization.
The tool is available since go 1.5 and works by instrumenting the go runtime for specific events, such as:
- Creation, start and end of goroutines
- Events that block/unblock goroutines (syscalls, channels, locks)
- Network I/O related events
- Syscalls
- Garbage collection
All this data is collected by the tracer without any kind of aggregation or sampling. In some busy applications this may result in a large file that can be analyzed afterwards by the go tool trace command.
Go already had the pprof memory and CPU profiler, before the introduction of the execution tracer, so why was it added to the official toolchain? While the CPU profiler does a nice job to telling you what function is spending most CPU time, it does not help you figure out what is preventing a goroutine from running or how are the goroutines being scheduled on the available OS threads. That’s precisely where the tracer really shines. The tracer design doc does a pretty good job explaining the motivations behind the tracer and how it was designed to work.
A tour of Trace
Let’s start with a simple “Hello, world” example for tracing. In this sample, we use the runtime/trace package to start/stop writing the trace data to the standard error output. Tracing output will be written to the standard error output.
|
|
This example creates an unbuffered channel and initializes a goroutine that will send the number 42 over this channel. The main goroutine blocks until the other goroutines send a value over the channel.
Running this code with go run main.go 2> trace.out sends the tracing output to the file trace.out, which can then be read with: go tool trace trace.out.
Before go 1.8, one needed both the executable binary and the trace data to be able to analyze the trace; for programs compiled with go 1.8 onwards, the trace data contains all the information needed by the
go tool tracecommand.
After running the command, a browser window opens with some options. Each of those opens a different view of the tracer, containing different information about the program’s execution.
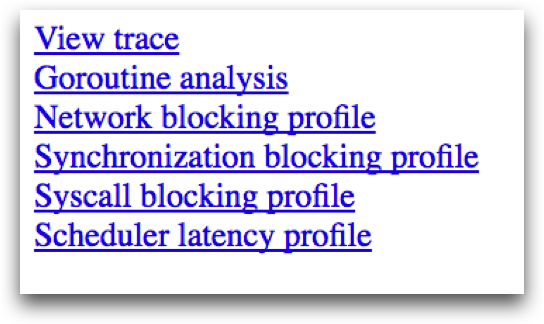
View trace
The most complex, powerful and interactive visualization shows a timeline of the entire program execution. This view displays, for example, what was running on each of the virtual processors and what was blocked waiting to run. We will dive deeper into this visualization later in this post. Only works on chrome.
Goroutine analysis
Shows how many of each kind of goroutines were created during the entire execution. After selecting a kind it is possible to see information about each goroutine of that kind. For example, how long each goroutine was blocked while trying to acquire a lock on a mutex, reading from the network, running and etc.
Network/Sync/Syscall blocking profile
These contain graphs that displays how long goroutines spent blocked on each of these resources. They are pretty close to the ones available on memory/cpu profiler on pprof. This is the perfect place to look to investigate lock contentions, for example.
Scheduler latency profiler
Provides timing for scheduler level information showing where time is most spent scheduling.
View Trace
Clicking on the “View trace” linking, one is presented with a screen full of information about the whole program execution.
Press “?” to get a list of available shortcuts to help navigating the trace.
The following image highlights the most important parts and each section is described below:
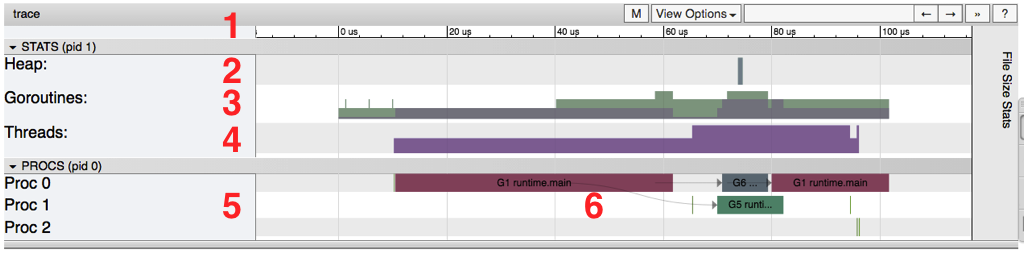
Timeline
Shows the time during the execution and the units of time may change depending on the navigation. One can navigate the timeline by using keyboard shortcuts (WASD keys, just like video games).
Heap
Shows memory allocations during the execution, this can be really useful to find memory leaks and to check how much memory the garbage collection is being able to free at each run.
Goroutines
Shows how many goroutines are running and how many are runnable (waiting to be scheduled) at each point in time. A high number of runnable goroutines may indicate scheduling contention, e.g, when the program creates too many goroutines and is causing the scheduler to work too hard.
OS Threads
Shows how many OS threads are being used and how many are blocked by syscalls.
Virtual Processors
Shows a line for each virtual processor. The number of virtual processors is controlled by the GOMAXPROCS environment variable (defaulting to the number of cores).
Goroutines and events
Displays where/what goroutine is running on each virtual processor. Lines connecting goroutines represent events. In the example image, we can see that the goroutine “G1 runtime.main” spawned two different goroutines: G6 and G5 (the former is the goroutine responsible for collecting the trace data and the latter is the one we started using the “go” keyword).
A second row per processor may show additional events such as syscalls and runtime events. This also includes some work that the goroutine does on behalf of the runtime (e.g assisting the garbage collector).
The image below shows information obtained when selecting a particular goroutine.
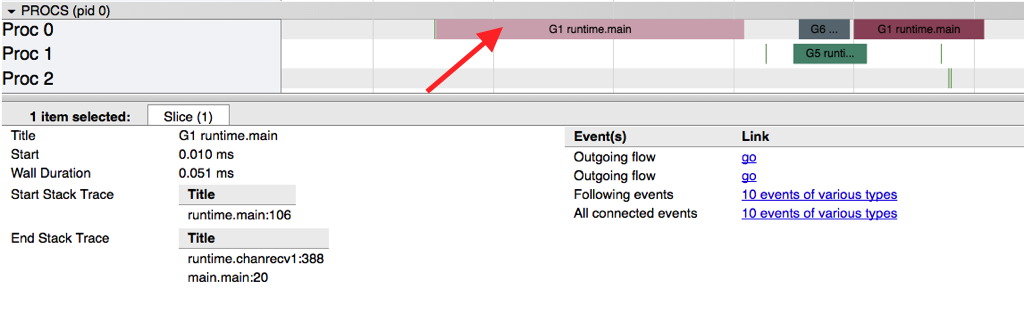
This information includes:
- Its “name” (Title)
- When it started (Start)
- Its duration (Wall Duration)
- The stack trace when it started
- The stack trace when it finished
- Events generated by this goroutine
We can see that this goroutine created two events: the tracer goroutine and the goroutine that started to send the number 42 on the channel.
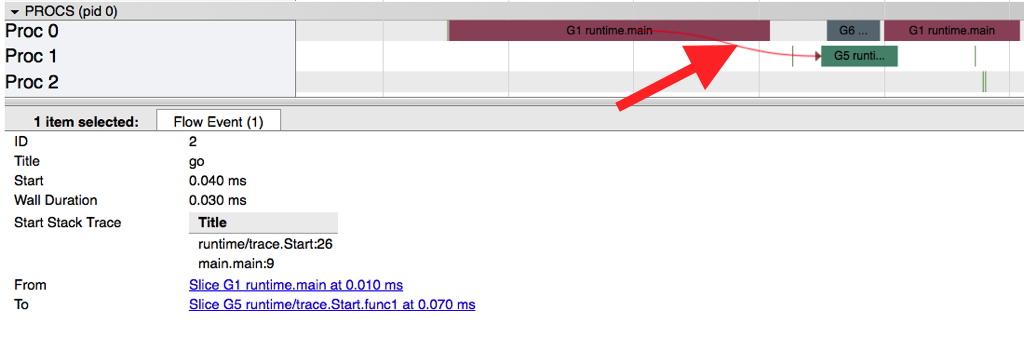
By clicking on a particular event (a line in the graph or by selecting the event after clicking on the goroutine), we can see:
- The stack trace when the event started
- The duration of the event
- Goroutines involved in the event
One may click on these goroutines to navigate to their trace data.
Blocking profiles
Another particular view available from a trace are the network/synchronization/syscall blocking profiles. Blocking profiles shows a graph view similar to those available on memory/cpu profiles from pprof. The difference is that instead of showing how much memory each function allocated, those profiles show how long each goroutine spent blocking on a particular resource.
The image below shows the “Synchronization blocking profile” for our sample code.
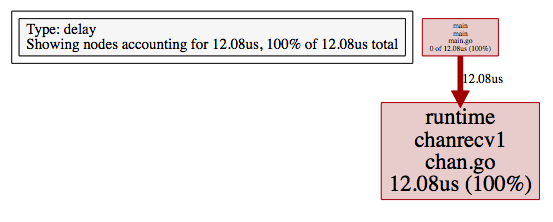
This shows us that our main goroutine spent 12.08 microseconds blocked receiving from a channel. This kind of graph is a great way to find lock contentions, when too many goroutines are competing to obtain a lock on a resource.
Collecting Traces
There are three ways to collect tracing information:
- Using the
runtime/tracepkg
This involved calling trace.Start and trace.Stop and was covered in our “Hello, Tracing” example.
- Using
-trace=<file>test flag
This is useful to collect trace information about code being tested and the test itself.
- Using debug/pprof/trace handler
This is the best method to collect tracing from a running web application.
Tracing a web application
To be able to collect traces from a running web application written in go, one needs to add the /debug/pprof/trace handler. The following code sample shows how this can be done for the http.DefaultServerMux: by simply importing the net/http/pprof package.
|
|
To collect the traces we need to issue a request to the endpoint, e.g, curl localhost:8181/debug/pprof/trace?seconds=10 > trace.out. This request will block for 10 seconds and the trace data will written to the file trace.out. A trace generated like this can be viewed the same way as we did before: go tool trace trace.out.
Security note: beware that exposing pprof handlers to the Internet is not advisable. The recommendation is to expose these endpoints on a different http.Server that is only bound to the loopback interface. This blog post discusses the risks and has code samples on how to properly expose pprof handlers.
Before gathering the trace, let’s start by generating some load on our service using wrk:
1
|
$ wrk -c 100 -t 10 -d 60s http://localhost:8181/hello |
This will use 100 connections across 10 threads to make requests during 60 seconds. While wrk is running, we can collect 5s of trace data using curl localhost:8181/debug/pprof/trace?seconds=5 > trace.out. This generated a 5MB file (this can quickly grow if we are able to generate more load) on my 4 CPU machine.
Once again, opening the trace is done by the go tool trace command: go tool trace trace.out. As the tool parses the entire content of the file, this will take longer than our previous example. When it completes, the page looks slightly different:
1 2 3 4 5 6 7 8 |
View trace (0s-2.546634537s) View trace (2.546634537s-5.00392737s) Goroutine analysis Network blocking profile Synchronization blocking profile Syscall blocking profile Scheduler latency profile |
To guarantee that the browser will be able to render everything, the tool has divided the trace into two continuous parts. Busier applications or longer traces may require the tool to split this in even more parts.
Clicking on “View trace (2.546634537s-5.00392737s)” we can see that there is a lot going on:
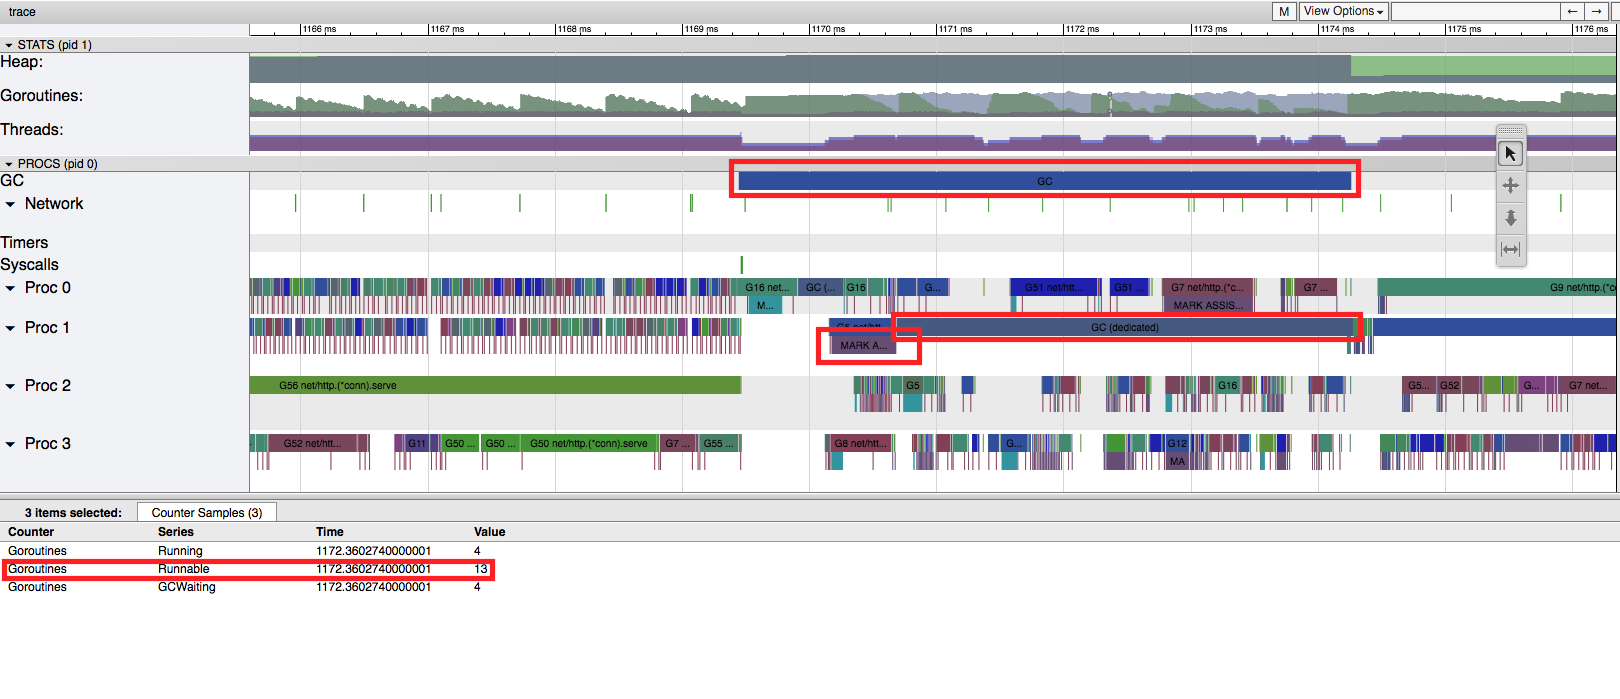
This particular screenshot shows a GC run that starts at between 1169ms and 1170ms and ends right after 1174ms. During this time, an OS thread (PROC 1) ran a goroutine dedicated to the GC while other goroutines assisted in some GC phases (these are displayed on lines bellow the goroutine and are read MARK ASSIST). By the end of the screenshot, we can see that most of the allocated memory was freed by the GC.
Another particular useful information is the number of goroutines that are in “Runnable” state (13 on the selected time): if this number becomes large over time this can indicate that we need more CPUs to handle the load.
Conclusions
The tracer is a powerful tool for debugging concurrency issues, e.g, contentions and logical races. But it does not solve all problems: it is not the best tool available to track down what piece of code is spending most CPU time or allocations. The go tool pprof is better suited for these use cases.
The tool really shines when you want to understand the behavior of a program over time and to know what each goroutine is doing when NOT running. Collecting traces may have some overhead and can generate a high amount of data to be inspected.
Unfortunately, official documentation is lacking so some experimentation is needed to try and understand what the tracer is showing. This is also an opportunity for contributions to the official documentation and to the community in general (e.g blog posts).
André is a Sr. Software Engineer at Globo.com, working on Tsuru. @andresantostc on twitter, https://andrestc.com on the web