
Creating Your Own Reports in Your Applications: Getting Started with the Telerik Web Report Designer

Here’s how to use the Embedded Web Report Designer to create the reports you need right in the applications where you’ll use them.
This probably sounds familiar: You’re working in an application and need additional information—specifically, you need to view a report with the data you need to make a good decision. So you leave your application, surf over to some reporting system, find the report, check the data … and then come back to the application you just left to actually “do the work.”
In a better world, that report would be available from your application and you wouldn’t have to leave the application to get the information you need. Telerik Report Viewer lets you do that.
But that report will only be useful if it has the information you need—and no one knows better than you what that information should be. In that better world, you’d create the report you need. If the developers who are building your applications have embedded the Telerik Web Report Designer into your application, then you can do that, too, and (like viewing your report) do it without leaving your application. Once you’ve created your report, you can then access it from within your application whenever you need it.
You don’t even have to start creating your report from scratch because the Telerik Web Report Designer will let you enhance an existing report that, perhaps, isn’t quite right to create the report you really need.
Now, this would be the ideal world.
Getting Started
It’s up to your application’s developers where and how Telerik Report Designer will be made available in your application (the designer could open with a mouse click on a button, from a menu choice, through clicking on a hyperlink or, really, through any interaction with your application).
When the designer appears, it will probably show you, in design mode, the last report used in the application (if there is no report yet defined for the application, the report designer will show a new, blank report).

Now you have a choice—you can either modify an existing report or create a new one.
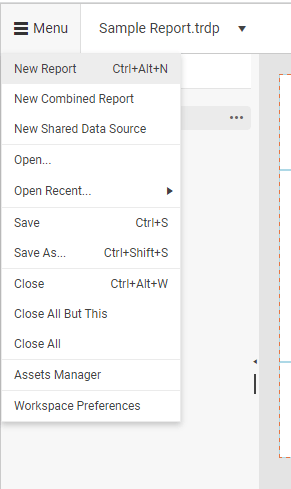
Starting a new report is easy: Click on the hamburger menu in the upper left corner of the Report Designer menu (it’s conveniently labeled “Menu”) and select the New Report menu choice. That will open the Create a Report dialog. In the dialog, enter the name you want to give your report and click the Save button to create your report.
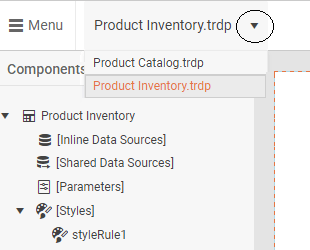
If you decide to use an existing report as the start point for your new report, you can either enhance the report being displayed or pick another report. To pick another report, first click the dropdown button by the name of the currently displayed report to get a list of available reports and then pick the report you want to use as your start point.
Hint: If you start creating your new report by modifying an existing report then, after you’ve picked the report you want to start with, click on the hamburger menu again and use the Save As command to save the report under a new name.
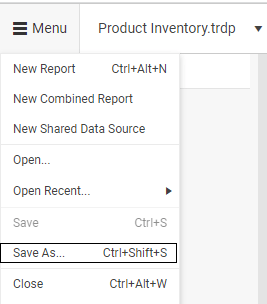
After all, if a report is a good starting point for one new report, it could easily be the start for another new report. By using the Save As option, you ensure that old report will stick around so you can use it as the base for some other report. In addition, by using Save As you protect yourself: If your changes don’t work out for you, you can always reopen the original report and start over.
Connecting to Data
Regardless of how you get your report started, you’re going to need some data. That can be one of your organization’s databases or a CSV (Excel) file or a variety of other data sources. To see what data sources have been set up for you, just click on the Explorer tab in the panel left of the main designer window, just below the hamburger menu.
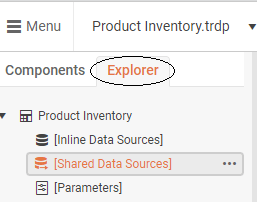
In the TreeView on that tab, find the Shared Data Sources Option, and then click on the three dots to its right. That will reveal a menu with an Add Existing Shared Data Source menu choice.
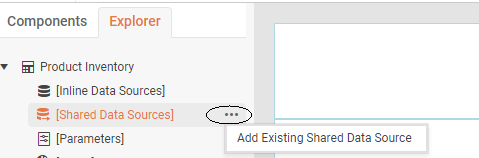
Click on the Add Existing Shared Data Source menu choice to show the data sources that have been set up for you. You can pick a data source based on its name or its description (and don’t worry if you pick the wrong data source, you can always change your mind later and switch to another data source). If you’re not sure which data source will work for your report, you can contact the developer who set up the report designer in your application to help you decide which data source is your best choice.
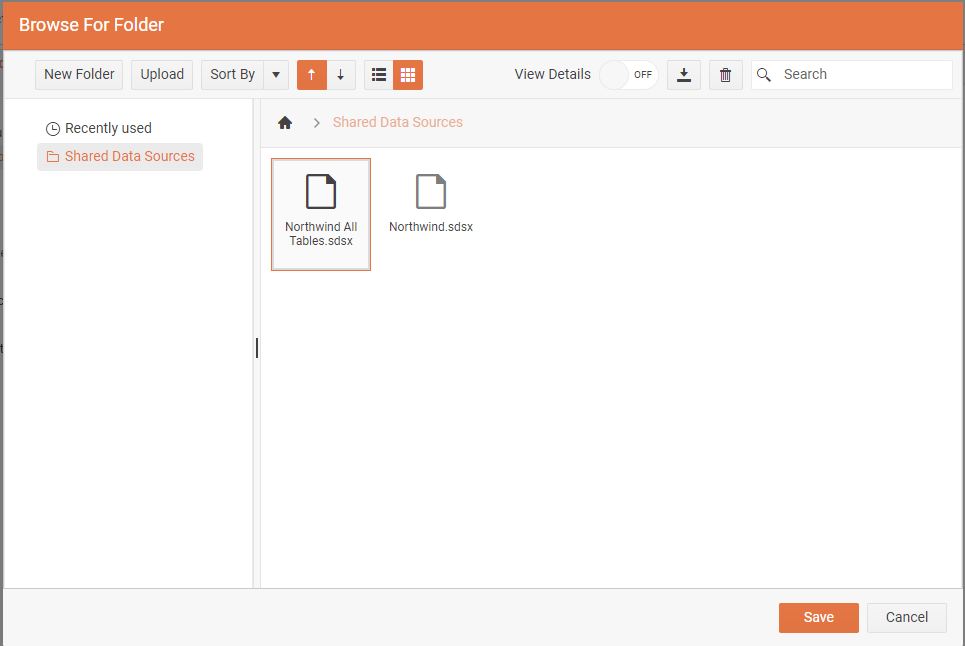
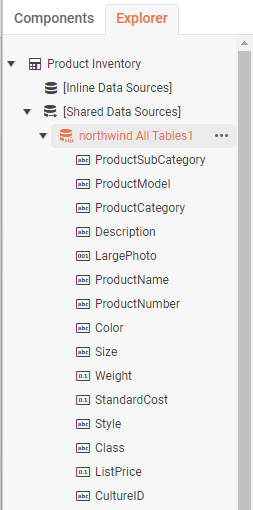
Once you’ve picked a data source, click on the data source to select it and then click on the Save button to attach the data source to your report. You’ll be taken back to the Explorer tab which will now show the fields from that data source that you can use in your report.
It’s very likely that the developers who created your application will have set up the report designer with data sources relevant to the application you’re working in. If you can’t find a data source that works for the report you want, you can create a new data source. However, you’ll probably need to enlist the support of your IT department to do that (especially if you want to connect to one of your organization’s databases).
But, for now: Congratulations! You’re ready to start creating your report. As you create your report, you’ll want to see how you’re doing. To preview your report as you work, just click the Preview button in the upper right corner of the report. When your report is displayed, that Preview button will change to a Design button—just click that button to return to designing your report.
Ready to Take Advantage of Embedded Reporting?
Progress Telerik Reporting provides all the tools you need to embed the rich, interactive reports your users need in order to analyze and understand their data right into your users’ applications (including letting your users export the results into more than 15 formats, either to distribute or integrate with other analysis tools). Telerik Reporting then lets you go further and empower your users with a fully functional Web Report Designer to create the reports they want without ever leaving the applications where they’ll use their reports.
You can leverage these easy-to-use tools in both any client-side web application environment (HTML5/JS, Angular, React, Vue or Blazor) and any .NET application (web or desktop: ASP.NET Core, ASP.NET MVC, ASP.NET AJAX, WinForms and UWP).
If you still have not tried it, you can start a free trial to take a closer look. A renowned support service and an array of resources will help you along the way.

Peter Vogel
Peter Vogel is a system architect and principal in PH&V Information Services. PH&V provides full-stack consulting from UX design through object modeling to database design. Peter also writes courses and teaches for Learning Tree International.
Related Posts
Comments
All articles
Topics

Latest Stories
in Your Inbox
Subscribe to be the first to get our expert-written articles and tutorials for developers!
All fields are required