If you’re in the ecommerce business, you already know that users often abandon their carts at the checkouts. In fact, studies indicate that the average rate of cart abandonment is 67.91%, although this can be as high as 80% in some cases. Annoying, right?
Why are users doing that? Well, the answer lies in your analytics.
People abandon checkouts for various reasons, and those reasons can vary by user demographic, geographic location and more. It can even be the shock of unexpected shipping costs, or that users aren’t convinced their sensitive details are secure on your website.
And of course, UX plays a huge role in that too. Users hate:
- broken functionality
- confusing checkout flows
- signing up before checking out.

Three out of four checkout abandonments are due to a sub-optimal user experience, but which of these causes is eating into your revenue?
Tools like Google Analytics, Hotjar, Fullstory, Crazy Egg and Optimizely can help us decipher what’s causing our shopping cart abandonments, and come up with effective solutions to improve UX.
In fact, you can easily recover 5–10% of your abandoned carts. Isn’t that cool?
First we’ll detect where users are leaving our website, then why they’re leaving our website, then how we can improve the UX so that future users don’t leave our website. The result? More revenue!
It’s also worth noting that while 59% of shopping experiences happen on mobile, only 15% of dollars are spent on mobile. This indicates that some of the most common UX shortcomings are mobile-specific.
What Tools Can We Use to Analyze User Behavior?
By analyzing user demographics and user behavior, you can improve your website’s user experience. Even though there are many tools that can allow you to do this, I’ll run through this tutorial using Google Analytics (free) and Crazy Egg (affordable) today.
With a quick setup, Google Analytics will help you to understand your visitors as they interact with your website, and from this we can identify where exactly visitors are abandoning our websites.
Crazy Egg is an advanced heatmap tool that allows you to observe those drop-offs in more detail, and to establish why users left and didn’t convert. With Crazy Egg, you’re able to dig deeper into that.
Setting up Conversion Funnels in Google Analytics
A conversion funnel is the journey a customer takes as they convert. We can use Google Analytics to record and analyze these conversion funnels, which begins with you inserting a few lines of JavaScript code on your website (to enable the tracking), although some ecommerce platforms help you to set this up without any code.
Now we need to set up a funnel to measure the conversion rate.
Step 1: Goals
First, log in to your Google Analytics dashboard and click on the Admin tab in the left-hand sidebar, then Goals.
Step 2: Creating a New Goal
Click the + New Goal button, and choose the relevant Goal template, which in this case is Place an order.
After that, click on the Next Step button.
Step 3: Describing the Goal
Next, give your Goal a name, and under the Type heading, choose what needs to be happen to trigger this Goal. In this case, the Goal is triggered when the user reaches the checkout confirmation screen, so choose Destination as the Goal Type.
Step 4: Goal Details
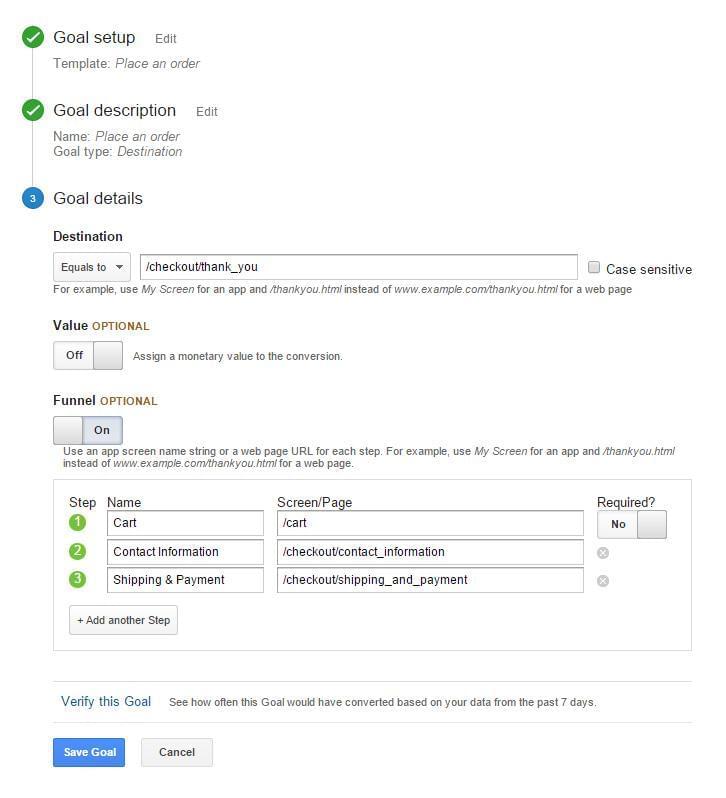
In Goal Details, you’ll need to reference the destination URL. This is the web page that visitors are taken to after they complete their checkout. If you’re using Shopify as your ecommerce CMS, this will most likely be /checkout/thank_you/, although it’ll vary by CMS.
Leave the monetary Value turned off and the Funnel option on.
Next, list all of the web pages (and their URLs) that shoppers navigate through during the checkout flow. The example below represents a typical setup for an ecommerce website hosted on Shopify.

Click the Verify this Goal button before the Save Goal button.
Identifying Where Users Are Abandoning the Cart
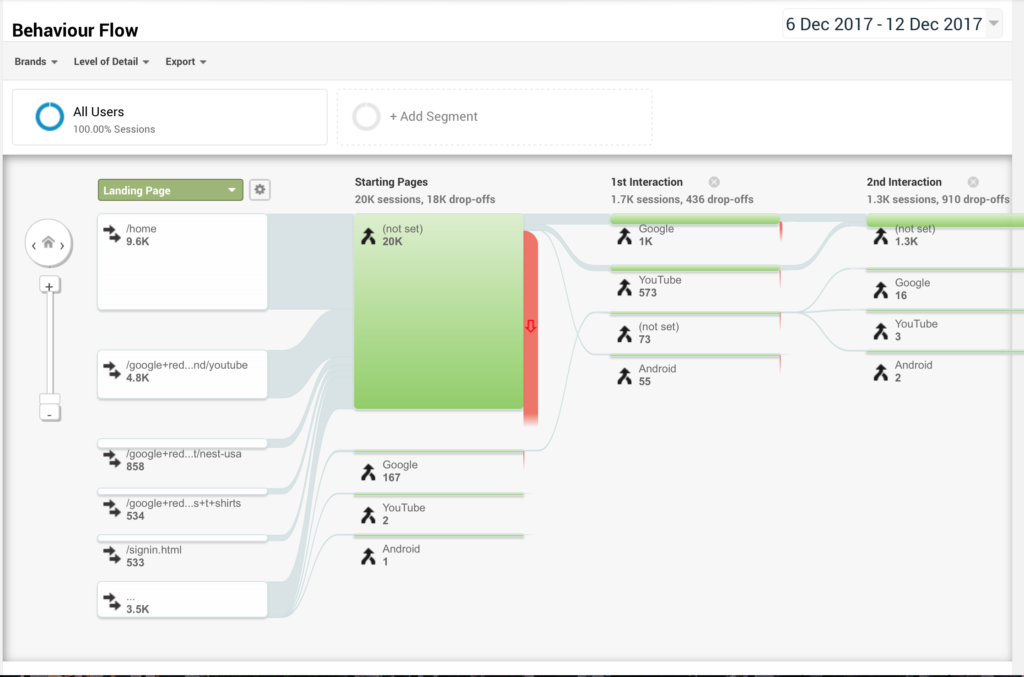
Navigate to Behavior → Behavior Flow from the left-hand sidebar. This report will be a visualization of how long users are spending on this conversion flow, and where they’re abandoning it. If you notice that a certain web page is falling short, that’s the web page where your user experience may need some work.

Next, we’ll use Crazy Egg’s heatmap tools to identify what’s going on.
Setting up Crazy Egg
Now that we know where users are dropping out of the conversion, we can use Crazy Egg’s heatmap tools to try to identify why. To begin, create an account at Crazy Egg and copy your JavaScript tracking code snippet from here into the <head> section of your website’s code (as you did with Google Analytics). Crazy Egg will offer more details into how to do this, if you’re not too savvy with code.

Analyzing the Heatmaps
After about three days, your heatmaps should have enough data that you can reach sensible conclusions. There are three types of heatmaps — “click”, “scroll” and “move”.
By looking at these heatmaps, you can reach conclusions about what areas users are looking at the most, and combined with your knowledge about where users are having trouble (that we identified via Google Analytics), those conclusions can be better informed.
Crazy Egg’s user recording tools will even record the users’ entire session, so that you can play it back and learn from it. After you’ve identified which areas users are spending the most time on, you can watch these user recordings, focusing your attention on those areas.
You may find some useful insights as to why users are bouncing off those troublesome web pages, and then you can begin to figure out how best to improve the user experience of those pages. Crazy Egg also offers A/B testing features, so you can test multiple solutions to see which variation improves your conversion metrics the most!
Conclusion
As you can see, Google Analytics and Crazy Egg make a great couple. In my next article I’ll show you how to use Crazy Egg’s heatmap tools and A/B testing tools in more detail, to help you make continuous improvements to your checkout experience, and thus reduce the amount of abandoned checkouts. If you can reduce abandoned checkouts by even a small amount, that’s still revenue you’ve gained!
 Ash Ome
Ash is an eCommerce consultant and founder of New York-based creative commerce agency Motif, helping eCommerce businesses with conversion-driven solutions. Ash is also building Checkoutify, a system to help thwart abandoned checkouts on eCommerce stores.


