Greetings Rubyists!
This week I'll be hitting a few different topics, short and fast. Here's what's in store:
- Memory "leaks"
- The SQL Shotgun
- Oversaturation and backpressure in the GVL and Puma
- Maintaining rack-mini-profiler
- The state of the Rails job market
Let's get started.
Memory "leaks" in Ruby
Ruby, in practice, does not leak memory. That is to say, I have never in 10 years of practice seen the Ruby virtual machine "lose track" of a Ruby object and fail to free that memory once the Ruby object is garbage collected.
When people tell me they "have a memory leak", what they're actually usually saying is "our memory usage is increasing over time". This is quite different from a memory leak. Unfortunately, increases in memory usage over time have a wide variety of causes, which can be difficult to track down. However, none of these causes is as difficult to solve as an actual memory leak, so I suppose we should be thankful!
A true memory leaks happens when something has allocated memory and then forgotten about it, therefore never freeing it back to the operation system even when it should have. While this is exceedingly rare in the Ruby VM, it does happen from time to time in native C extensions.
True memory leaks are actually quite easy to notice in production. When an application has a true memory leak, memory usage increases linearly with the number requests served or jobs executed. Your server's memory graph looks like a line that goes straight up and to the right without any stopping in sight.
This is the first place that people become mistaken about whether or not they have a memory leak: their server runs out of memory quickly, causing an out-of-memory killer to kill their processes, so we don't know if this process would have stabilized its memory usage after another few hours of traffic or not. Usually, it will.
If a process is killed after just a few hours of traffic, we can't really say for sure if it has a leak or not just from this information alone, because we did not observe the memory usage pattern for long enough.
So, instead of making judgements off of limited data, let your processes run free a bit. Put them on larger servers with more memory, and let them live for 6 hours or more. Does the growth in memory usage slow over time, or even halt? You don't have a memory leak.
In Ruby, we also cannot call it a "memory leak" if the language is just following it's own rules. For example, constants and any object referred to by a constant will never be garbage collected. This does make sense if you think about it. Constants are all "root objects", that is, they are accessible from the current scope all the time, so they cannot be GC'd.
A not-uncommon problem is storing a collection in a constant and letting it grow infinitely: caches, for example. You must be extremely careful to never let random, arbitrary or user-generated keys into a cache inside of a constant - there should always be a limit to a cache's size. You can enforce cache size limits in memory by using something like ActiveSupport's MemoryStore, which can limit the number of entries in a cache.
Another confusion around memory "leaks" is when Ruby retains a lot of memory at one time.
Consider this loop:
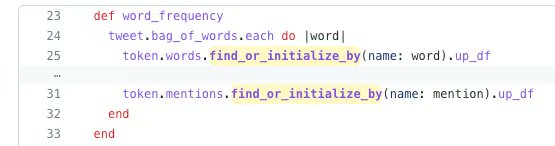
Each time this loop executes, a new object is added to the memoized array of "words". If you do this enough times, say over 1 million records in a background job, you can easily explode the memory usage of your application as the words array grows to a million objects.
Instead, in this case, you can find_or_initialize using the Class name, which means that the object is not memoized and leaves the current scope as soon as we go to the next iteration of the loop.
This past week at Gusto, we added the debug gem, by Koichi Sasada, Ruby core team member. However, we added it right into the gemfile - not just into the development group. That meant that it was running in production.
Unfortunately this gem wasn't designed for that, and ended up greatly increasing our memory usage. We found out by checking which commit caused a big bump in our Datadog memory metrics - an excellent feature that everyone should turn on. This information is available in New Relic also in the "Ruby VM" tab (although they rearranged that tab recently to be per-host, and I hate it).
The SQL Shotgun
Sometimes, I run out of ideas to speed up a Rails controller action.
I've looked at the flamegraph, looked at the production APM data, and I just don't see any glaring flaws. But we need to make this endpoint faster to reach our goals.
At that point, I start what I call "The SQL Shotgun". Database access and querying is roughly 80% of the time of every controller action, so, proceeding from this axiom, if we start looking at how we access the database in our controller action, we should be able to start finding some performance gains.
So, the Shotgun approach is:
1. Make a request to your backend.
2. Read the logs for what SQL was executed.
3. Think about every query, what data it gets, whether that data was already fetched, try to get rid of every query you can
You end up learning a lot about how the application queries and organizes data, and you end up eventually getting some nice improvements in speed as well. Just make fewer queries, and things get faster.
It's a bit of a "desperation move" after the low-hanging fruit have been picked though: I use this technique when I have no other good hypotheses about what can make things faster.
GVL Oversaturation and Backpressure
One of the big changes we pushed in Puma 4 was a change in the default number of threads we would use if the app was running on MRI/CRuby. It was previously 16, and we reduced it to 5.
It would seem a strange thing to do: more is better, right? We want more concurrency, not less.
When you have the Global VM Lock, there is a trade-off between throughput and latency. As we increase the thread count, we increase the theoretical maximum throughput of our application server, but we also increase the average latency of each request.
This trade-off is due to how the GVL limits concurrency. The only operation in practice which can be done in parallel is waiting on I/O, so the "steepness" of this trade-off is in proportion to how much of the application is waiting on I/O.
What we've found, both through computing theory and in practice with benchmarks, is that it is very rare for a Rails application to spend more than 50% of it's time waiting on I/O, and so it is very rare that an application benefits from using more than 5 threads with Puma.
The diminshing returns of additional concurrency when parallelism is limited is summarized by Amdahl's law. You'll notice that, in Amdahl's Law, when the parallelizble portion of the workload is 50%, gains to additional concurrency tend to vanish after about 5 CPU threads. That's a big reason why we chose the 5 thread default in Puma.
Having too many threads in Puma leads to an even worse scenario when you combine it with cluster mode (multiple processes): a lack of backpressure.
Consider a Puma cluster with 4 child workers and 100 threads each. Each worker will, in effect, try to pick up new work whenever it can, because it has a nearly-unlimited threadpool.
Unfortunately, this means heavily-saturated Puma workers, with lots of busy threads, can pick up new requests instead of low-saturation Puma workers with low numbers of busy threads. When two processes are listening and trying to accept a new connection on a socket, the operating system decides randomly which process accepts the connection.
Limiting the size of one's threadpool creates backpressure on the entire web queueing system. Once a Puma process threadpool is full, it will stop accepting requests. If requests are not being accepted, they will queue in the socket, which increases your observed request queue time, which is usually (if you're doing it right) how you signal your autoscaler to scale up. Puma configurations with super-high threadcounts will not show high amounts of request queueing, which means your autoscaler fails to work properly.
Maintaining rack-mini-profiler
I've been added as an issue triager on rack-mini-profiler. I hope this can lead to heavier involvement in the project over time. I've got some long-held ideas for new features, and I'd like to get the issue count down and some open PRs merged.
The Rails job market is the strongest across all languages
Recently this story went around: Rails engineers get the most interview requests of any software engineering discipline.
I just can't stop thinking about everyone who told me in 2015 and 2016 to stop investing in Ruby, it was on the way out, Node is the future. I'm so, so glad I didn't listen, and instead trusted that a language that was fun to write and useful to businesses would continue to thrive. It has. The funny part about this mismatch between supply and demand is that it's entirely created by developers: people who thought that Ruby wasn't marketable enough tried to skate ahead of the puck and move on to the next hype train. Imagine switching to Scala in 2012 after you heard Twitter rewrote their backend from Ruby in Scala. Whoops.
Do what you love, fight for what you love.
Workshops and Gigs From May Onward
I continue to be available for additional in-person or remote workshops in 2023. You can also take a self-paced version here, discounts available for quantities of 20 or more.
I'm also open to short engagements from May onward - for now, my main focus continues to be Gusto but I can be available for a few days to weeks at a time for short-term work on performance. Work can include building roadmaps, auditing dashboards, solving specific problems, reducing LCP with an eye to improving your search ranking, and more.
Until next week,
-Nate
|
|
|
|