
Understanding the collective impact of experiments

Autonomous experimentation is an integral part of Etsy’s product development cycle. Each team designs and runs its own experiments to assess how users will respond to new features and new ideas, be it improved design, added functionality, novel algorithms, and so on. Measuring the impact of user-facing changes ensures that we are continuously enhancing Etsy's customer experience, and it also informs the company's strategic discussions and financial planning.
Widespread use of experimentation empowers our teams to learn and make decisions on their own, but it also creates a complex ecosystem, where many different teams end up experimenting concurrently on shared pages or closely related products. This opens the door to interactions and dependencies, which can render isolated results from individual experiments misleading. In order to understand the overall business impact of the changes made across all teams, we need to start thinking of experiments as being part of a larger common system, and look at their results in a more holistic fashion.
Isolated experiments can miss the bigger picture
To assess the effect of a change, teams typically conduct experiments known as A/B tests, where a random group of users exposed to a new experience (the treatment variant) is compared to a group of users exposed to the old one (the control variant). Teams that want to run these tests use Etsy’s accessible experimentation platform to set them up and manage them on their own, independently of other teams. It's common at Etsy for multiple experiments to be running simultaneously on the same traffic of users and pages. This autonomy is one of the system's key features: by reducing organizational bottlenecks, it lets many teams make decisions in parallel, speeding up the process of learning and ideation all around.
An individual experiment only captures the marginal contribution of its one associated change. For an experimenter, that may be all the data they need. But as a business, and an engineering organization, we want to be able to validate the entire ensemble of changes our teams are looking to make. Greater autonomy and throughput mean we have to be more vigilant about our changes all pulling in the right direction. It would be naive to assume that the impact of the whole was just the sum of the isolated parts.
When disparate treatments are shown to a user at the same time, or in the same workflow, there is obviously some potential for those treatments to interact. Negative interactions occur when two or more treatments, both with a positive impact when presented on their own, have a lesser (or even negative) impact when presented together (Figure 1).

Sometimes negative interactions can be forestalled with more transparent communication between teams, but that only goes so far. Consider how many different pathways — including organic searches, ads, and recommendations — a user can take to find listings on Etsy. The result is an intrinsic and subtle interplay between these services, where they end up cannibalizing traffic from each other, as they fight for the shared and limited attention of users. Interactions that arise in circumstances like this are hard to anticipate and to quantify.
Besides interactions, there are also a number of other phenomena at play, such as incorrect conclusions about the existence of a treatment’s effect (false positives), along with temporal variations like the decay of a treatment’s effect over time, as users get more accustomed to it and the initial excitement fades (novelty effects). One known limitation of our A/B testing framework is that we are systematically prone to overestimating the impact sizes of treatments whose positive effects led us to select them for deployment. This issue, commonly called the winner’s curse, is something we explore more deeply in another post.
Using holdout groups to estimate collective impact
Our approach for estimating the joint impact of multiple changes is to run what we call persistent experiments. (This is an Etsy nomenclature for a practice, sometimes called holdback experiments or universal holdout experiments, that is becoming common across the tech industry.) These are special experiments that run throughout a given quarter and consist of two distinct stages.
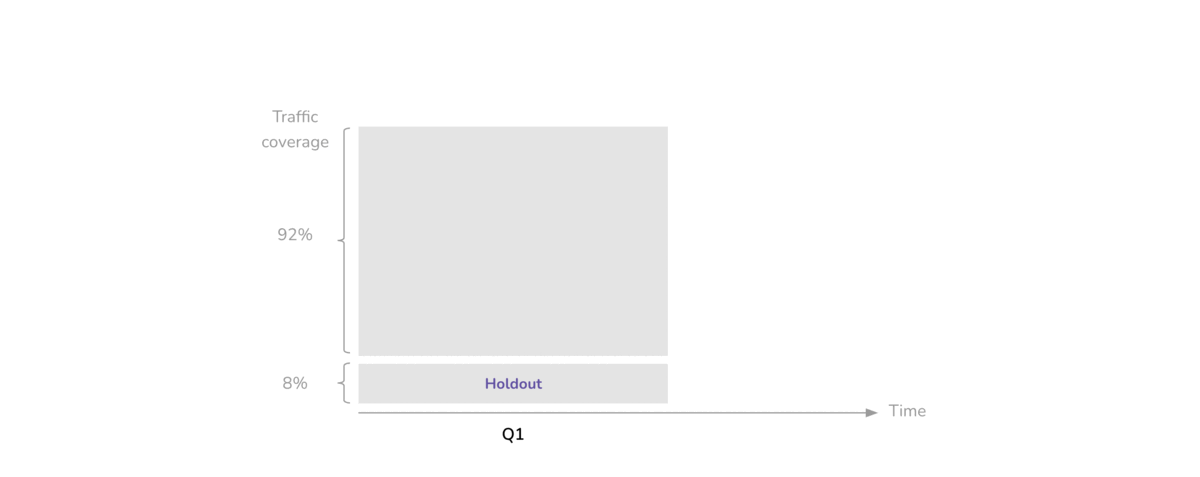
For the entire duration of the quarter, a small portion of our online traffic is excluded from experimentation. The excluded traffic forms a holdout group of users who are not exposed to any treatments, while we experiment on the remaining eligible traffic (Figure 2).
As we conduct experiments on the eligible portion of traffic, we decide which treatments we want to adopt and which ones to abandon. For each “winning” treatment, we estimate an expected financial impact based on the results of the experiment. When the quarter ends, we run a dedicated experiment called the comparison period, where half of the holdout group is randomly exposed to the combination of all our newly adopted treatments for several weeks (Figure 3).

The comparison period is essentially an A/B test, whose treatment variant consists of the latest state of Etsy (including all the recent changes made by teams during the quarter) contrasted with a control variant reflecting the old state of Etsy (prior to any of the quarter’s changes), thus measuring the total incremental impact of our launches in a given quarter. As a byproduct, monitoring the gap between this total impact and the sum of its individual components can help us identify shortcomings in our current experimentation practices and prompt experimenters to adopt more robust guidelines.
It takes a solid infrastructure and coordination ...
Persistent experiments make intuitive sense, but we still run into a lot of practical challenges defining, running, and analyzing them.
In terms of data engineering and experimental setup, we need to ensure that we can transition seamlessly between quarters. Our traffic allocation is carefully thought out to enable teams to start experimenting on their ideas as soon as a new quarter starts, without having to wait until the end of the previous quarter’s comparison period — while also making sure to protect the comparison period's results from contamination.
Our infrastructure also has to give teams the flexibility to curate what changes to include in persistent experiments. This is necessary to accommodate changes that fall outside the scope of persistent experiments and have to be presented to all users, regardless of whether or not they're assigned to a holdout group. It may happen that we have some structural code that cannot be maintained in two different states for a whole quarter; or sitewide changes may need to be deployed under considerations that go beyond business metrics alone.
On top of a suitable infrastructure, setting up persistent experiments also requires a proactive orchestration of various stakeholders, including product managers, engineers, analysts, and more. Comparison periods dictate a meticulous calendar that teams have to follow when scheduling their experiments or cleaning up their code, and may themselves be subject to external constraints (such as when Etsy freezes its code sitewide during peak shopping seasons).
... as well as thoughtful design and analysis
Aside from infrastructure, persistent experiments also present analytic challenges. One thing we find in particular is that the data we collect from these experiments can be quite noisy.
A large majority of the changes our teams make have an impact that is not directly captured by the metrics we track in our experimentation platform. Indeed, as long as they don’t hurt Etsy’s key success metrics, it is not unusual for teams to adopt treatments that show little or no impact in experiments, especially if they have confidence from other sources (design reviews, user research, etc.) that the changes are beneficial. Some of these are also intended as mere stepping stones to future improvements. The prominence of seemingly neutral treatments in a given quarter can add significant noise to the signal of interest coming from positive treatments.
It can be difficult to define persistent experiments at a resolution that is meaningful and interpretable. On the one hand, running a single “global” persistent experiment — a combined treatment of all newly adopted treatments across all of Etsy — has the advantage of offering a comprehensive view, but at the expense of diluting the signal (as some treatments may only affect a niche section of Etsy) and making impact harder to determine (as we face a rather heterogeneous mix of treatments). This is particularly true as teams from different initiatives typically target different success metrics in their experiments.
We can address the resolution problem by running multiple persistent experiments at a more granular level, but the question is how granular. Each page on Etsy could have its own persistent experiment, tailored to include only the treatments relevant to it. This would yield a more coherent grouping of treatments but would also create a more fragmented analysis.
Impact and reflections
Thanks to our flexible infrastructure and the close alignment between all our key stakeholders, we are able to smoothly run persistent experiments on a quarterly cadence. These experiments enable us to estimate the incremental business value Etsy can expect from the ensemble of changes we deploy every quarter, which ultimately leads to more informed financial planning. This estimation helps us keep a pulse on the health of the company, and also helps our leadership make strategic decisions regarding questions such as “what resources should we invest in X?” or “given that Y is expected, how much should we spend on Z?”.
The practice of persistent experiment we’ve developed over the past few years has taught us a great deal, about the impact of our product launches and about how we design and interpret experiments. We have gained a deeper understanding of the incremental value of different types of changes, the reliability of different metrics, and some of the unavoidable pitfalls of our own platform. These learnings have helped us evolve our experimentation guidelines to yield higher quality experiments and increase the confidence we have in our results.
Despite their usefulness, persistent experiments only capture some aspects of a much broader question regarding external validity, i.e. how well the findings from an experiment replicate and generalize beyond that experiment's scope. How to extrapolate results is one of the million-dollar questions in experimentation, whether it’s about extrapolation in time (inferring long-term impact from only short-term experiments) or in space (extending results from a subgroup to our entire population of users).
All in all, the apparent simplicity of A/B testing for local and practical decision-making should not make us lose sight of the global picture and the necessity of thinking about experiments more holistically.
Acknowledgements
Special thanks to Kevin Gaan for helping with the internal review of this post, and to Michael Dietz, our external editor. We would also like to thank* Anastasia Erbe, Gerald van den Berg, Michelle Borczuk, Samantha Emanuele, and Zach Armentrout from the Product Analytics and Strategic Finance team — as well as Abayomi Sofolahan, Alexander Tank, Allison McKnight, And Ozbay, John Mapelli, Julie Beckley, and Roman Martinez from the Experimentation Platform and Science team.
* Listed by team and alphabetical order of first names.