How to Install InfluxDB and Telegraf on Rocky Linux 9
InfluxDB is an open-source time series database written in Go. It is a high-performance time series platform with purpose-built to collect, store, process, and visualize time series data. InfluxDB is the go-to solution for time series databases, it provides a high-performance time series data engine with built-in powerful API for building real-time applications. InfluxDB is a platform that is used for such as operation monitoring, application and server performance metrics, IoT sensor data, and real-time analytics.
In this tutorial, you will install the influxdb open-source time series database and Telegraf on a Rocky Linux 9 server. You'll also secure the influxdb deplyoment with authentication and TLS certificates, set up influxdb CLI, and collect metrics via the Telegraf agent. At the end of this guide, you will create and visualize the influxdb time series database via the influxdb dashboard.
Prerequisites
To begin with, you must have the following requirements to complete this tutorial:
- A Rocky Linux 9 server.
- A non-root user with sudo/root administrator privileges.
- An SELinux with 'permissive' mode.
Setting up Repository
InfluxDB is an open-source time series database that can be deployed in multiple environments, which includes virtual machines with Linux, Windows, and macOS. And also containerized environments such as Docker and Kubernetes.
To install influxdb on Linux, you can install it manually via binary package or install it via the influxdb repository. In this step, you'll install influxdb via the official influxdb repository.
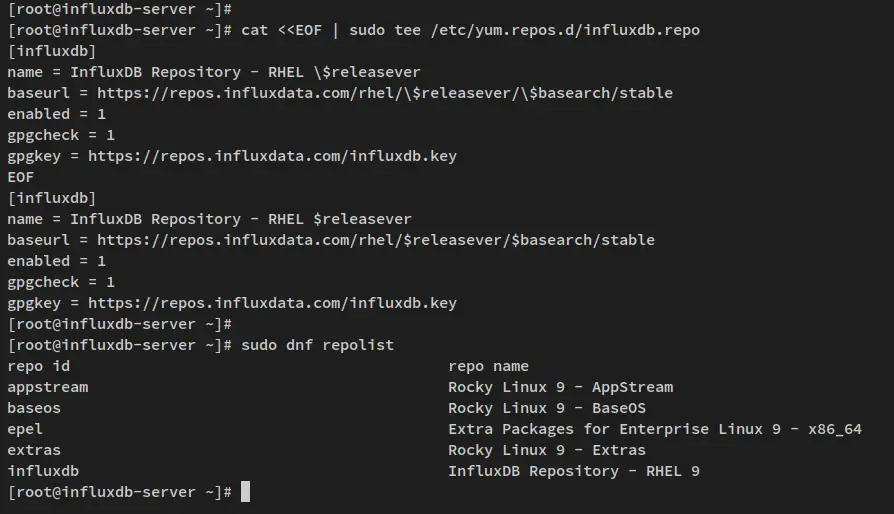
Run the following command to add the influxdb repository to your Rocky Linux system.
cat <<EOF | sudo tee /etc/yum.repos.d/influxdb.repo
[influxdb]
name = influxdb Repository - RHEL \$releasever
baseurl = https://repos.influxdata.com/rhel/\$releasever/\$basearch/stable
enabled = 1
gpgcheck = 1
gpgkey = https://repos.influxdata.com/influxdb.key
EOF
After that, verify the list of available repositories on your system.
sudo dnf repolist
You'll receive an output like the following screenshot - The influxdb repository added.
Installing InfluxDB
With the influxdb repository added, you'll then install the influxdb package to your Rocky Linux system and start the influxdb service and enable it.
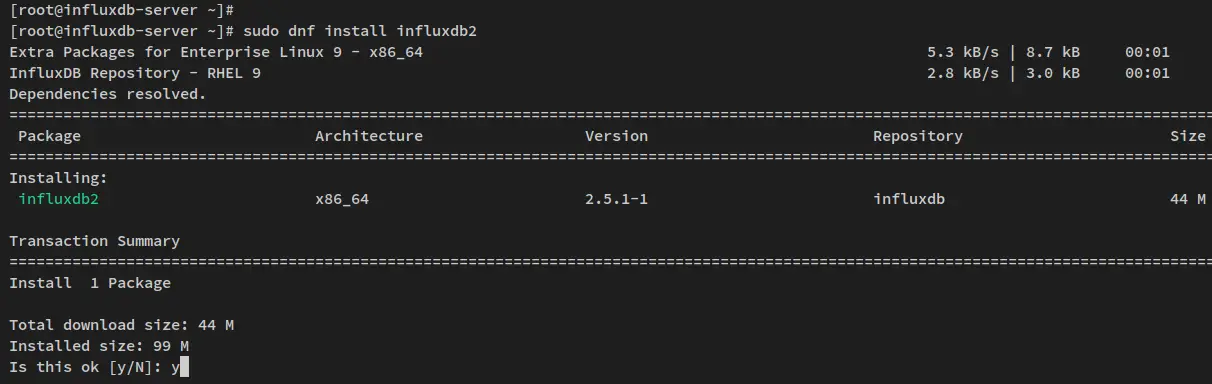
Run the following dnf command below to install the influxdb v2 package. At the time of this writing, you will install the latest version of influxdb v2.5.1.
sudo dnf install influxdb2
When prompted, input y to confirm and press ENTER to proceed.
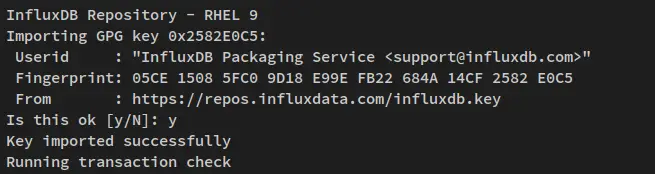
Also, when prompted for the influxdb GPG key, input y to confirm and press ENTER.
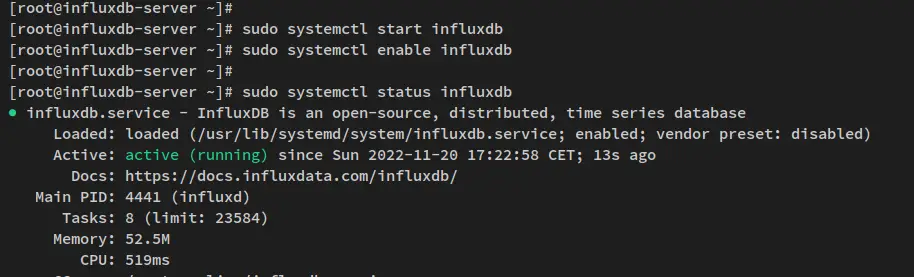
After influxdb is installed, run the below systemctl command to start and enable the influxdb service.
sudo systemctl start influxdb
sudo systemctl enable influxdb
The influxdb service should now be running and enabled. And it will start automatically upon the bootup.
Verify the influxdb service via the command below. You'll then see the influxdb service is running and it's enabled.
sudo systemctl status influxdb
By default, the influxdb service runs on TCP port '8085'. Now that the influxdb is running, you will need to add the influxdb port to the firewalld.
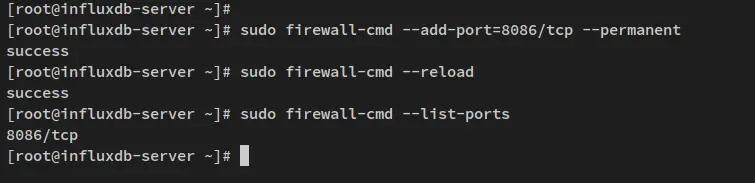
Run the below firewall-cmd command to add port '8086' to the firewalld.
sudo firewall-cmd --add-port=8086/tcp --permanent
Now reload the firewalld to apply new changes. Then, verify the firewalld status to ensure that the influxdb port is added to the firewalld.
sudo firewall-cmd --reload
sudo firewall-cmd --list-ports
You'll receive the output like the following - The influxdb port 8089 added to the firewalld.
With the influxdb installed and the firewalld configured, you'll next install and set up the influxdb CLI that will be used for managing influxdb via the command line.
Installing influxdb CLI
After the influxdb time series database is installed, you will then install the influxdb2-cli or influxdb command line. The influxdb2-cli provides a command-line 'influx' that allows you to manage influxdb administration such as managing buckets, organizations, users, tasks, etc.
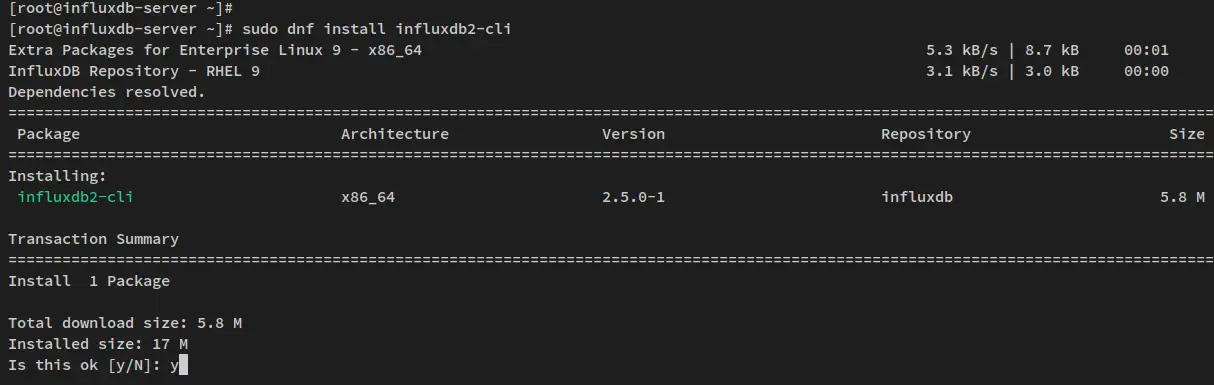
Run the following dnf command to install the influxdb2-cli package.
sudo dnf install influxdb2-cli
Input y when prompted for the confirmation and press ENTER to proceed.
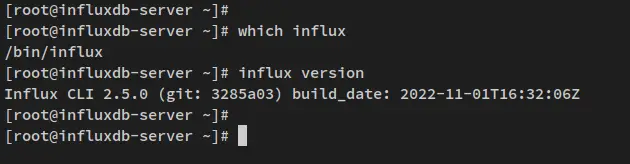
After influxdb2-cli is installed, run the below command to check the inlfuxdb2-cli binary file and verify the influxdb-cli version.
which influx
influx version
Output like this will be printed to your screen - the influxdb2-cli binary file is available at '/bin/influx' and the current version of influxdb2-cli installed on your system is v2.5.0.
The influxdb2-cli provides the command completions for multiple shells such as bash and zsh. Most Linux machines use bash default shell. So, you'll set up the influxdb2-cli command completion for the bash shell.
Run the below command to generate the influxdb2-cli command-completion to '/etc/bash_completion.d/influx.sh'. Then, make the file '/etc/bash_completion.d/influx.sh' executable via the chmod command.
sudo influx completion bash > /etc/bash_completion.d/influx.sh
sudo chmod +x /etc/bash_completion.d/influx.sh
Now if you type the 'influx' command on your system and press TAB, you'll then see available options for the 'influx' command.
sudo influx TAB

At this point, you have installed the influxdb time series database and the influxdb2-cli on your Rocky Linux system. You'll then set up the influxdb installation via the influxdb2-cli.
Configuring InfluxDB via InfluxDB CLI
In this step, you will configure the influxdb installation via the influxdb2-cli. You will set up the influxdb administrator user and password, set up the default bucket or database, verifying the list user and auth on influxdb. You'll also learn how to connect to the influxdb shell via the influx command and user token, and also access the influxdb web administration dashboard via the web browser.
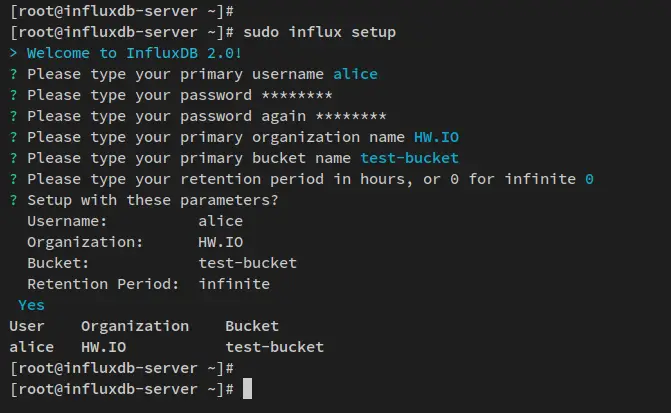
First, run the following influx command to start configuring the influxdb deployment.
sudo influx setup
Now you'll be asked with the influxdb configuration below:
- Setup admin user - input the new username for your influxdb server. This example uses 'alice' as the admin user for influxdb.
- Setup the admin password - input the new admin password for your influxdb deployment and repeat the password.
- Define the organization name - input your organization name. In this example, the organization is 'HW.IO'.
- Set up the primary bucket name that you will create - input the bucket name for the default installation. In this example, the bucket name is 'test-bucket'.
- Setup the retention period for influxdb - input 0 for infinite.
- Now input 'Yes' to confirm the influxdb basic configurations.
Below is the complete output during the influxdb configuration via the 'influx' command.
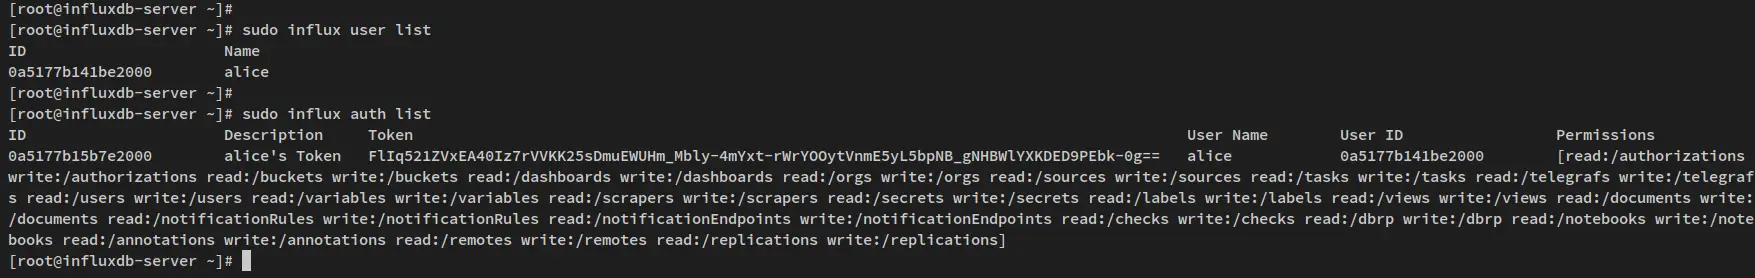
Now that the influxdb admin user is created, you'll then verify the list of users and authentications on the influxdb via the following influx command.
sudo influx user list
sudo influx auth list
An output below confirms that the influxdb admin user 'alice' is created and also you should see auth details for the user 'alice', which includes the auth ID, token, and permissions.
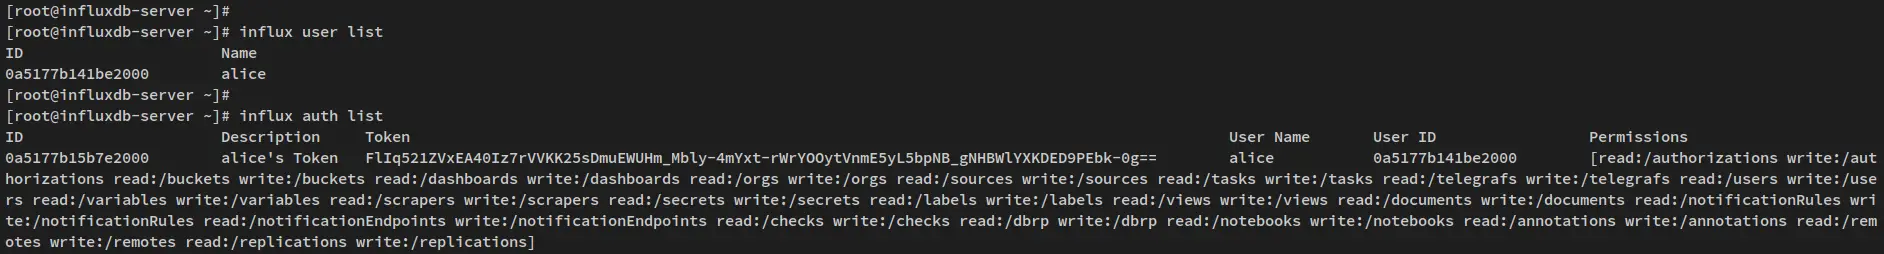
As you can see the user token is generated automatically during the setup process. And you'll next be using the token for logging in to the influxdb shell and verifying that you have proper influxdb configuration.
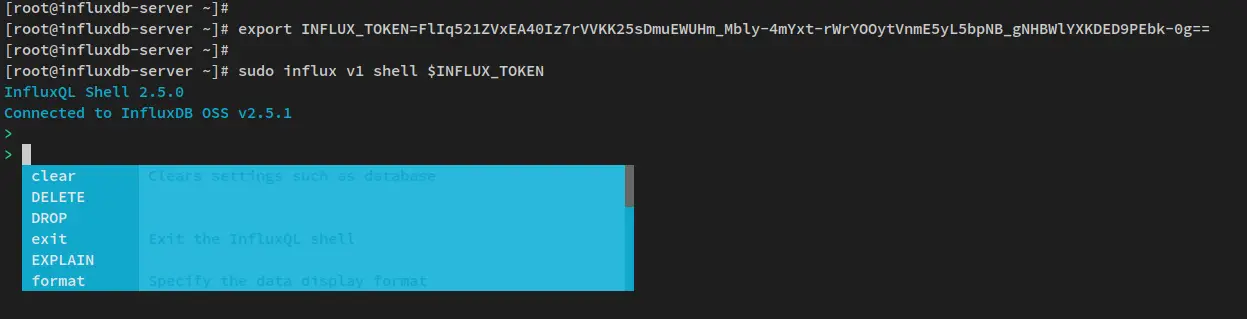
Before logging in to the influxdb shell, run the below command to create the environment variable 'INFLUX_TOKEN'. And be sure to change the token in the below command with your token.
export INFLUX_TOKEN=FlIq521ZVxEA40Iz7rVVKK25sDmuEWUHm_Mbly-4mYxt-rWrYOOytVnmE5yL5bpNB_gNHBWlYXKDED9PEbk-0g==
Now log in to the influxdb shell via the 'influx' command below. After logged in, you should see a message such as 'Connected to InfluxDB OSS v2.5.1'.
sudo influx v1 shell $INFLUX_TOKEN
Next, run the following influx query to get details of databases or buckets on the influxdb server.
show DATABASES
And you should get the 'test-bucket' database available on the influxdb server.
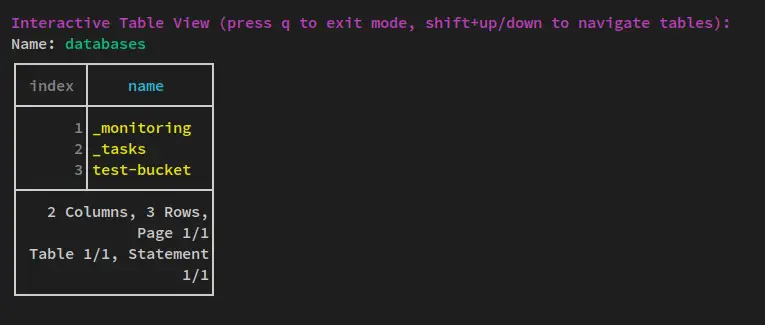
You can now press 'q' to exit from the interactive mode and type 'exit' to log out from the influxdb shell.
Next, you can also access your influxdb administration from the web browser.
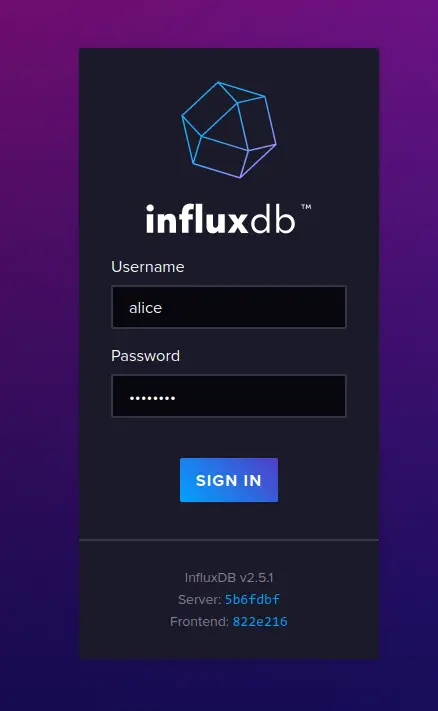
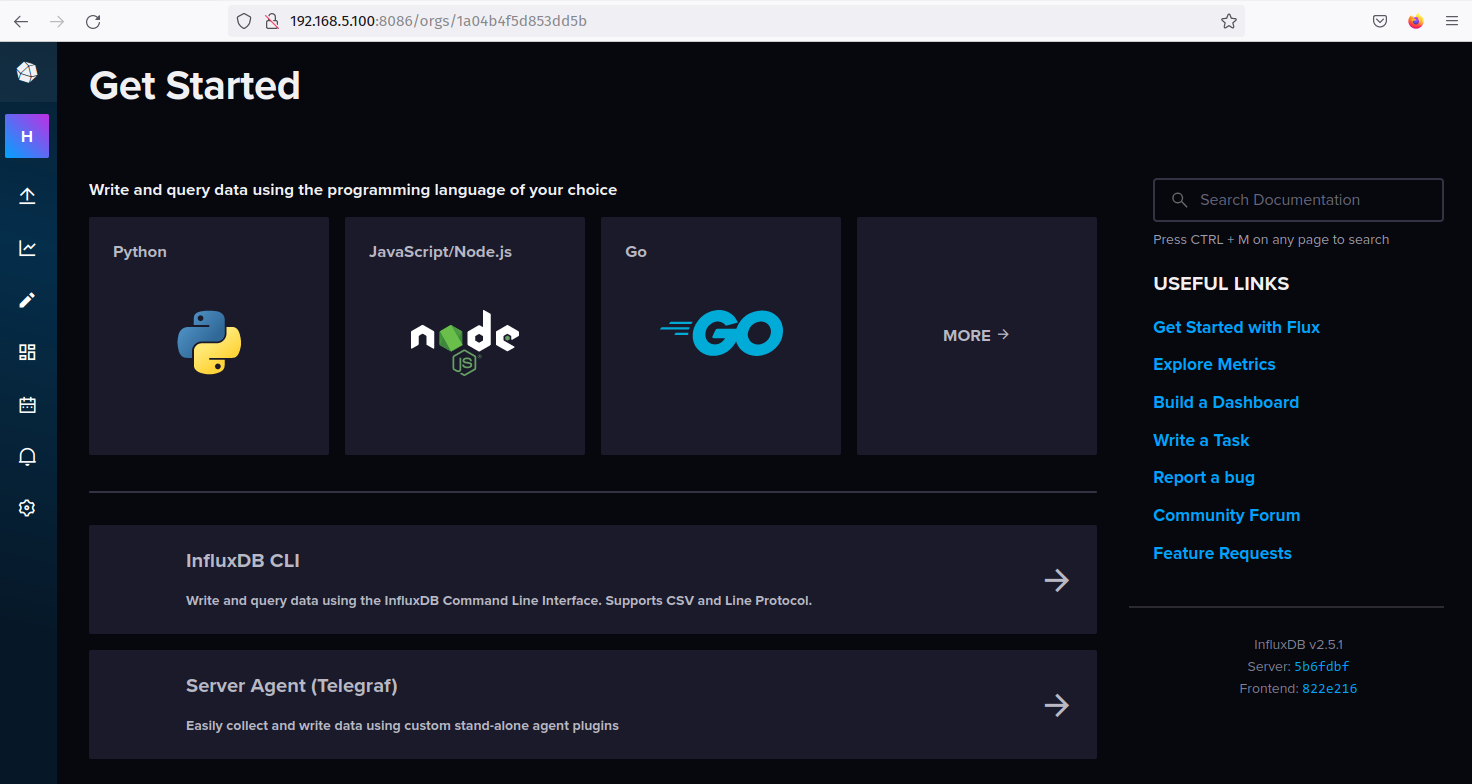
Open your web browser and visit the influxdb server IP address followed by port '8086' (i.e: http://192.168.5.100:8086). You should now get the influxdb login page.
Input the influxdb user and password that you have created during the influxdb setup process and click 'SIGN IN'. In this example, the admin user is 'alice'.
After logging in, you should now see the influxdb web-based administration dashboard.
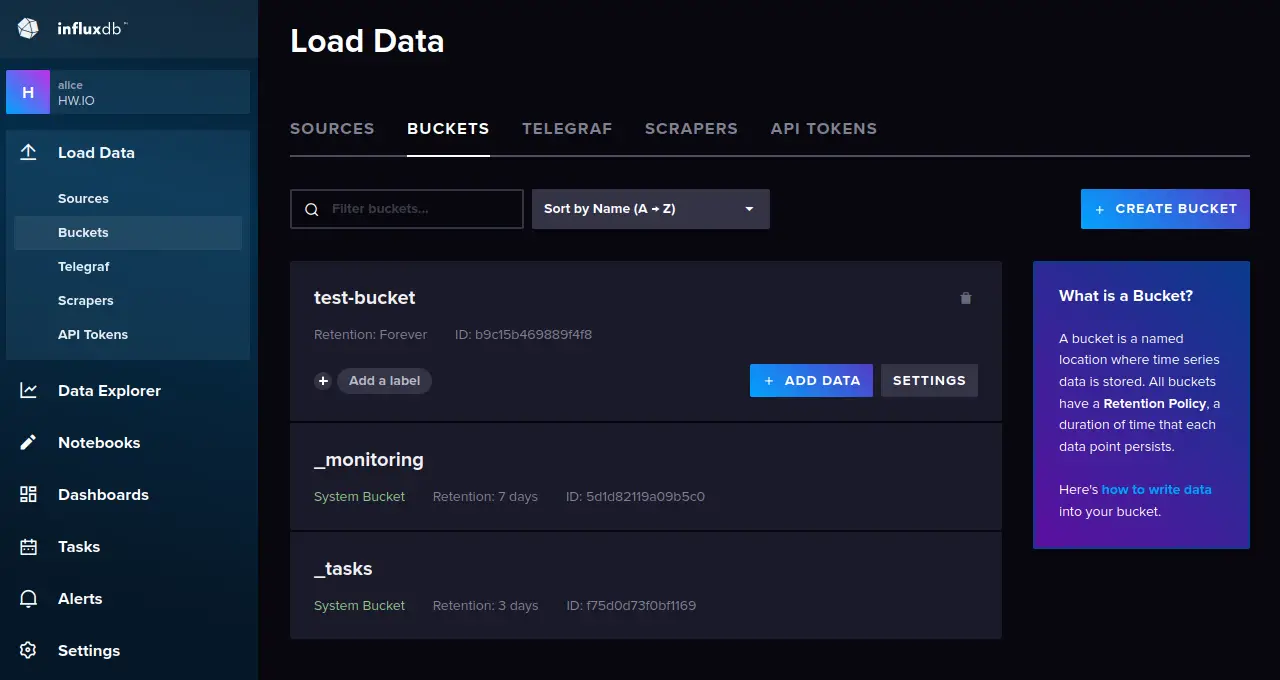
On the left menu, click "Load Data" and select the "Buckets" tab. And you should see the 'test-bacuket' is available on the influxdb server.
With the basic configuration of influxdb finished, you'll next start to add the security layer on influxdb by enabling the secure connection via TLS certificates.
Securing InfluxDB with TLS
After finished the influxdb server basic configuration, you'll next secure the influxdb deployment via SSL/TLS certificates. Then, you'll update the influx default configuration/profile with the new secured influxdb server.
Before getting started, ensure that you have generated SSL/TLS certificates. You can use Self-signed SSL/TLS certificates or use the generated SSL certificates from third-party such as Letsencrypt.
First, create a new directory for storing SSL/TLS certificates '/etc/influxdb/ssl'.
mkdir -p /etc/influxdb/ssl
Now copy the SSL/TLS certificates to the '/etc/influxdb/ssl' directory and change the ownership of the directory '/etc/influxdb/ssl' to the user 'influx'.
cp /etc/letsencrypt/live/influxdb.hwdomain.io/{fullchain.pem,privkey.pem} /etc/influxdb/ssl/
sudo chown -R influx: /etc/influxdb/ssl
After SSL/TLS certificates are copied, open the influxdb configuration file '/etc/influxdb/config.toml' using the following nano editor command.
sudo nano /etc/influxdb/config.toml
Add the following lines to the file.
tls-cert = "/etc/influxdb/ssl/fullchain.pem"
tls-key = "/etc/influxdb/ssl/privkey.pem"
save the file and exit the editor when you are finished.
Next, run the below systemctl command to restart the influxdb service and apply new changes.
sudo systemctl restart influxdb
Now that the influxdb is running with TLS enabled, you will not be able to query and manage the influxdb server via the 'influx' command line. To solve this, you must update the default influx profile on your system.
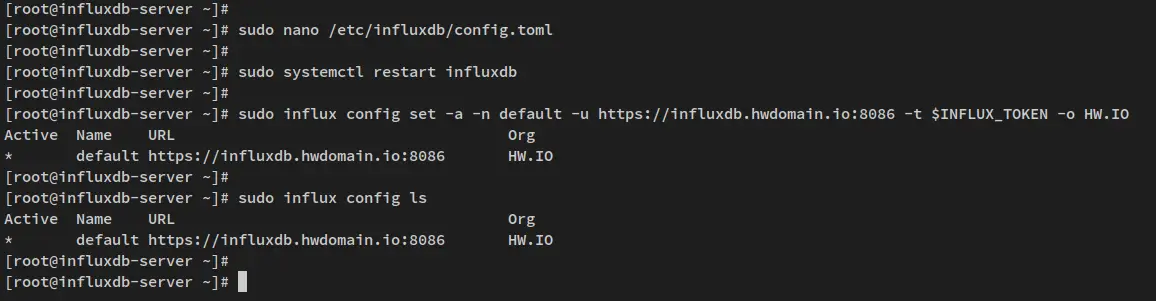
Run the following command to update the 'default' configuration/profile on the influx environment. In this example, you'll update the URL to 'https://influxdb.hwdomain.io:8086' with secure SSL/TLS enabled and update the token with the environment variable 'INFLUX_TOKEN' and the organization to 'HW.IO'.
sudo influx config set -a -n default -u https://influxdb.hwdomain.io:8086 -t $INFLUX_TOKEN -o HW.IO
Verify the list of influx configurations/profiles using the below command. You should now see that the URL is changed to 'https://influxdb.hwdomain.io:8086', which the SSL/TLS enabled on the influxdb server.
sudo influx config ls
Lastly, run the below command to verify that the new update influx configuration/profile is working.
sudo influx user list
sudo influx auth list
Suppose the influx configuration/profile is updated correctly. In that case, you should get the list of users and auth on the influxdb server and you have connected to the influxdb server via the secure SSL/TLS connection.
At this point, you have finished the installation and configuration of the influxdb server on Rocky Linux and secured the influxdb deployment via SSL/TLS certificates. You'll next start collecting data and metrics via telegraf, then visualizing influxdb time series data by creating a dashboard.
Collecting Data via Telegraf
Telegraf is part of the time series platform created by influxdata. It's an open-source server-based agent for collecting and sending metrics and events from multiple environments such as IoT sensors, database systems, system telemetry, and DevOps tools and frameworks. Telegraf is compiled as a single binary file and written in Go, no need for external dependencies for the installation.
In this step, you will install telegaf on a Rocky Linux server and configure it to send metrics to the influxdb server.
Telegraf is available on the influxdb repository. Before installing telegaf, ensure that the influxdb repository is added to your system.
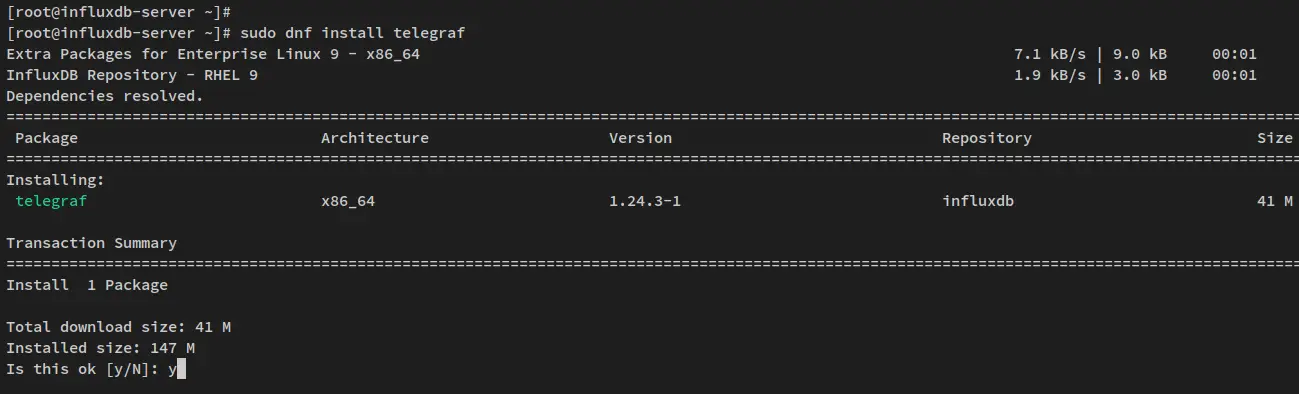
Now run the below dnf command to install telegraf to your system. When prompted for confirmation, input y and press ENTER to proceed.
sudo dnf install telegraf
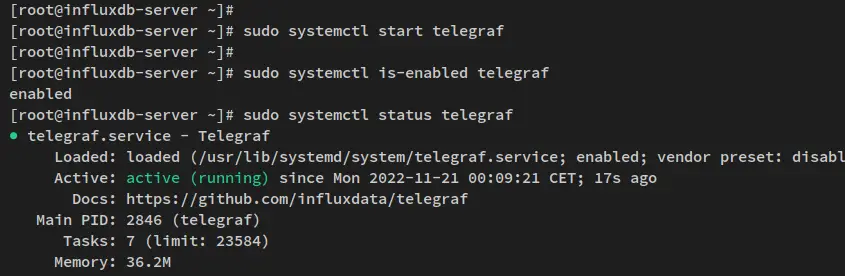
After telegraf is installed, start and enable the telegraf service via the systemctl command below.
sudo systemctl start telegraf
sudo systemctl enable telegraf
Next, run the below command to verify the telegraf service and make sure that the service is running and enabled.
sudo systemctl is-enabled telegraf
sudo systemctl status telegraf
The below output confirms that the telegraf service is enabled and will be run automatically upon the bootup. And the current status of the telegraf service is running.
Now that the telegraf is running, you'll next add the influxdb server to the telegraf configuration.
Open the telegraf configuration '/etc/telegraf/telegraf.conf' using the below nano editor command.
sudo nano /etc/telegraf/telegraf.conf
On the '[[outputs.influxdb_v2]]' section, add the URL, token, organization, and bucket name with the influxdb server details.
 [[outputs.influxdb_v2]]
#   ## The URLs of the influxdb cluster nodes.
.........
#   ###   ##   ex: urls = ["https://us-west-2-1.aws.cloud2.influxdata.com"]
   urls = ["https://influxdb.hwdomain.io:8086"]
#
#   ## Token for authentication.
   token = "FlIq521ZVxEA40Iz7rVVKK25sDmuEWUHm_Mbly-4mYxt-rWrYOOytVnmE5yL5bpNB_gNHBWlYXKDED9PEbk-0g=="
#
#   ## Organization is the name of the organization you wish to write to.
   organization = "HW.IO"
#
#   ## Destination bucket to write into.
   bucket = "test-bucket"
Save the file and exit the editor when you are finished.
Next, run the below systemctl command to restart the telegraf service and apply new changes. Now the telegraf service will collect metrics of your system and send collected metrics to the influxdb server.
sudo systemcl restart telegraf
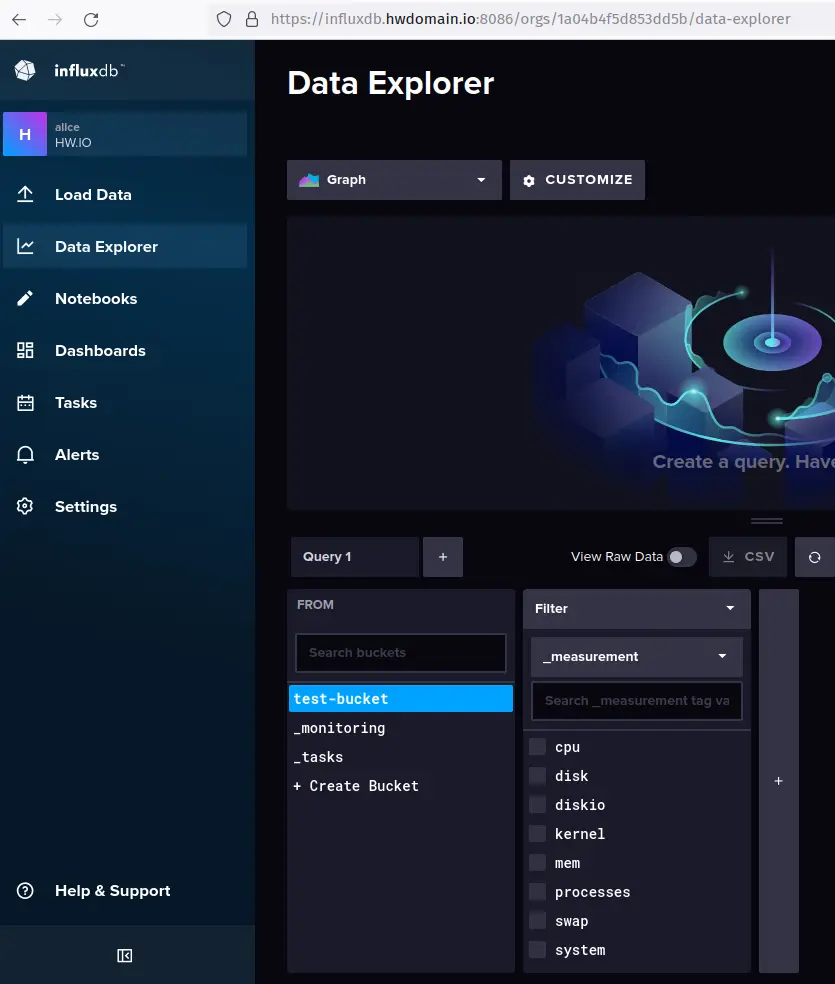
You can now verify telegraf and influxdb installation via the influxdb web administration dashboard and the influxdb shell.
Verifying telegraf metrics from the influxdb web administration dashboard - click on the 'Data Explorer' menu and select the 'test-bucket'. You should now get system telemetry collected by the telegraf, which includes cpu, disk, diskio, kernel, memory, swap, and system.
Verify telegraf metrics via the influxdb shell - connect to the influxdb shell via the 'influx' command below.
sudo influx v1 shell
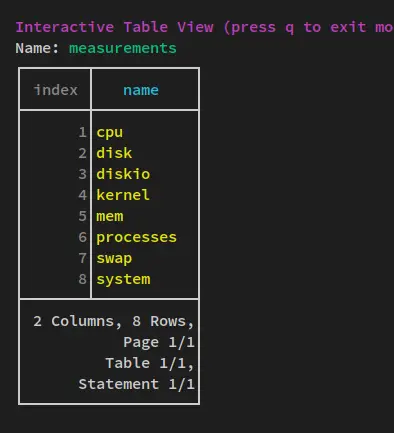
Next, run the below query to switch to the 'test-bucket' and show available measurements from it.
use test-bucket
SHOW MEASUREMENTS
The below output confirms that metrics collected by the telegraf service are available on the influxdb server.
With the telegraf installation and configuration finished, metrics are available on the influxdb server. You can now set up a new dashboard and start monitoring your server via the telegraf and influxdb.
Visualizing Data and Creating Dashboard
In this step, you will create a new dashboard for monitoring systems telemetry via the influxdb server and telegraf. You will create influxdb dashboards, create cells for system monitoring, and visualize metrics collected by the telegraf service.
To begin, select the 'Dashboard' menu and click 'CREATE DASHBOARD'.
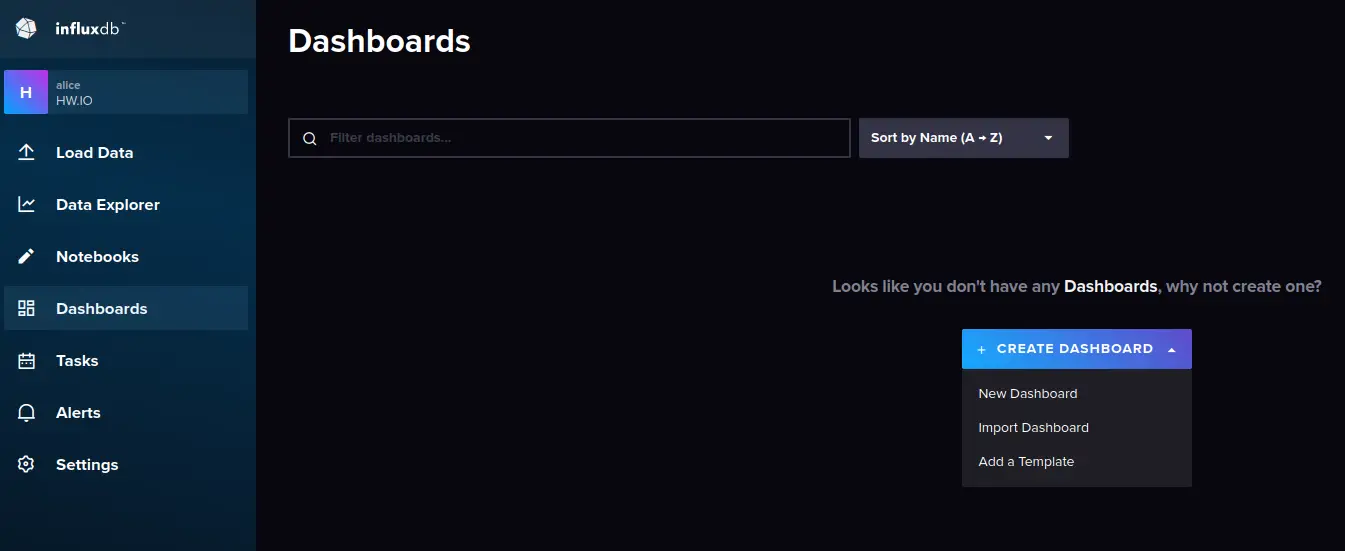
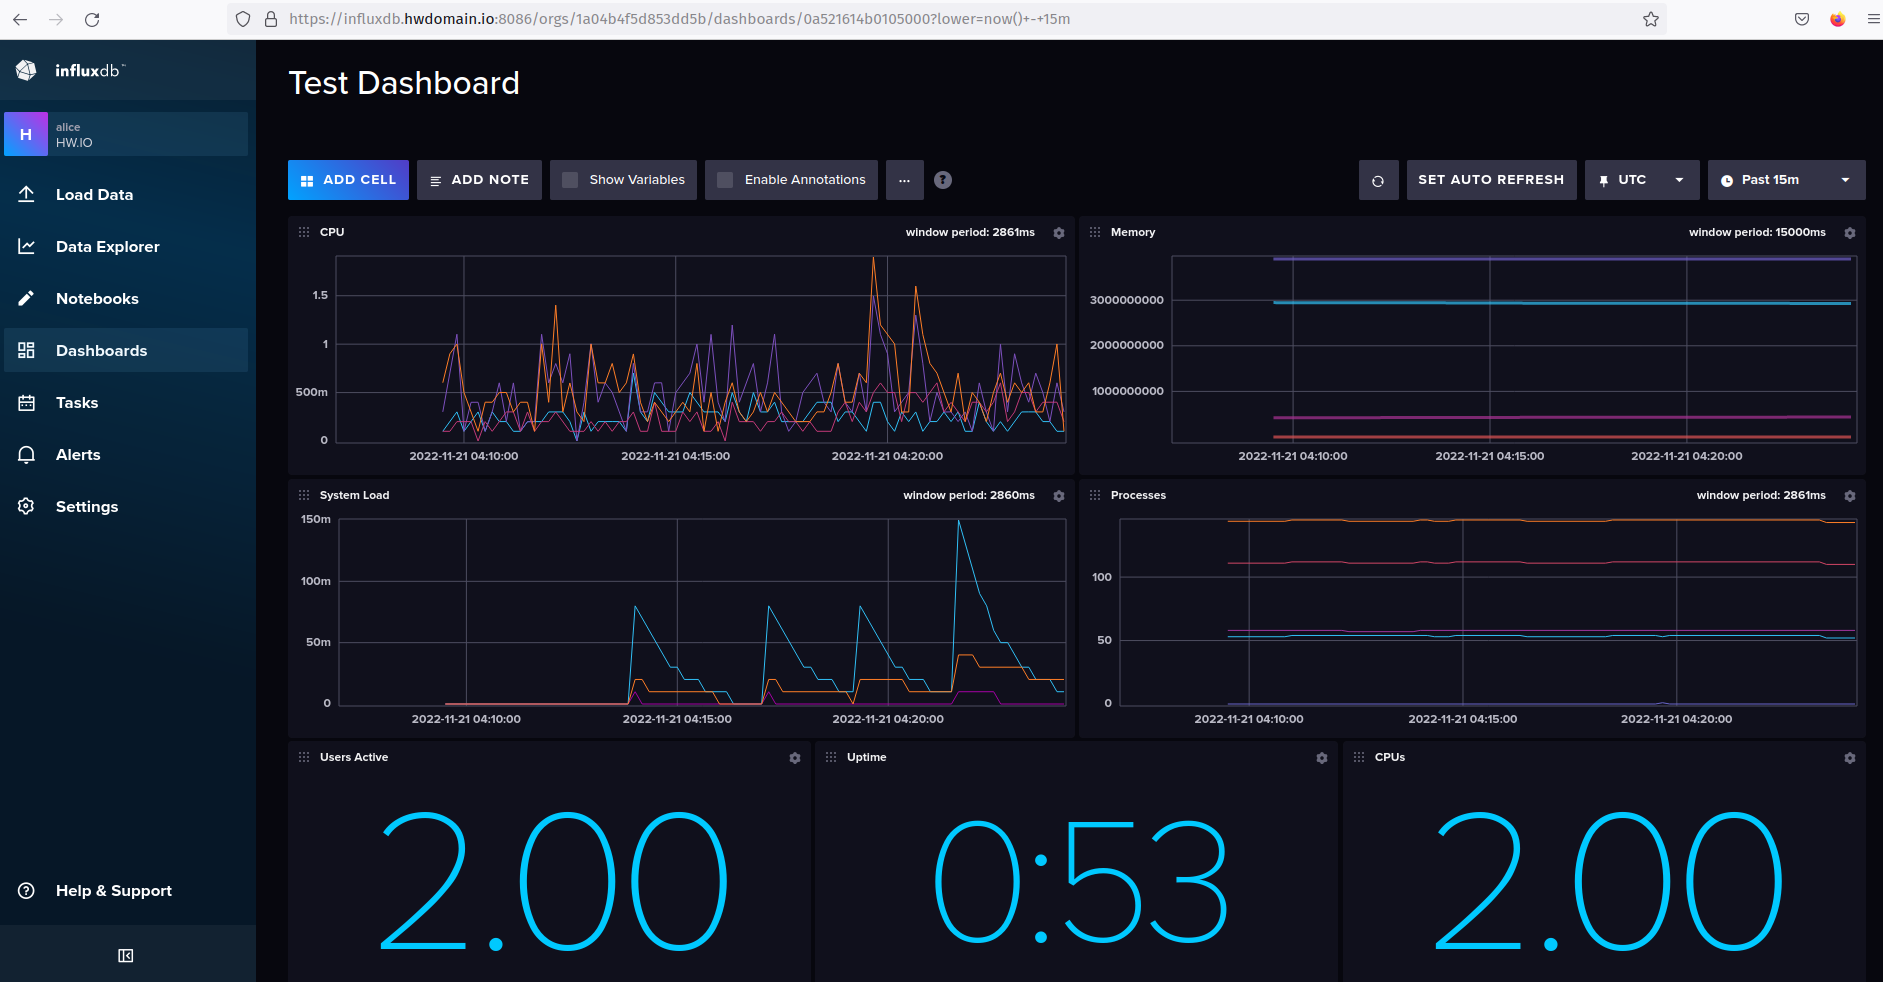
Input the name of your dashboard and click 'ADD CELL'. In this example, you will create a dashboard 'Test Dashboard'.
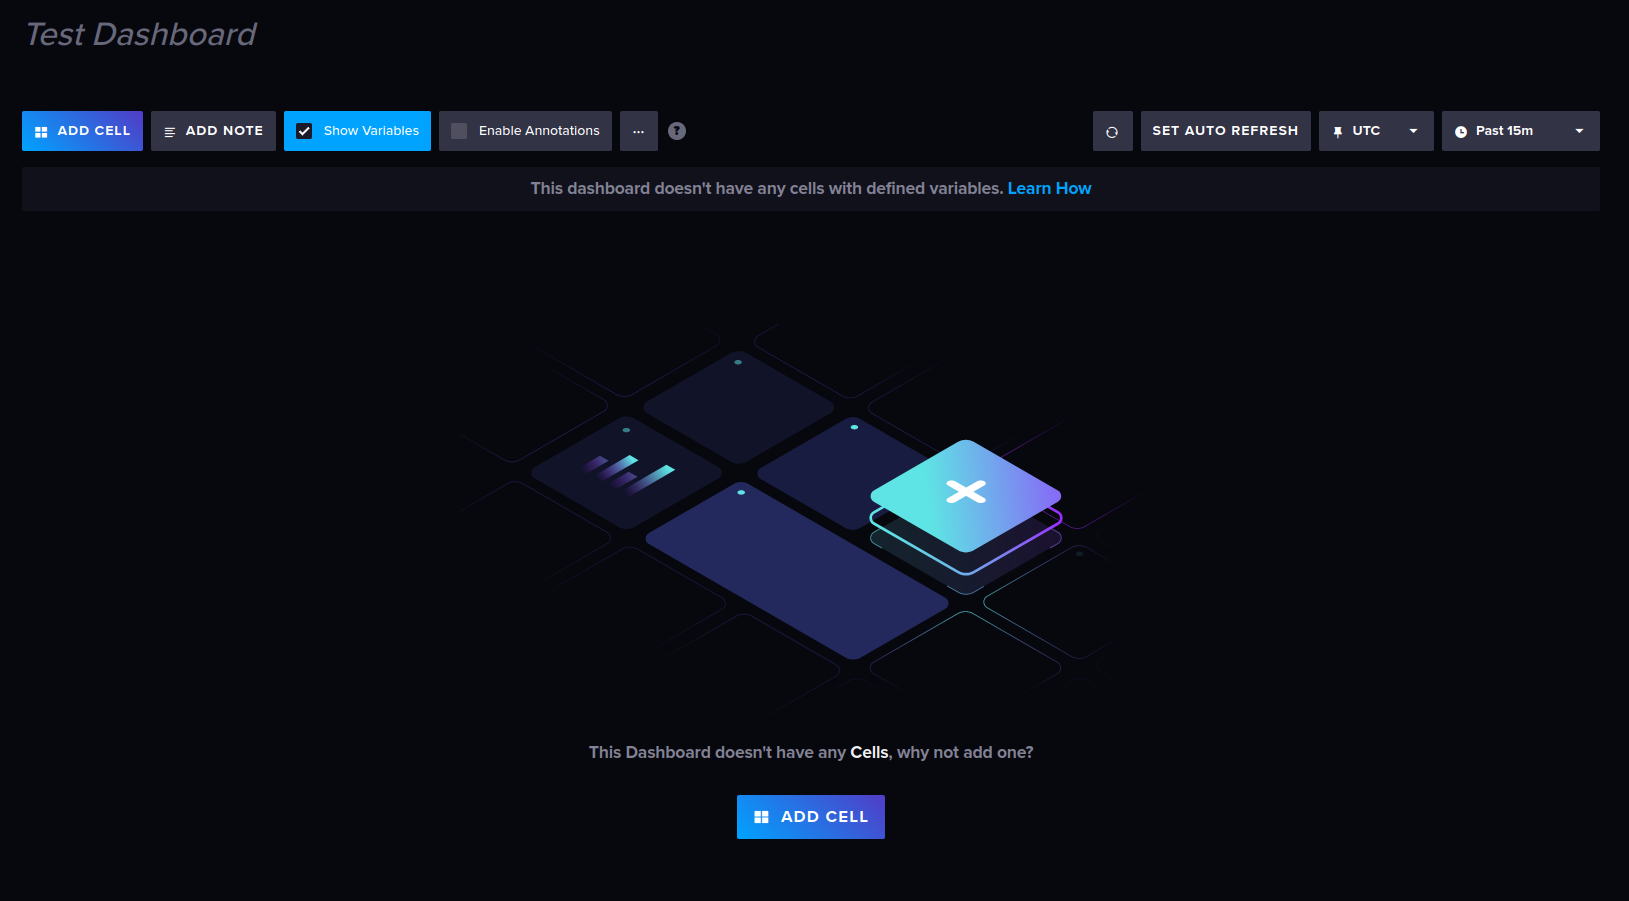
Now you can start adding new cells for your system monitoring. Below are some graph examples for system monitoring via telegraf.
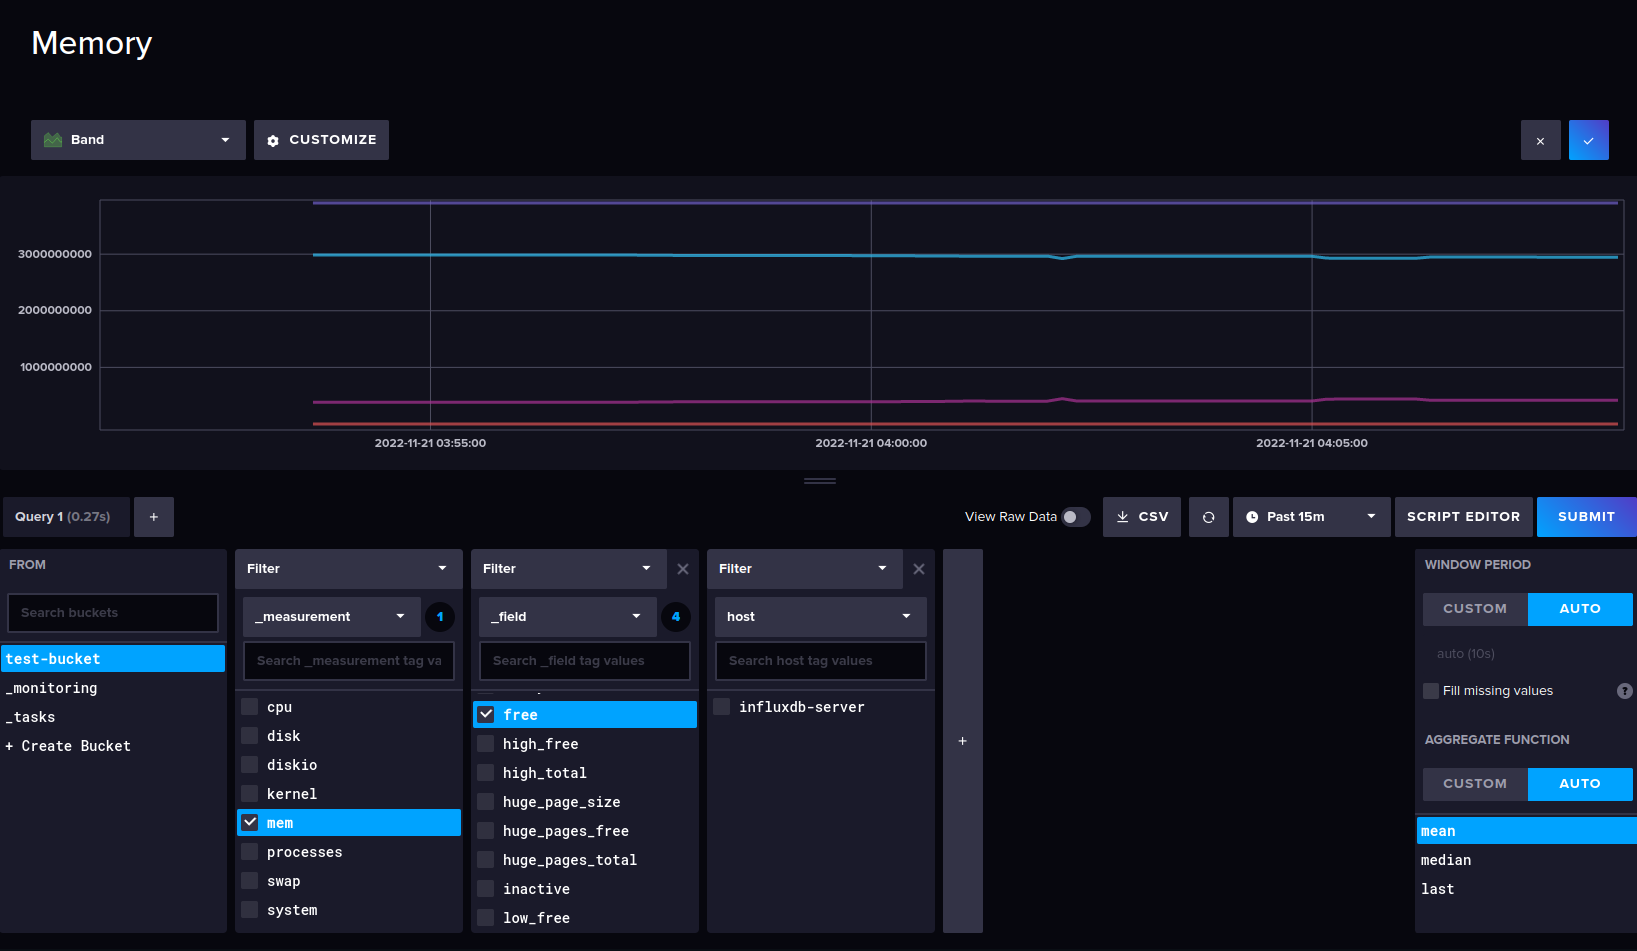
Below are graph settings for memory available and memory usage.
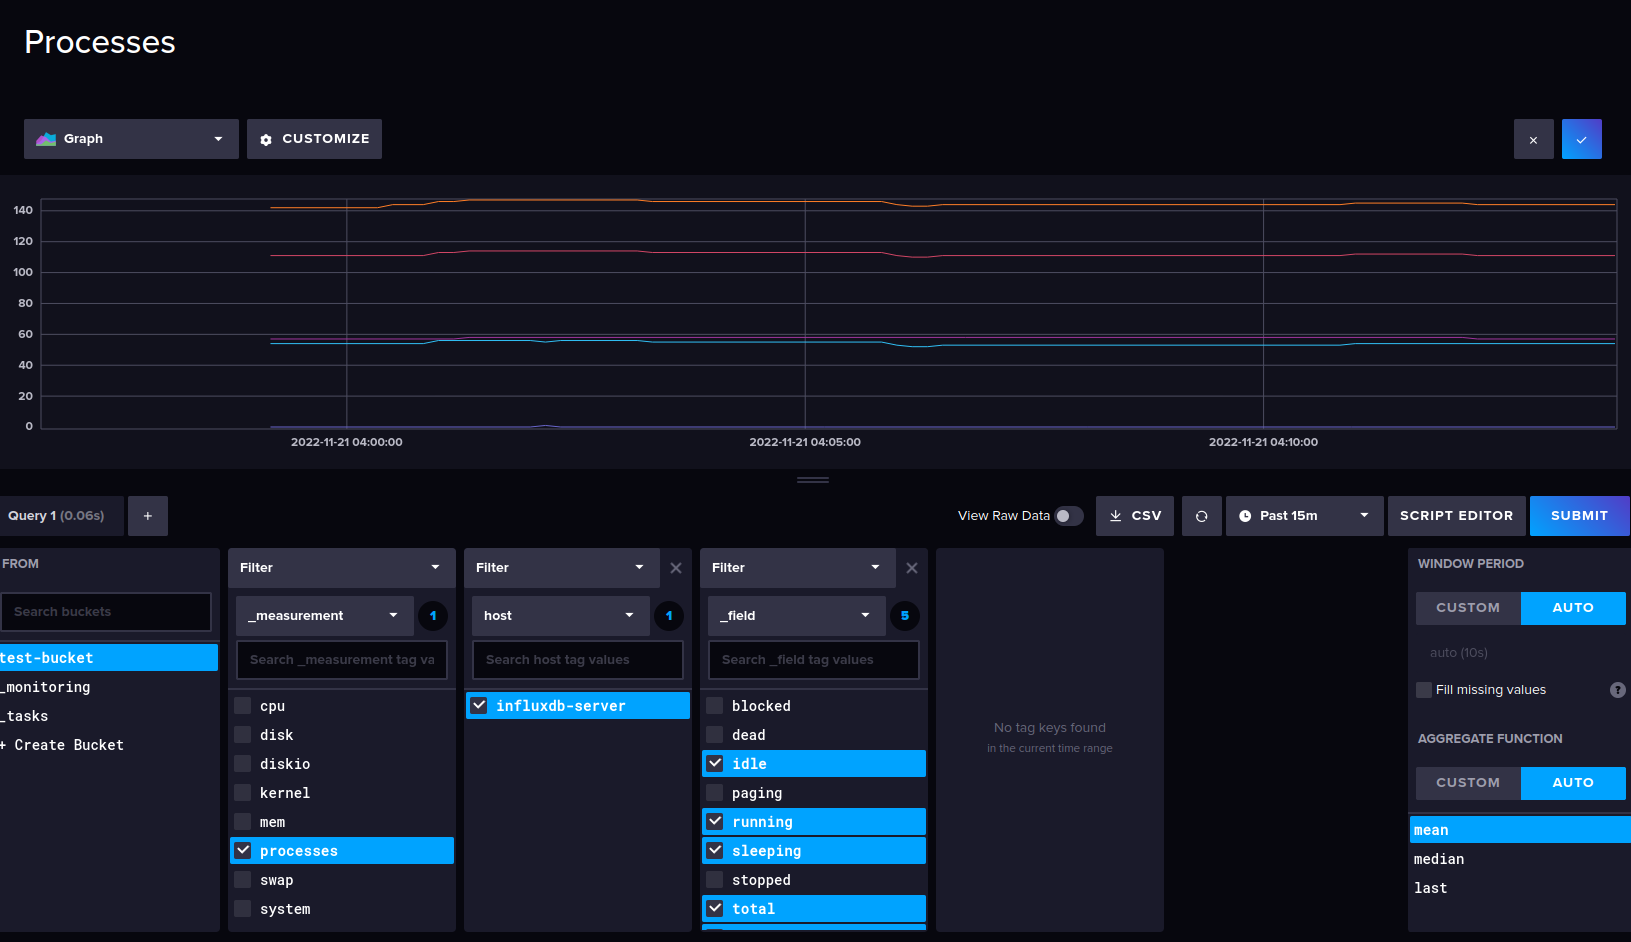
Below are the graph settings for the process monitoring.
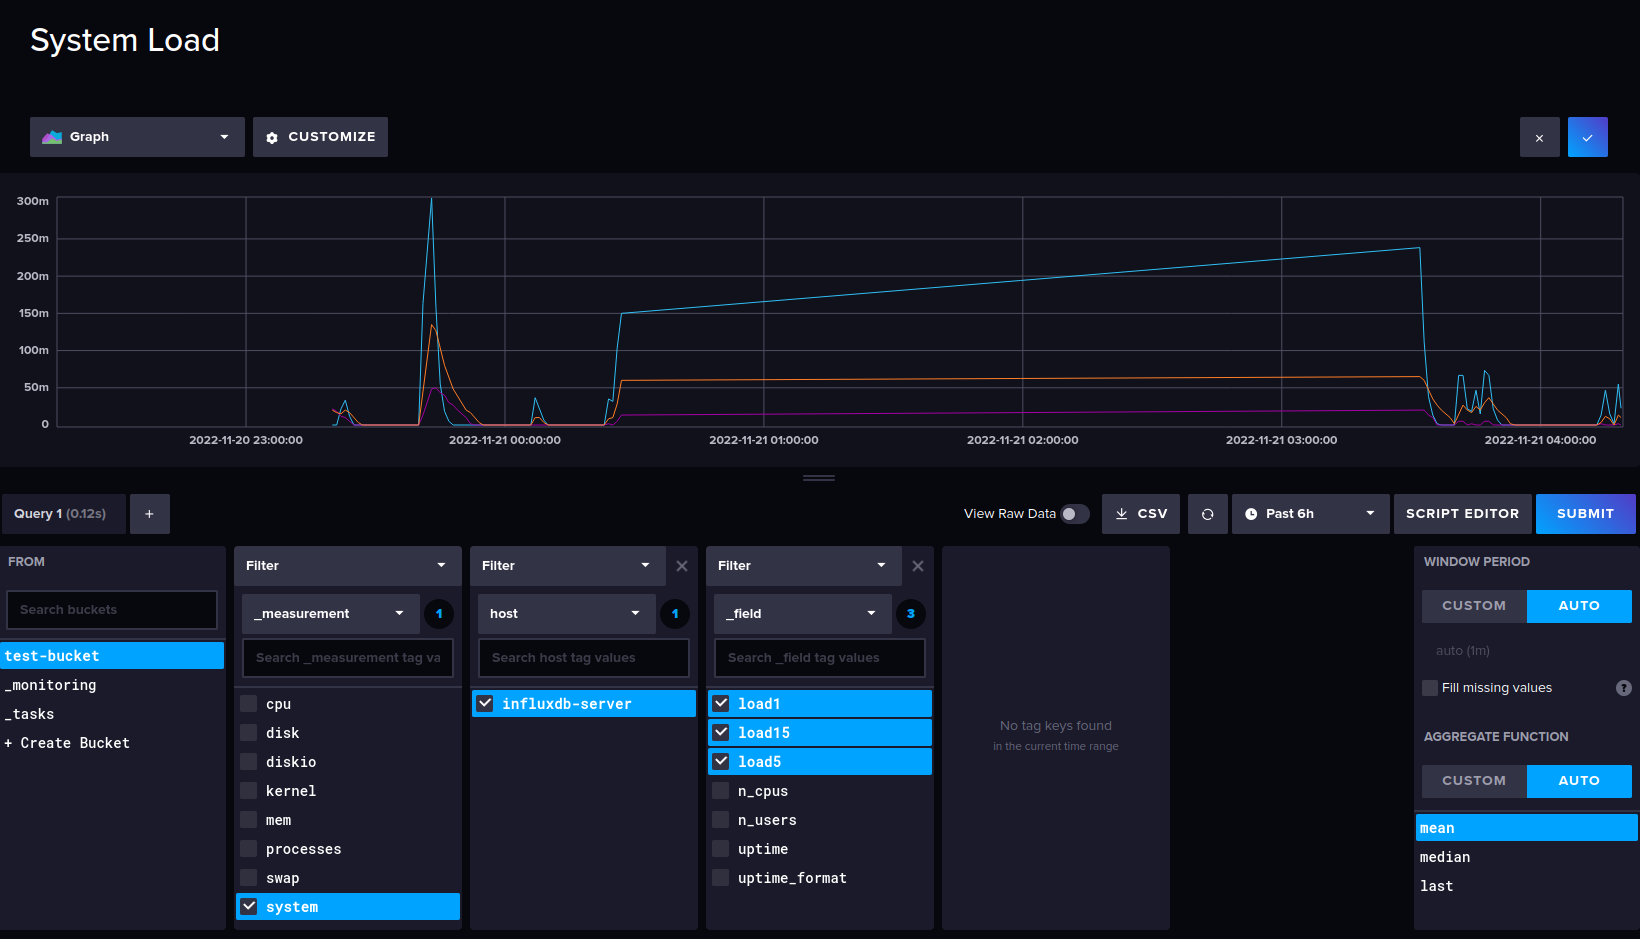
Below is the graph for the system load.
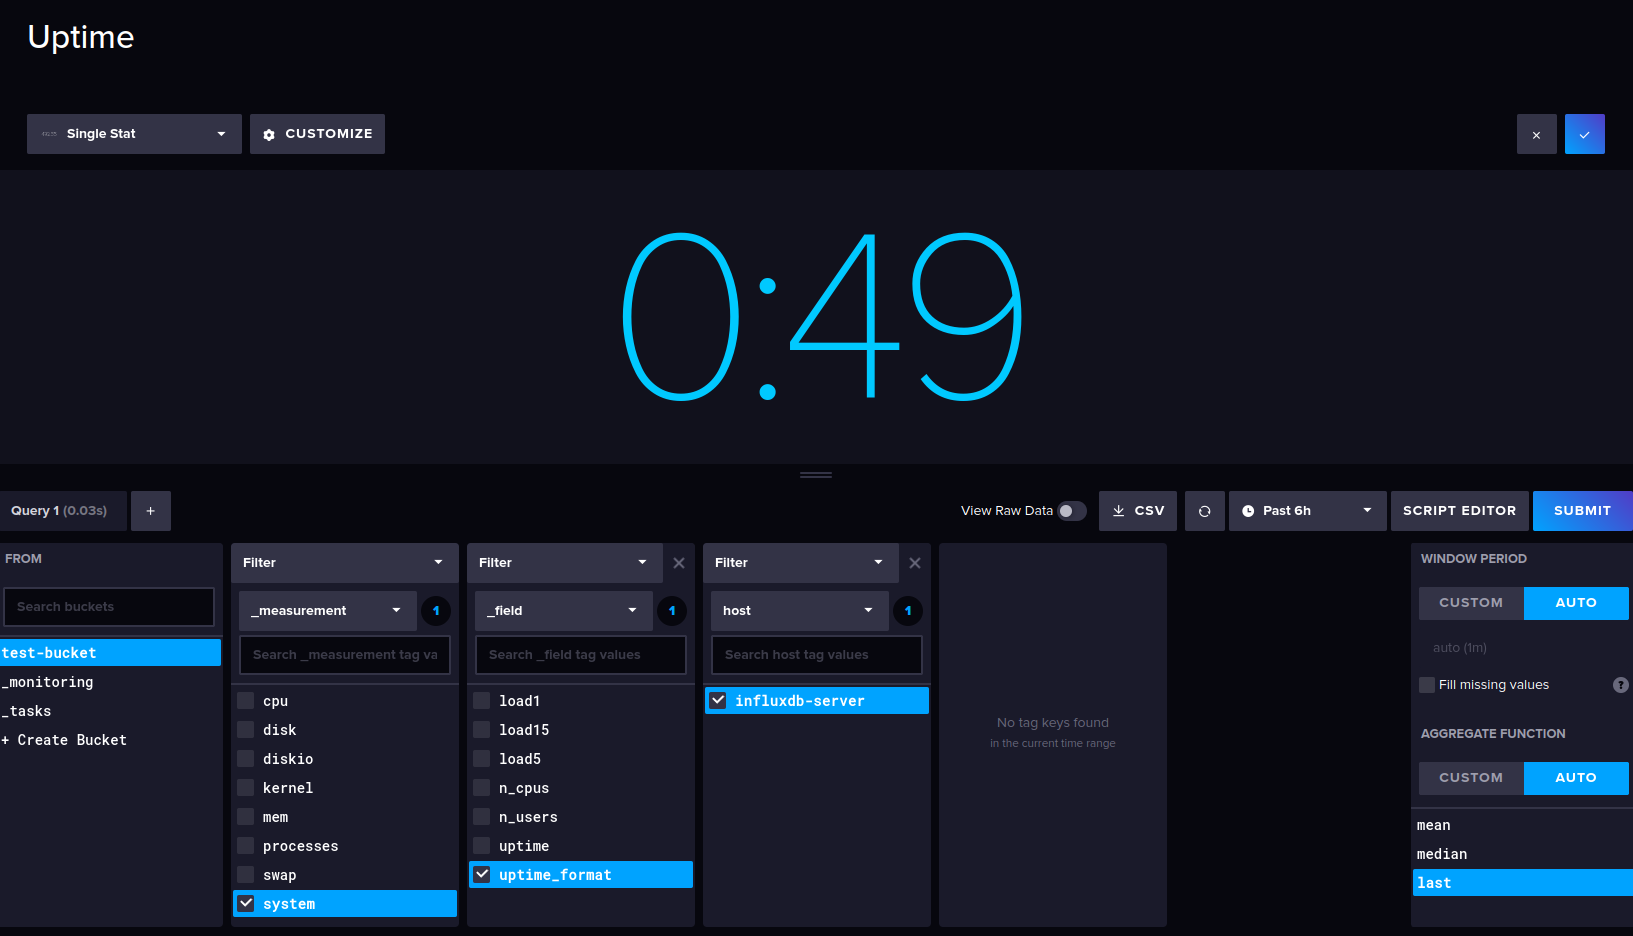
Below simple uptime graph.
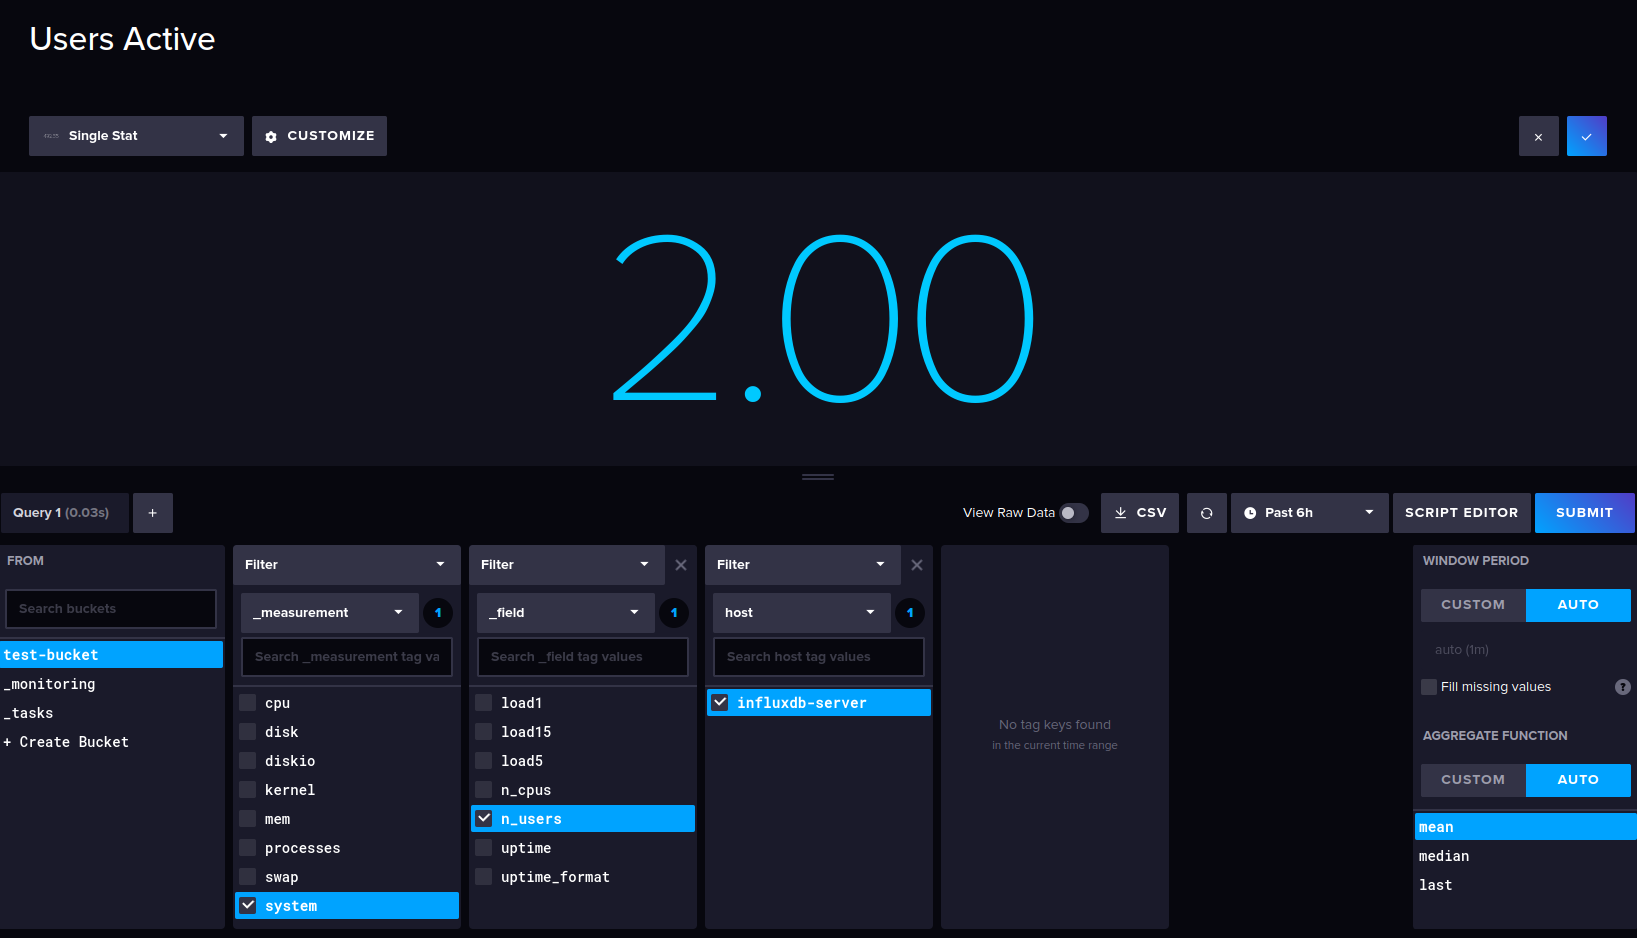
Below is the graph for the user active.
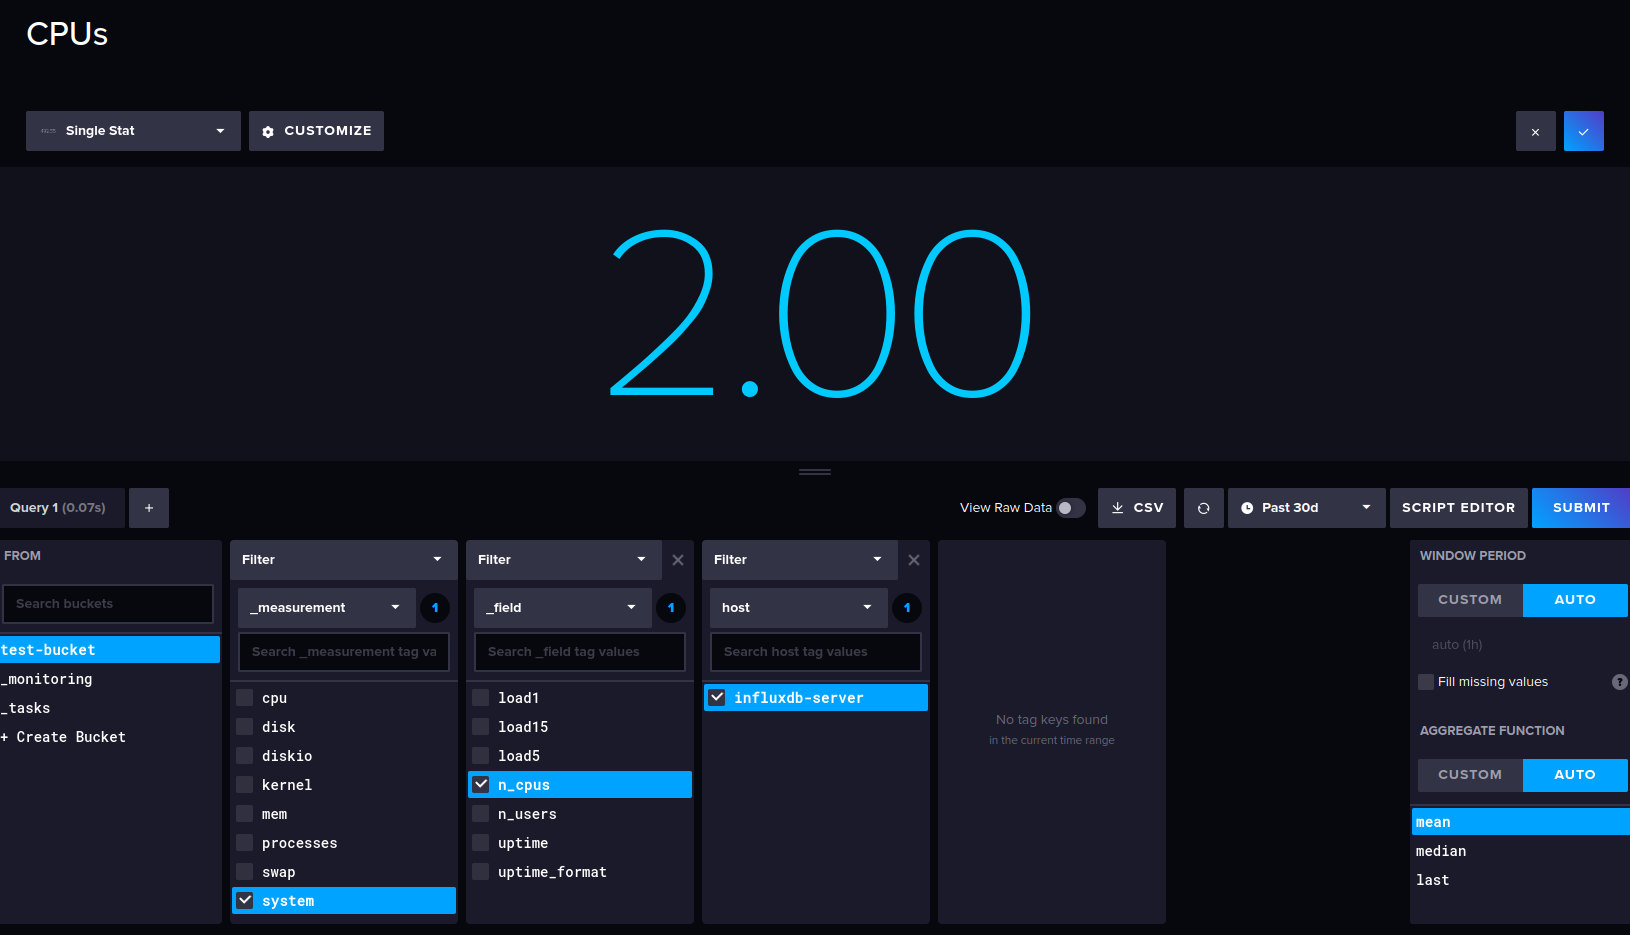
Lastly, below is the graph for the available CPUs on the system.
With those cells for system monitoring, you should get the 'Test Dashboard' looks like the following screenshot.
You have successfully set up system monitoring via the influxdb server and telegraf. You have learned how to set up the influxdb dashboard and set up a cell for visualizing metrics from telegraf.
Conclusion
In this guide, you installed the influxdb time series database and the influxdb2-cli on a Rocky Linux 9 server. You also secured the influxdb deployment via SSL/TLS certificates and configured the influxdb server via the influx command line.
In addition to that, you installed and configured telegraf to collect and send metrics to the influxdb server via a secure SSL/TLS connection. And lastly, you created a dashboard for system monitoring via the influxdb server and telegraf.
From here, you can now visualize your systems and applications and set up the dashboard for monitoring. You can also set up influxdb tasks, set up alerting system, and many more.

