Best Grafana Alternatives For Data Visualization and Exploration
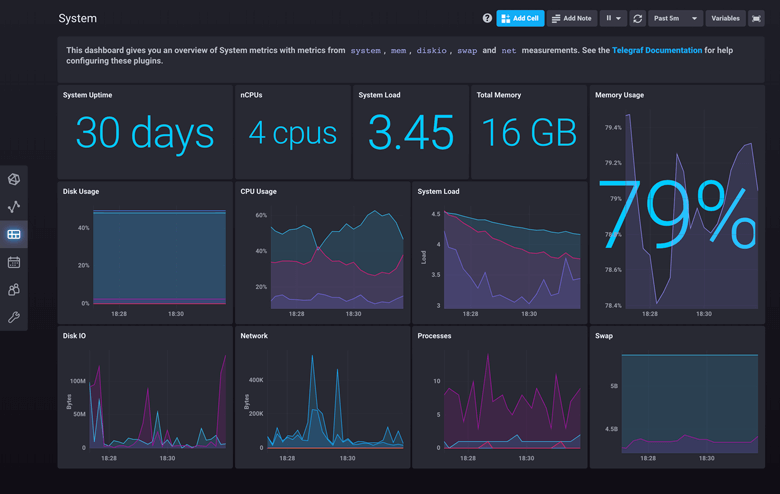
Grafana is a widely open-source platform for monitoring visualization that was first introduced in 2014. The application, developed by Torkel Ödegaard, is a well-liked option for programmers who want to query, visualize, and create alerts on time-series data gathered from a plethora of data sources, including InfluxDB, Prometheus, and Elasticsearch.
Startups frequently use Grafana as a simple and quick approach for monitoring and observability. Due to its adaptability and scalability, many big organizations also use Grafana. In addition to having a user-friendly interface, Grafana is also packed with features and can be set up to display metrics from multiple databases. For businesses running workloads on Kubernetes, Grafana is a popular solution. And for those who do not wish to self-manage their Grafana installation, the cloud service from Grafana is an excellent option.
Since you're here for a Grafan alternative, you probably run into this (probably biggest) Grafana limitation: Not suitable for company-wide business reporting and data exploration.
Grafana's default database is a time-series database, not an Online Analytical Processing (OLAP) engine. Therefore, it is optimal for IT metrics like server uptime and API latency but less appropriate for more dimensional business metrics where you want to cut the data by stuff like customer segment, product category, zip code.
A few other Grafana's limitations include:
- Limitations on dashboard organization and design.
- Its main use case is monitoring - so it's less effective when it comes to data exploration, especially when you involve non-technical business users.
- Limited data type visualizations.
Don't get me wrong - Grafana is the perfect tool for technical teams comprising DevOps engineers, software developers, data engineers, and scientists - its technical nature makes it less than ideal for business teams.
Top 09 Grafana Alternatives For More Diverse Use Cases
Which criteria did we use to pick these alternatives?
- They’re developer-friendly, like Grafana.
- Their price point is affordable - so it's easier for data teams to validate.
- They should have a good variety of visualization types.
- They should be approachable and accessible to business users.
From these criteria, let's dive in.
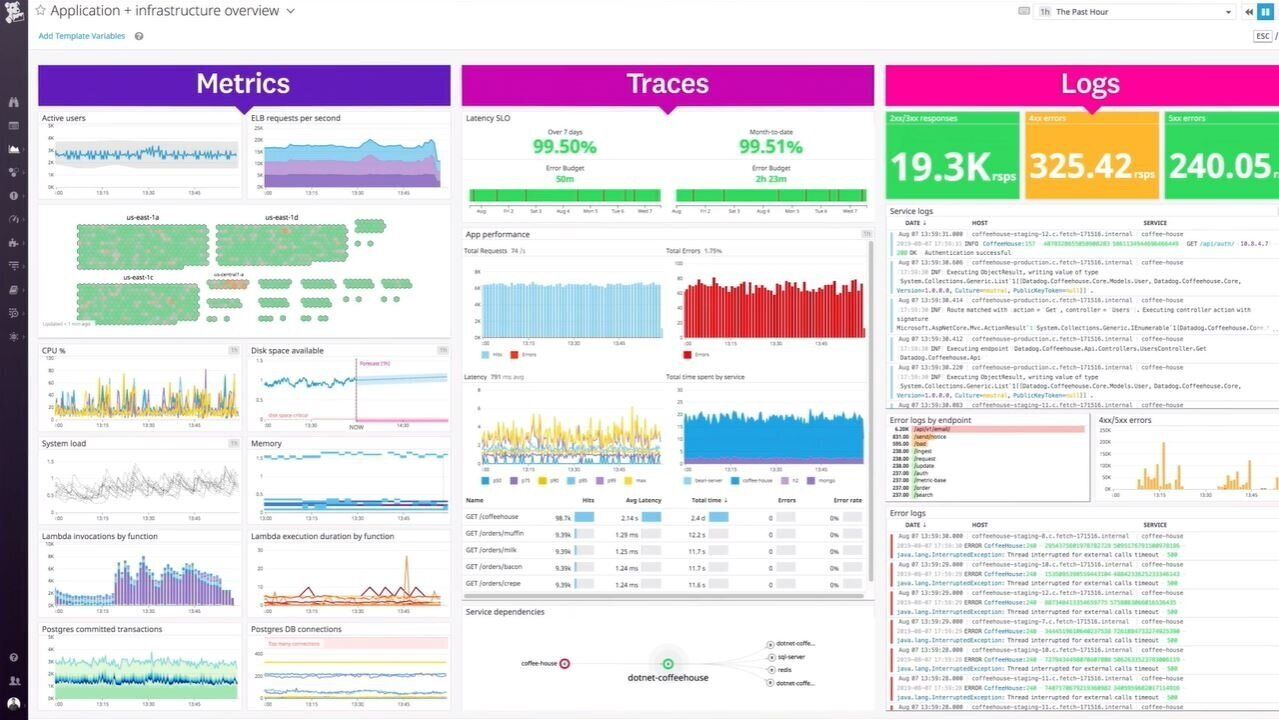
01. Datadog
Datadog, created in 2010, is a monitoring solution for IT, Dev, and Ops teams that develop and deploy applications at scale and want to convert the enormous amounts of data generated by their tools, services, and applications into useful insight. Grafana and Datadog are frequently contrasted as a solution for big businesses.
Initially designed in Python, Datadog now incorporates numerous open-source platforms like Apache Cassandra, Kafka, D3, and PostgreSQL. The following list includes some of its features:
- Statistics with graphs that make it simple to understand the data in detailed and adaptable metrics dashboards.
- Machine learning-based alerting
- Detailed log management with anomaly detection.
- Over 500 integrations
- Observability Pipelines to monitor the health of all of your telemetry pipelines
Pricing:
- 14-day free trial available.
- Usage-based pricing - allowing users to pay for one or multiple products as needed to support scale. Datadog charges based on log intake, per metrics, and per trace GB, much like Grafana. Only the infrastructure product has a free plan for up to 5 hosts and 1-day metric retention.
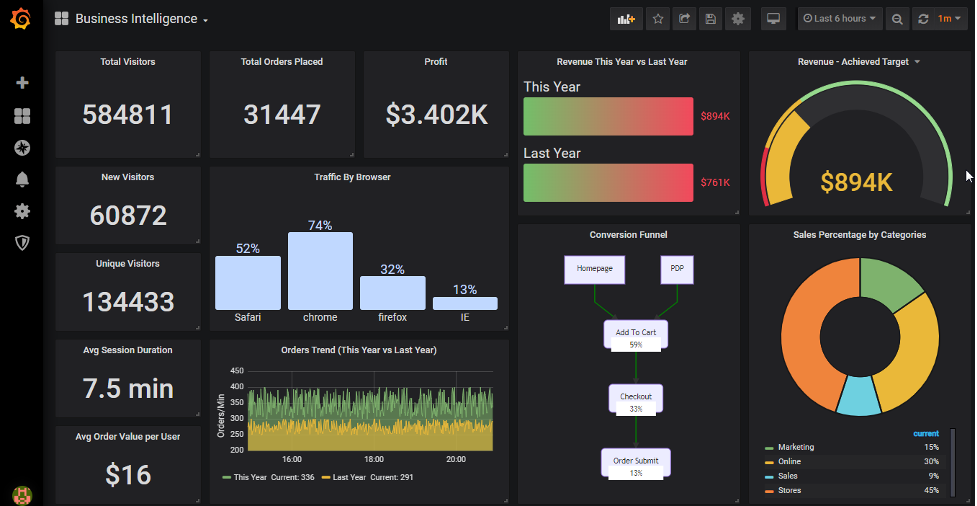
02. Holistics
Holistics is different from the rest of this list because it's geared more toward self-service analytics and business reporting.
Often compared with Looker, Holistics is a self-service BI platform providing a centralized data modeling approach for data teams.
With Holistics, data teams can create and govern a central definition of business metrics and data logic. Based on these predefined logics, business users can perform self-service data exploration, build their own reports, and get accurate analytics without repeatedly involving data analysts. Dashboards and data logic can also be serialized into code and checked into Git version control repository.
Some of its notable features are:
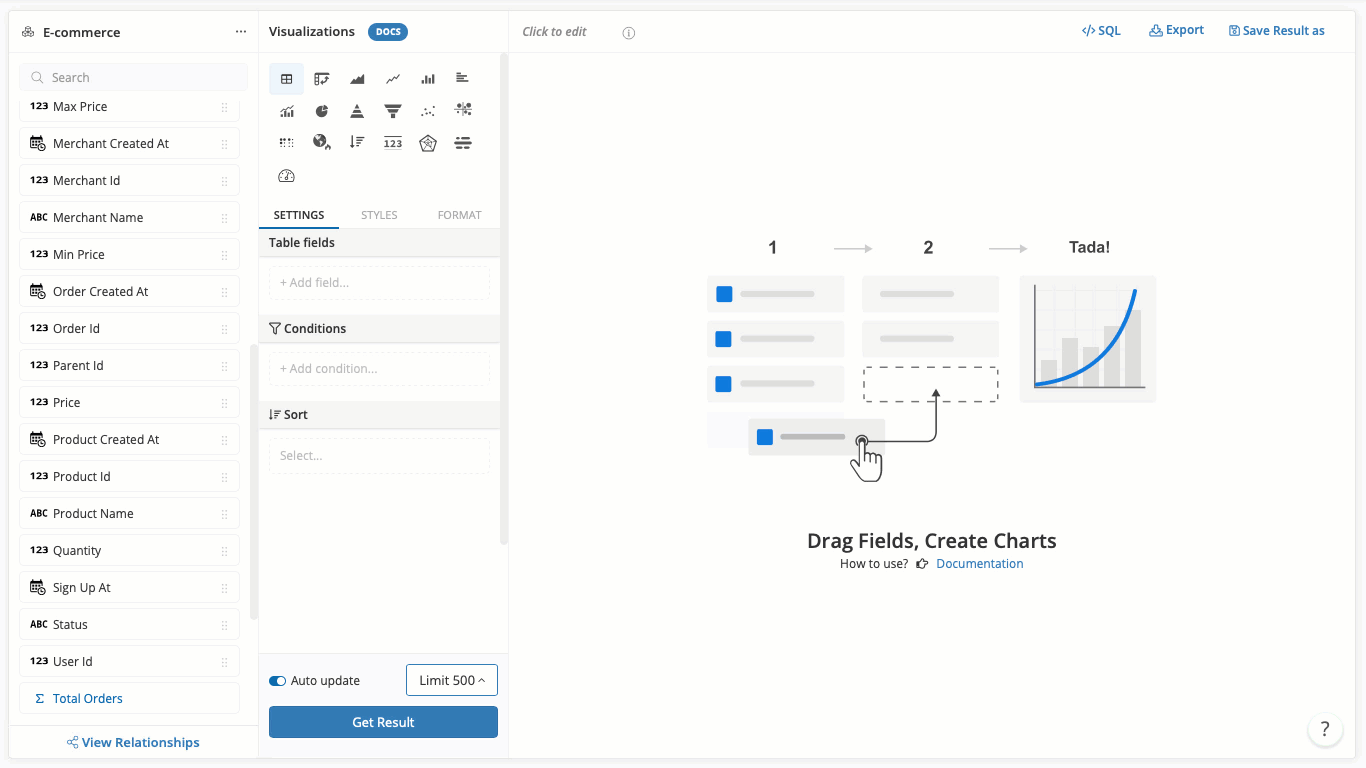
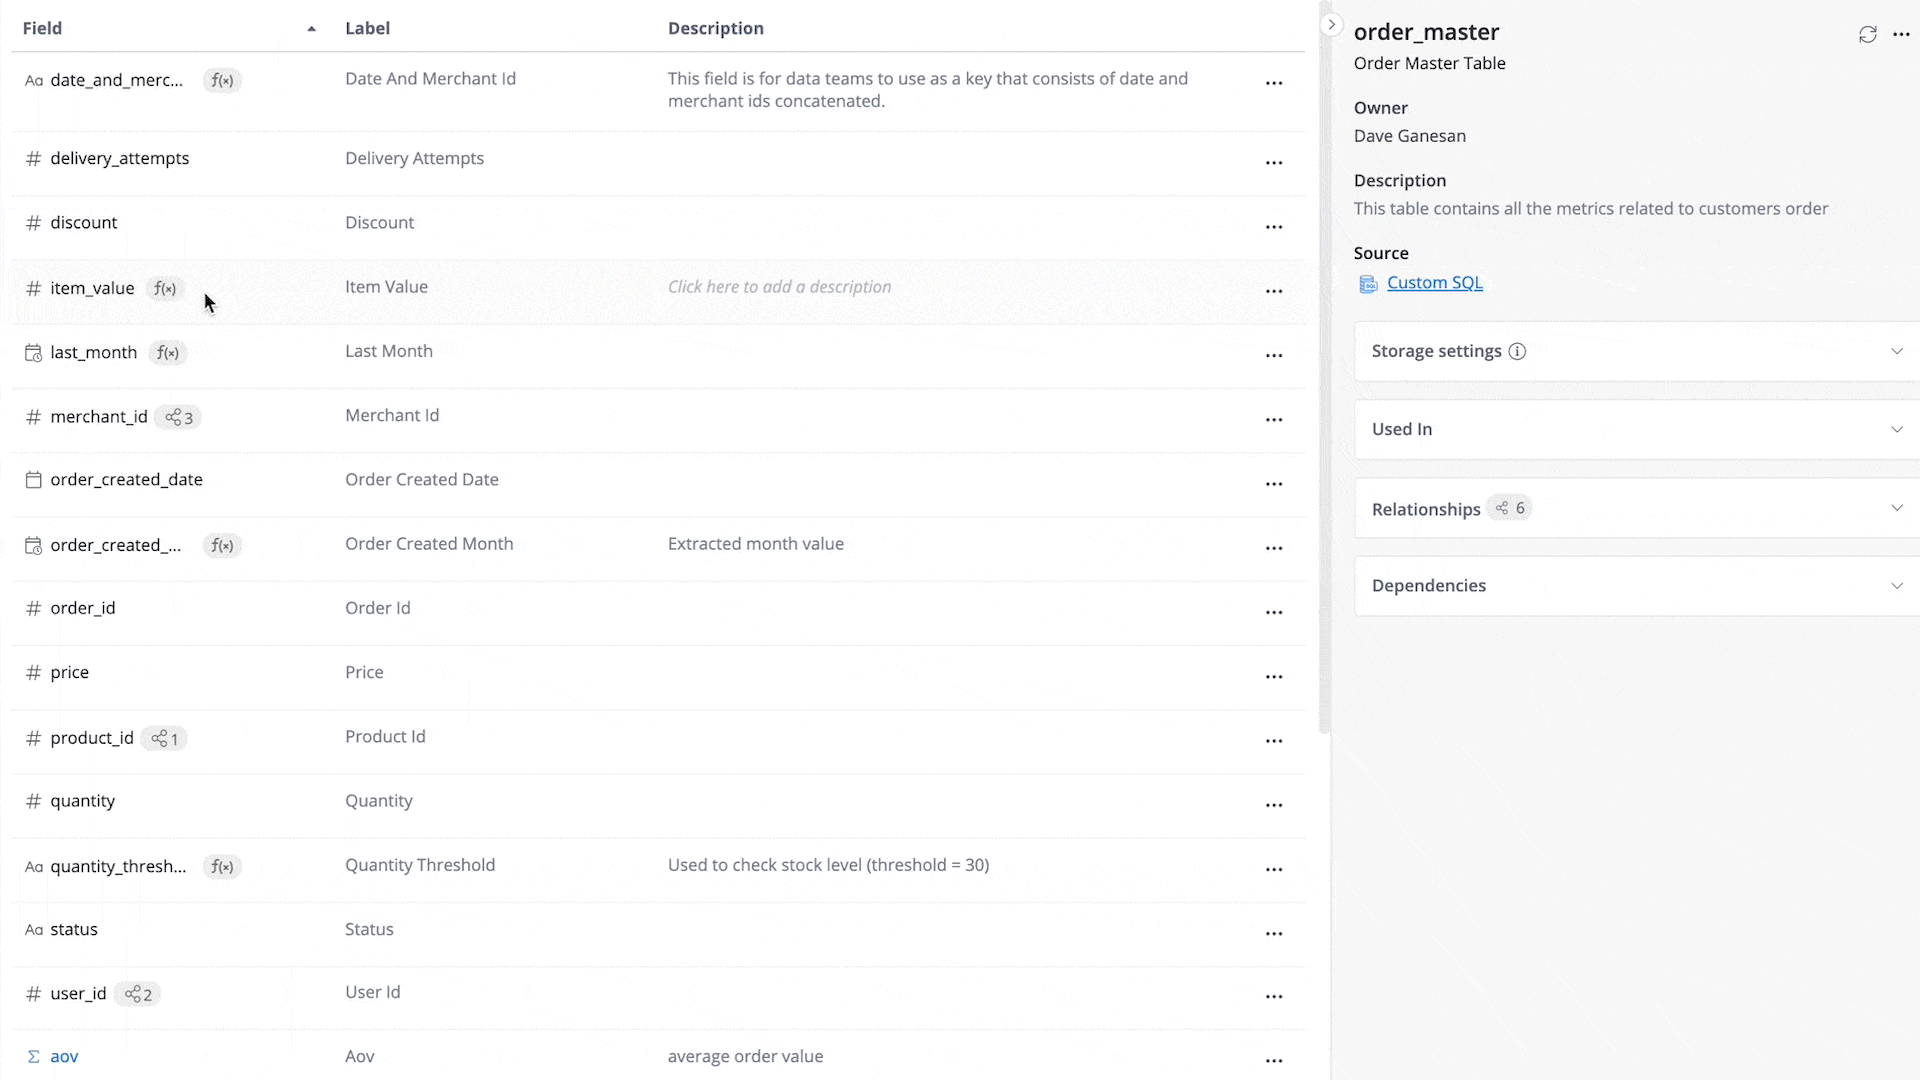
- Data modeling layer: A semantic layer that stores the logic mapping between the logical business layer and the physical data warehouse. This allows data teams to manage different data logics centrally, and the business teams to query data without having to learn technical SQL queries.
- Drag-n-drop report builders for non-technical users.
- Powerful delivery capabilities via Email/Slack Schedule and Alerts, Shareable links.
- Git version control available: Commit your analytics code to Git and track every change, perform branching, code reviews to ensure accurate analytics workflow.
- Define business logic, modeling and datasets using Holistics's custom DSL language (similar to LookML) for analytics.
- Seamless dbt integration: Perform data modeling and transformation at dbt layer, and push those definitions to Holistics BI layer
- Embedded dashboards for monitoring is also available (with unlimited viewers)
Pricing: 14-day free trial available.
- Entry Plan: $150/month (for PoC or analytics beginner)
- Standard Plan: $550/month (unlimited reports with full-functional features)
For more Business Intelligence recommendation, check out:
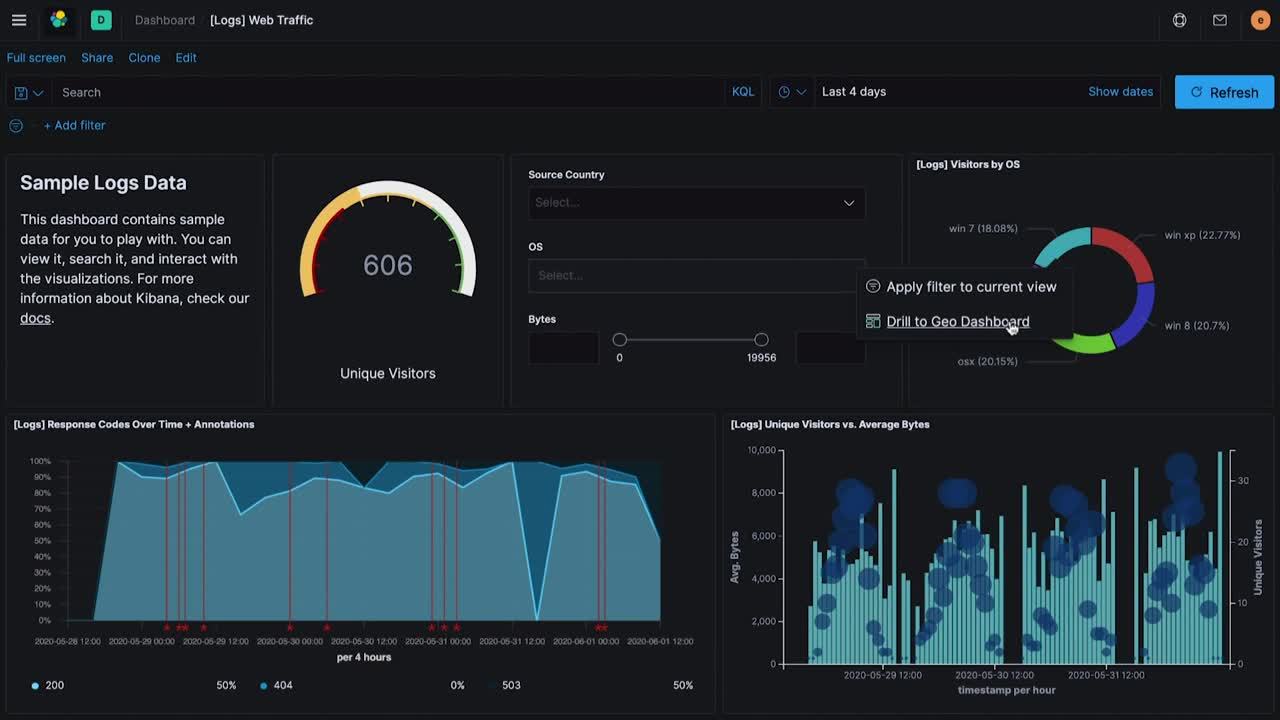
03. Kibana
Elasticsearch, Logstash, and Kibana are the three open-source programs that make up the acronym ELK. Kibana, the frontend component of the Elastic stack, is a web-based analytics application that gathers and analyzes data from various sources and displays it in a simple UI with graphs and visualizations. Because Kibana is written in JavaScript, it is a suitable option for both developers and non-developers.
Some of its other features are:
- Like Grafana, Kibana enables the creation of dashboards that can be tailored to different purposes. You can use Kibana to search Elasticsearch data using queries for particular events and display them using graphs, tables, maps, and other tools.
- It offers alerting and anomaly detection to monitor your apps.
- Its security component has features like role-based access control, single sign-on, security APIs, and anonymous access control among others.
- Users can easily share dashboards and reports by embedding them in websites and exporting them as CSV, PDF, or PNG.
- Additionally, it features elastic machine learning capabilities that automatically model the patterns, periodicity, and other characteristics of your Elasticsearch data in real-time to spot problems more quickly.
- Kibana's use is constrained by the fact that it necessitates usage in conjunction with other ELK stack products.
Pricing:
Risk-free trial
- Standard - $95 per month
- Gold - $109 per month
- Platinum - $125 per month
- Enterprise - $175 per month
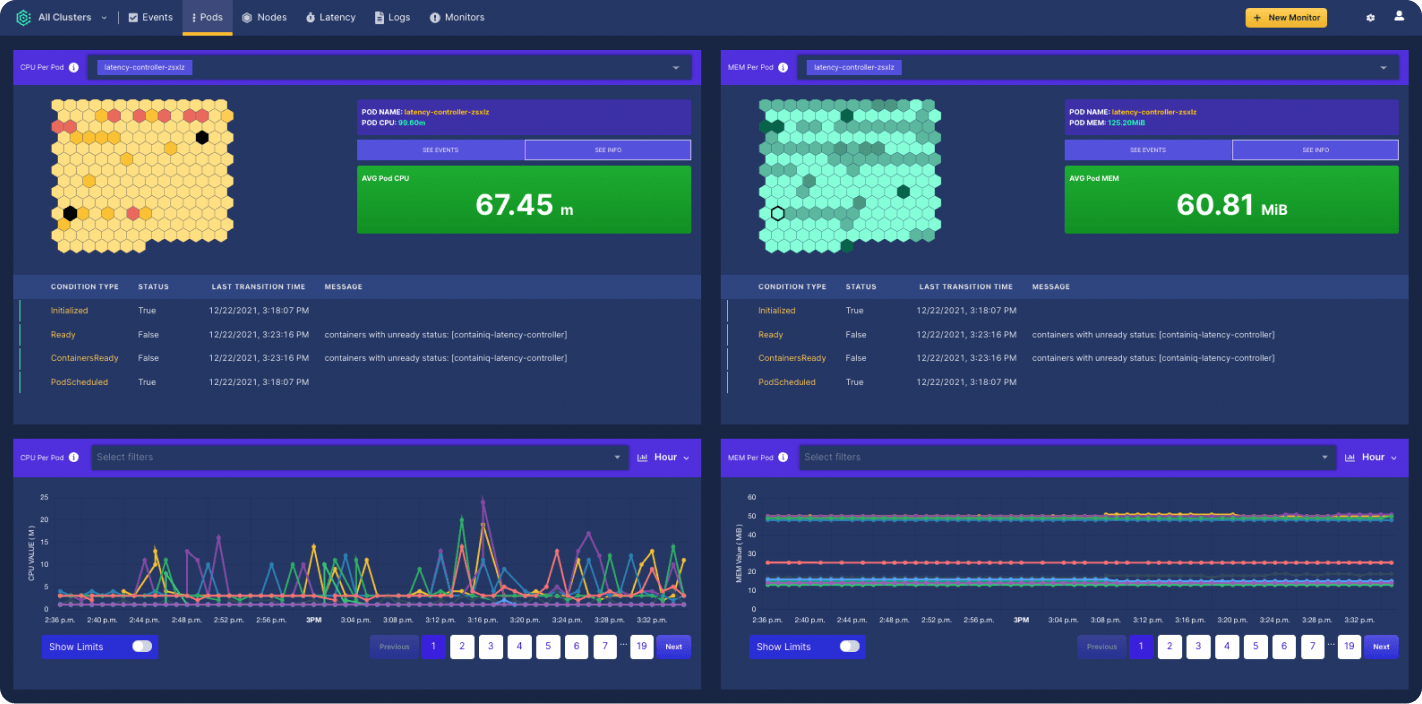
04. ContainIQ
ContainIQ is a viable substitute for Grafana Cloud. It is a Kubernetes-native monitoring and tracing platform that measures and correlates metrics, events, logs, and traces. With just one line of code, ContainIQ can be installed with the dashboards already set up and ready to use. At the microservice level, ContainIQ can operate without further configuration because it exists at the kernel level. Users can access Application Performance Management (APM) functionality using ContainIQ without it really being an APM.
Features:
- Users can monitor, group, and visualize Kubernetes metrics using intuitive dashboards. Its native Prometheus integration also enables users to create custom metrics.
- Events monitoring gives users insight into historical records.
- ContainIQ’s 14-day log retention feature allows for unlimited log ingest. It also comes with dynamic filtering, alerting, and correlation additions.
Pricing:
- 14-day risk-free trial
- Power plan - $20 per node per month, $0.50 per GB of log data ingested
- Custom - Contact ContainIQ for customized billing options
05. Cyclotron
Cyclotron is an open-source, web-based dashboard creation and hosting platform that works with any data source, including Elasticsearch, Graphite, InfluxDB, Prometheus, and more. This means that regardless of where your metrics are, it enables you to query and display them. Users can load and visualize data without any programming knowledge.
Cyclotron is a great option for developing dashboards for your apps or combining them with other applications. Its source code is publicly accessible on GitHub and can be readily modified and adjusted as necessary.
Features:
- Cyclotron offers several features for creating dashboards. You can create your own widgets or select from a library of pre-made ones to use while creating your dashboard.
- Cyclotron has an advantage over Grafana because it offers a wider range of widgets, such as data visualization, text and markdown editing, table calculation, and more.
- It's easy to embed your dashboard on a website or export it as a PDF or image. You can also share it with other Cyclotron users so they can edit or add to it.
- Non-programmers can quickly design and edit dashboards using customizable components thanks to Cyclotron's standard boilerplate. It hosts the dashboards natively and includes a built-in dashboard editor.
Because its main feature is dashboarding, Cyclotron offers no logs, tracing, or monitoring features. Additionally, dashboard interactivity is quite limited.
Pricing:
Free
Related reading: Community Crowd-Sourced BI Tools Comparison Matrix: Feature-to-Feature Comparison
06. Splunk
Splunk is a software platform commonly used for real-time machine-generated data monitoring, searching, analysis, and visualization. In addition to producing graphs, alerts, dashboards, and visualizations, it performs the task of capturing, indexing, and correlating real-time data in a searchable container.
Splunk can be integrated with NoSQL and relational databases, as well as linked to your workflow tools.
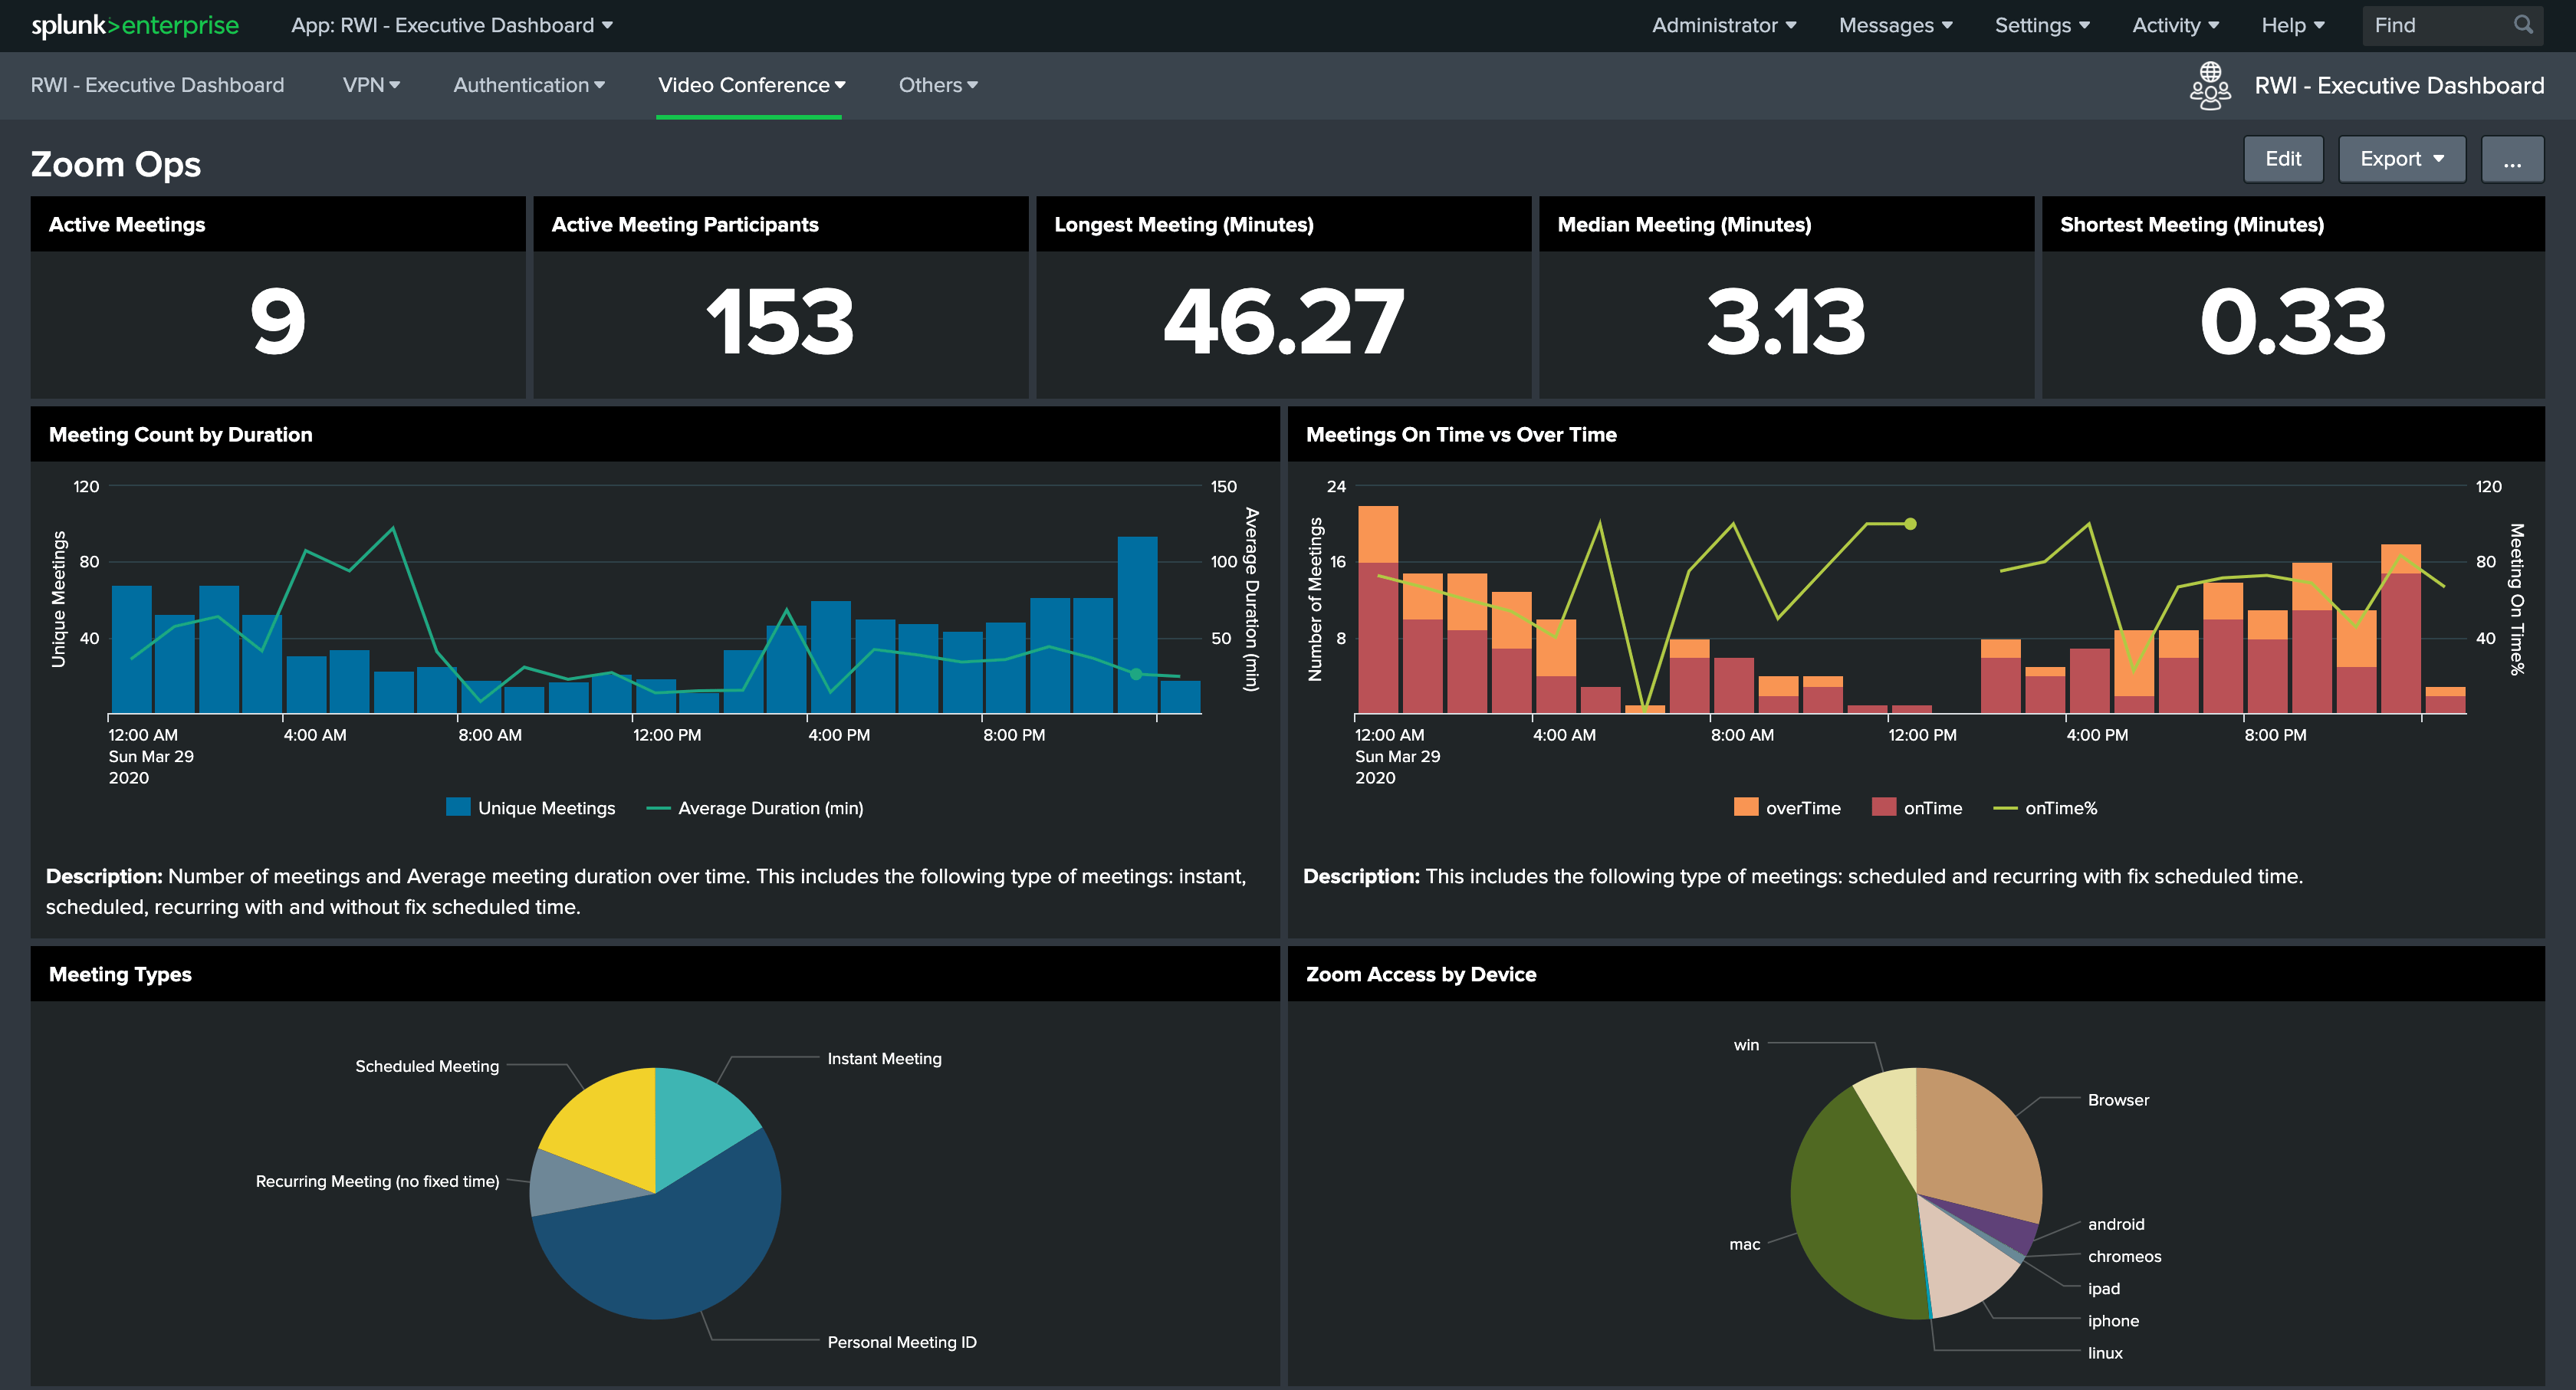
Features:
- Users can create metrics to analyze performance, find patterns, forecast future trends, and then use dashboards to present them with a variety of displays.
- Splunk enables synthetic monitoring and has a rich feature set. There are also a variety of connections available, such as PagerDuty and Slack that enable users to keep tabs on end-user performance indicators and receive alerts about them.
- Additionally, Splunk's more than 300 pre-built recommendations make it simple to optimize and enhance end-user journeys.
- Benchmarking, which enables you to evaluate how well your services perform compared to rival companies or those in your sector, is one of the more intriguing features.
- Splunk integrates with over 50 technologies and services like Amazon Web Services, Google Cloud Platform, and Kubernetes, among others.
Pricing:
- Free 14-day trial
- Splunk Security Solutions - Contact Splunk for pricing details
- Splunk Observability Solutions - $65 per host/month
- Splunk Cloud Platform - Contact Splunk for pricing details
- Splunk Enterprise Platform - Contact Splunk for pricing details
07. Graphite
Many organizations use Graphite, a straightforward open-source monitoring tool, to track and graph time-series data. Graphite is like Grafana's older brother. Its users can save metrics as time series data and use these metrics to create graphs. It allows team members to plot data from multiple sources on a large scale. It can hold, query, and visualize time-series data collected from anywhere including servers, devices, systems, and websites.
Graphite's dashboard typically has just one or two types of visualization and it displays metrics more straightforwardly than Grafana, albeit with less visualization flexibility.
Features:
- Graphite integrates with a wide range of technologies and has more integrations than Grafana.
- Graphite aids in error detection, leading to continuous improvement.
- It also aids in the triggering of alerts for specific events.
- Graphite collects metrics and graphs observations taken in chronological order to display trends and patterns. The collected time series data is then analyzed and forecasted for future events.
- It provides an API that allows developers and engineers to keep time-series data on hand as needed.
- Graphite has a large and diverse user community.
- It allows users to view templates in various formats such as XML, CSV files, images, and JSON.
Pricing:
Free
08. InfluxDB
InfluxDB is an open-source time series database created by InfluxData. It is designed for high-performance, high-availability storage, and retrieval of time series data in applications. It is written in the Go programming language, and it supports the processing of data from Graphite.
InfluxDB is a fast Time Series Database that can store data at hundreds of thousands of points per second. InfluxDB is a SQL-like query language designed specifically for time series data.
Features:
- Analytics and deep insights
- Developers have access to its custom libraries and APIs.
- It supports Javascript, Python, Go, PHP, and C#.
- Its templates are simple to create and share
- InfluxDB has an intuitive dashboarding tool that comes with a variety of visualizations
- It has a large community and ecosystem of cloud and open-source developers.
Pricing:
InfluxDB Cloud
- Free Plan
- Usage-Based Plan - $0.002 per MB of data written in, $0.01 per 100 query executions, $0.002 per GB hour for storage, $0.09 per GB for data transferred out
- Annual Plans - Contact InfluxDB
InfluxDB Enterprise - Contact InfluxDB
09. NetData
NetData is a free, web-based application for monitoring real-time performance and infrastructure health. It takes data from servers, applications, and devices and displays it in engaging visualizations on its dashboards. DevOps and SysAdmins who want to visualize data from systems, apps, servers, containers, and microservices should use NetData. NetData was developed using cutting-edge technologies like NodeJS, React, and Redis.
Unlike Grafana, NetData enables you to store the captured data for possible future use in custom reports.
Features:
- NetData's core feature is real-time performance monitoring of system resources, which provides a detailed picture of system activity. It can assist users in identifying bottlenecks, detecting failed resources, and creating alarms.
- It has over 80 pre-configured, highly interactive, and customizable dashboards that can be generated on the fly.
- It allows you to keep an eye on everything, including system performance and application logs.
- NetData has a user-friendly UI and is quick and non-blocking.
- The software also provides data streaming from remote sources, scripting, custom branding, templating, and plugins. Graphs can be used to build dashboards, or they can be added as a widget to an existing graph.
Pricing:
- Free plan
- A paid plan with extra features will soon be available
Related reading: The Best Embedded Analytics Tool and How To Evaluate Them
What's happening in the BI world?
Join 30k+ people to get insights from BI practitioners around the globe. In your inbox. Every week. Learn more
No spam, ever. We respect your email privacy. Unsubscribe anytime.