Logagent: The Swiss Army Knife for Log Processing?
Guest post by Stefan Thies DevOps Evangelist at Sematext Group Inc.
Dealing with log files or extracting data from various data sources is a daily task in the IT administration. Users ask about statistics or details of their technical or business operations. The relevant data is often present in log files, databases or message queues. Converting data from various sources into actionable knowledge can be a challenging task. For automation of ETL tasks we often see a mix of various scripting languages used. Elastic Stack is a popular toolset to analyze structured and unstructured data. While Logstash is a very feature rich tool, it uses a lot of system resources. Filebeat is lightweight but is not very flexible when it comes to data transformations. People combine Filebeat with Logstash or Elasticsearch ingest pipelines to overcome these issues. Is there a simpler alternative? Logagent is one of the open source Logstash alternatives.
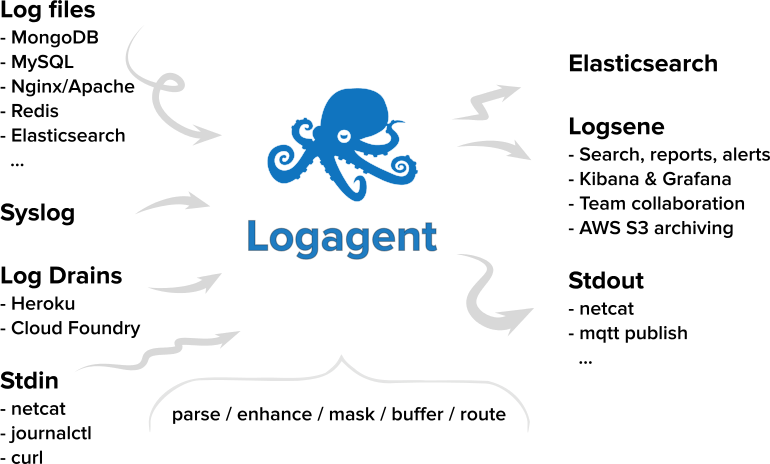
Logagent is not limited to use with Elasticsearch. It has output plugins for files, MQTT, InfluxDB, Apache Kafka, ZeroMQ, Graylog, Sematext Cloud, and more.
Table of Contents
What is Logagent
Logagent is a modern, open-source, lightweight log shipper with out of the box and extensible log parsing, on-disk buffering, secure transport and bulk indexing to Elasticsearch, InfluxDB and Sematext Cloud. The low memory footprint and low CPU overhead make Logagent suitable for deploying on edge nodes and devices. On the other hand its ability to parse and structure logs makes it a great Logstash alternative for centralized buffering and processing. A rich set of plugins supports inputs and outputs for various SQL, NoSQL and time series databases.
Introduction to Logagent
Logagent can be used as either as a command line tool or as a service.
The Logagent setup requires Node.js runtime.
A typical task is to parse log files and structure text lines in multiple fields to create, later on, analytics dashboards in Kibana, InfluxDB or Sematext Cloud.
Logagent is able to parse many log formats such as web server, database, message queues or search engine logs. The log parsing patterns are defined in a file called patterns.yml. The configuration accepts file references to pattern files. The “hot-reload” of patterns makes changes in production environments painless.
The default pattern definition file comes with patterns for:
- Web server (Nginx, Apache Httpd)
- MongoDB
- MySQL
- Redis
- Elasticsearch
- Zookeeper
- Cassandra
- Postgres
- RabbitMQ
- Kafka
- HBase HDFS Data Node
- HBase Region Server
- Hadoop YARN Node Manager
- Apache Solr
- various other formats e.g. Linux/Mac OS X system log files
If an application logs in JSON, Logagent recognises it out of the box. By default Logagent operates in multi-line mode. This means indented log entries like stack traces are processed out of the box. Application-specific multi-line parser rules can be specified in the patterns definitions.
Parse and output web server logs
Let us start with some handy commands to demonstrate Logagent usage. Parsing a web server log on the command line and writing it as JSON file in a new file is as easy as:
cat access_log | logagent -n httpd > access_log.jsonThe “-n httpd” references the web server log pattern pre-defined in patterns.yml to structure web server logs. Logagent could detect the log structure automatically (no need for -n) when you set the environment variable SCAN_ALL_PATTERNS=true. This option costs CPU time, because Logagents iterates over all pattern definitions until it finds a matching pattern. Therefore SCAN_ALL_PATTERNS=false is the default value.
To see web server logs in YAML format and enrich them with GeoIP information on the console just type:
tail -f access_log | logagent -n httpd --yaml --geoipEnabled=trueLogagent has various ways to mask fields by truncating IP addresses, hashing or encryption. Those shipping logs and wanting to comply with the GDPR regulations might be interested in masking sensitive data in web server logs.
Ship log files to Elasticsearch
Seeing structured logs on console is nice, but typically we want to store logs in Elasticsearch for analysis with Kibana. We just need to tell Logagent where Elasticsearch is running and the index in which data should be written
tail -f access_log | logagent -n httpd --yaml -e https://localhost:9200 -i my_log_indexNice and easy for one file, right? But if we want to read all logs from /var/log and ingest them all in Elasticsearch we could use glob patterns to discover new log files in a log directory:
logagent -g '/var/log/**/*.log' -e http://localhost:9200 -i my_log_indexLogagent buffers logs to disk and retries failed indexing requests. Failures happen for various reasons (e.g. network down, red cluster state, wrong mapping settings, node down, etc). Reliable log shipping is possible without complicating the log processing pipeline with external persistent queues like Apache Kafka.
Ship log files to cloud services and time series databases
You don’t have a local Elasticsearch & Kibana setup? Not a problem. Sematext Cloud is effectively managed Elasticsearch, so one can use Logagent to ship logs there. Simply use the Sematext logs token and Sematext receiver URL in the Logagent command:
logagent -g '/var/log/**/*.log' -e https://logsene-receiver.sematext.com -i SEMATEXT_LOG_TOKENYou can see more detailed info at https://apps.sematext.com/ui/howto/Logsene/logagent.
Once data gets shipped, you can create your Dashboards in the Sematext UI or in the integrated Kibana. Sematext Cloud is not the only supported Elasticsearch alternative. Logagent supports AWS Elasticsearch service plugin, InfluxDB or Influx Cloud plugin and other destination via Logagent plugin modules.
Aggregate logs with in-memory SQL
In case you have a large number of log entries, it makes sense to pre-aggregate logs with the in-memory SQL feature. The SQL output filter buffers all logs for a specified period and runs a SQL query. The result of the SQL query is then passed to the Logagent output modules. The below configuration file creates a logging pipeline with the following functionality:
- Stream web server logs from a file (like tail -F)
- Run aggregation query with in-memory SQL. Use the SQL filter to select e.g. security related messages like logins from the log file. You can apply multiple SQL statements for the same input.
- Output results to Elasticsearch
input:
  files:
    - '/var/log/*/access.log'

outputFilter:
  - module: sql
    config:
      source: !!js/regexp /access.log|httpd/
      interval: 1 # every second
      queries:
        - # calculate average page size for different HTTP methods
          SELECT 'apache_stats' AS _type,
                  AVG(size) AS size_avg,
                  COUNT(method) AS method_count,
                  method as http_method
          FROM ?
          GROUP BY method
        - # log each request to the login page
          SELECT *
          FROM ?
          WHERE path like "/wp-login%"
output:
  elasticsearch:
    module: elasticsearch
    url: http://localhost:9200
    index: mylogs
Finally, you run Logagent with the SQL config:
logagent --config logagent-web-sql.yml --yaml --printStats 10The –yaml option above shows the output on the console, so you can combine static configuration file settings with command line arguments. Very handy while testing configurations before going live. The argument –printStats N, prints every N seconds processing statistics to console.
Ahh, one more Logagent specific thing. It writes its own logs to stderr only. Why? Stdin and stdout are always available for piping the input/output to other command line tools. For example:
cat someting | logagent --config myconfig.yml | netcat ...
Transform data structures with JavaScript
Finally, let’s explore Logagent’s powerful JavaScript scripting feature. In the following example we read data with the command plugin (curl) from a Prometheus metrics URL and ship the data to Elasticsearch. The Prometheus data format is not very handy for creating Kibana visualisations, so we can use a JavaScript function in the configuration file to transform the data structure:
input:
  docker-prometheus:
    module: command
    command: curl http://127.0.0.1:9323/metrics
    sourceName: prometheus_metrics
    debug: false
    restart: 10

parser:
  patternFiles: []
  patterns:
    - # prometheus
      sourceName: !!js/regexp /prometheus_metrics/
      match:
        - type: prometheus_metrics
          regex: !!js/regexp /\sHELP|\sTYPE\s/i
          inputDrop: !!js/regexp /#\sHELP|#\sTYPE\s/i
        - type: prometheus_metrics
          regex: !!js/regexp /(\S+)({.+?})\s([\d|\.]+)/i
          fields:
            - name
            - labels
            - value
          transform: !!js/function >
            function (p) {
              try {
                if (p.name) {
                  p.name_space=p.name.split('_')[0]
                }
                if (p.labels) {
                  // hack, make JS code out of key/value format to parse properties
                  p.labels = eval ('x=' + p.labels.replace(/=/g,':'))
                  var l = Object.keys(p.labels)
                  // convert prometheus numbers in quotes to JS numbers
                  for (var i=0; i<l.length; i++) {
                    var n = Number()
                    if (!isNaN(p.labels[l[i]])) {
                      p.labels[l[i]] = Number(p.labels[l[i]])
                    }
                  }
                }
              } catch (err) {
                console.log(err)
              }
              p[p.name]=p.value
              return p
            }
        - type: prometheus_metrics
          regex: !!js/regexp /(\S+)\s([\d|\.]+)/i
          fields:
            - name
            - value
          transform: !!js/function >
            function (p) {
                if (p.name) {
                  p.name_space = p.name.split('_')[0]
                }
                p[p.name]=p.value
            }


output:
  stdout: yaml
  logsene:
    module: elasticsearch
    url: https://localhost:9200
    index: prom_stats
Once you browse the plugin repository, you will see that Logagent can be used for a number of advanced scenarios like:
- Create Apache Kafka producers and consumers without any programming
- Create IoT sensors just with Logagent configurations: Air Pollution Tracking with Node.js, Elastic Stack, and MQTT
- Detect Malicious traffic in your server logs
- Mask, hash or encrypt sensitive data: GDPR and web server logs
We hope this post will help get you started with Logagent. If you like the tool, send us a tweet. If you face any issues, don’t hesitate to file them on Github!