Test Studio Step-by-Step: Load Testing

It’s great that your automated tests show that your application is working correctly. But now you need a load test to see what your application does when users start showing up.
You’ve been using Telerik Test Studio to create automated tests that demonstrate that your application works “as intended” as it evolves (“functional tests”).
But now you want to test for something new: How well does your application perform (“non-functional tests”)? Particularly, you want to know how your application behaves “under load”: What happens to your application as the number of users increases or as users perform “demanding” tasks (large uploads or downloads, for example). This is the essence of load testing.
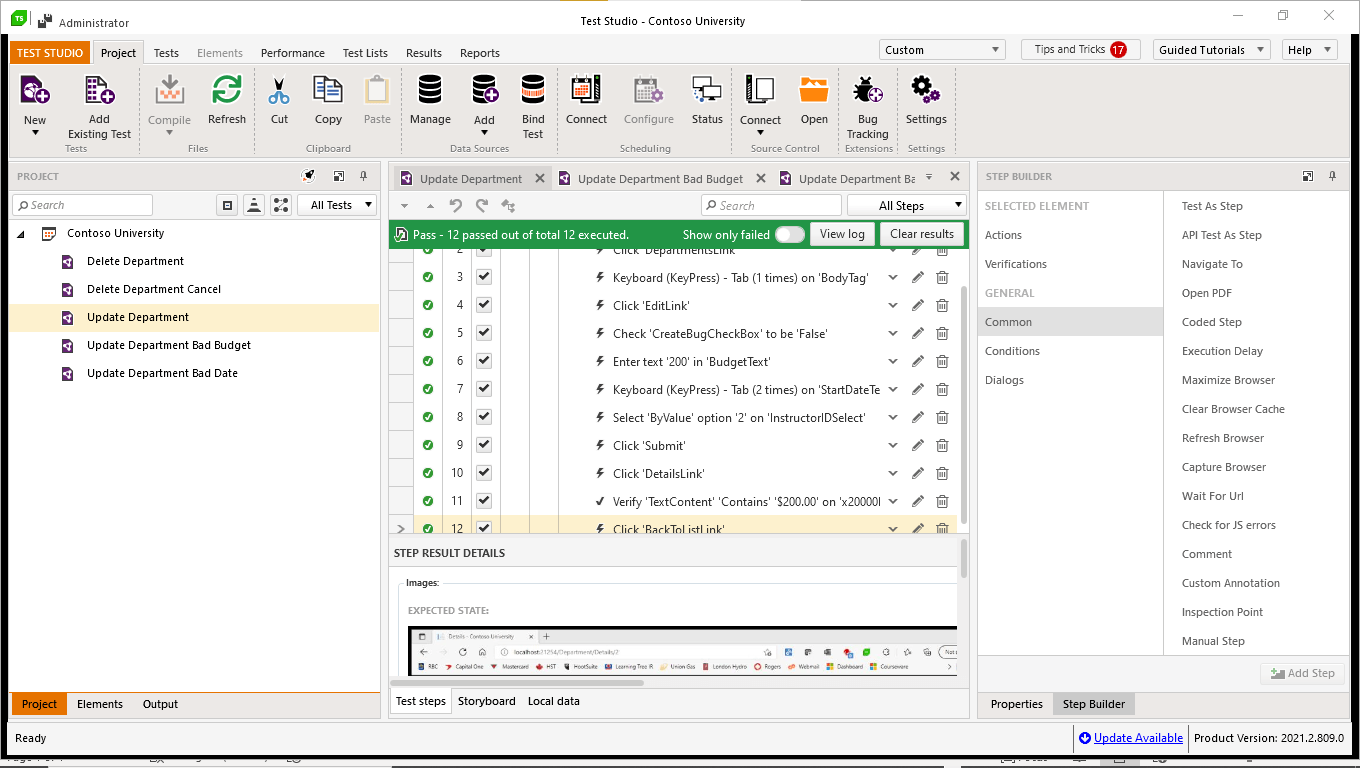
Test Studio lets you create load so you can determine how your application performs under expected loads (both typical and peak). But you can use a Test Studio load test two other ways:
- Stress test: How does your application perform under extreme conditions? Specifically: How much load can your application address before it breaks?
- Soak test: How does your application perform over time with the expected combination of typical and peak loads?
Because of the duration and level of demand required by these kinds of tests (potentially hundreds of users and over multiple days), the only way to perform them is to use an automated tool like Test Studio. Test Studio will not only let you run load tests (and use them for stress and soak testing), Test Studio will also let you leverage any existing functional test scripts you’ve already created to create your load test. This enables you to do some “shift left” test design and move your load tests to earlier in your testing process.
Creating a Load Test
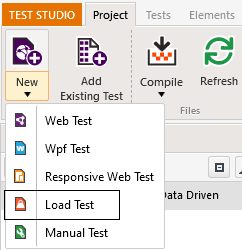
Adding a load test to a project is easy. From Test Studio’s menu, in the Project tab, select New | Load Test. (You can also access all the code for this post here.)
After naming your test, it will appear in your project.
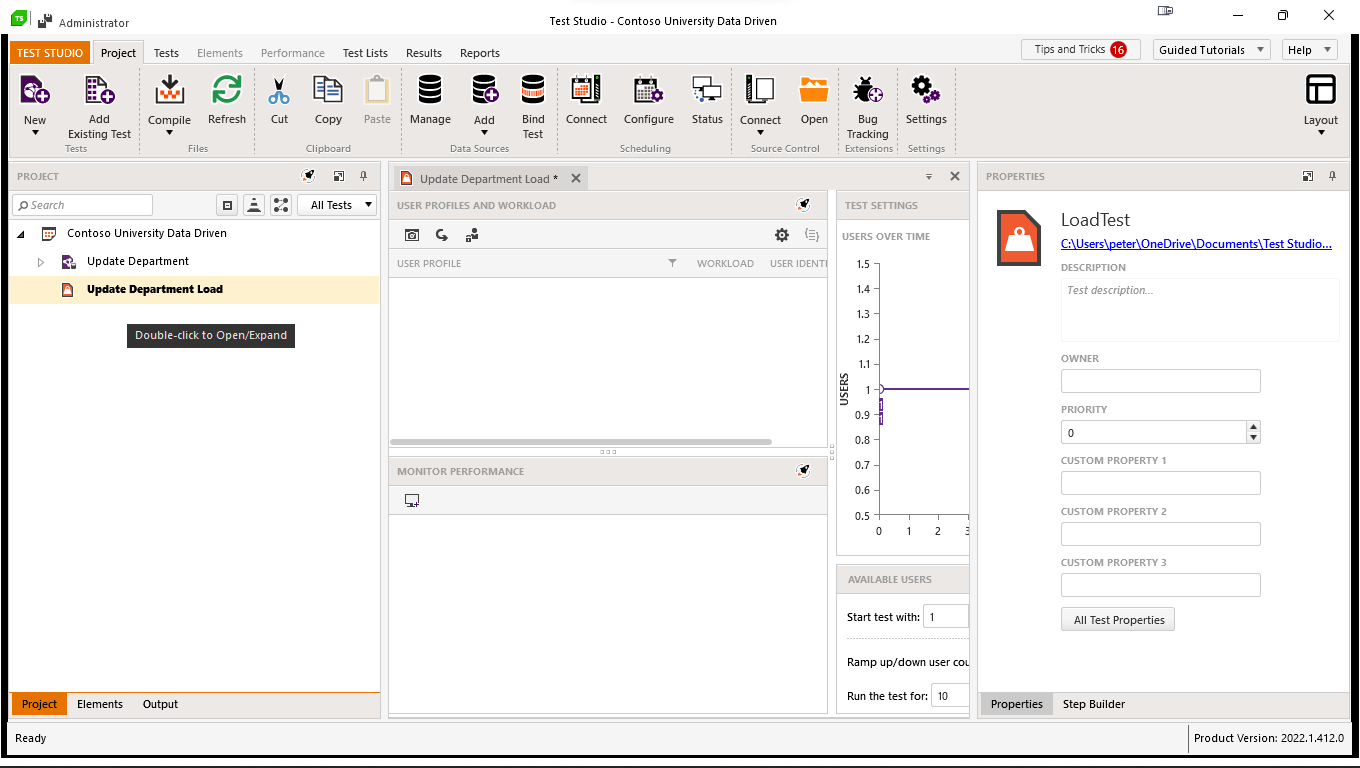
Your next step is to start adding user profiles to your test. A user profile in a load test is similar to a test script in a functional test—a user profile is a specific set of actions that represents a typical user’s interaction with your application. The type of actions recorded in a user profile are different, though: While a functional test records the user’s interaction with the UI, a user profile records the browser’s interaction with the server.
To start creating your user profile, move to the User Profiles and Workload pane in the middle of the Test Studio window (you may need to unpin Test Studio’s Properties and Step Builder panes to fully expose this pane). If that pane isn’t displayed, either double-click on your load test in the Project pane on the left side of Test Studio or, on the Test Studio menu’s Tests tab, click the Design icon.
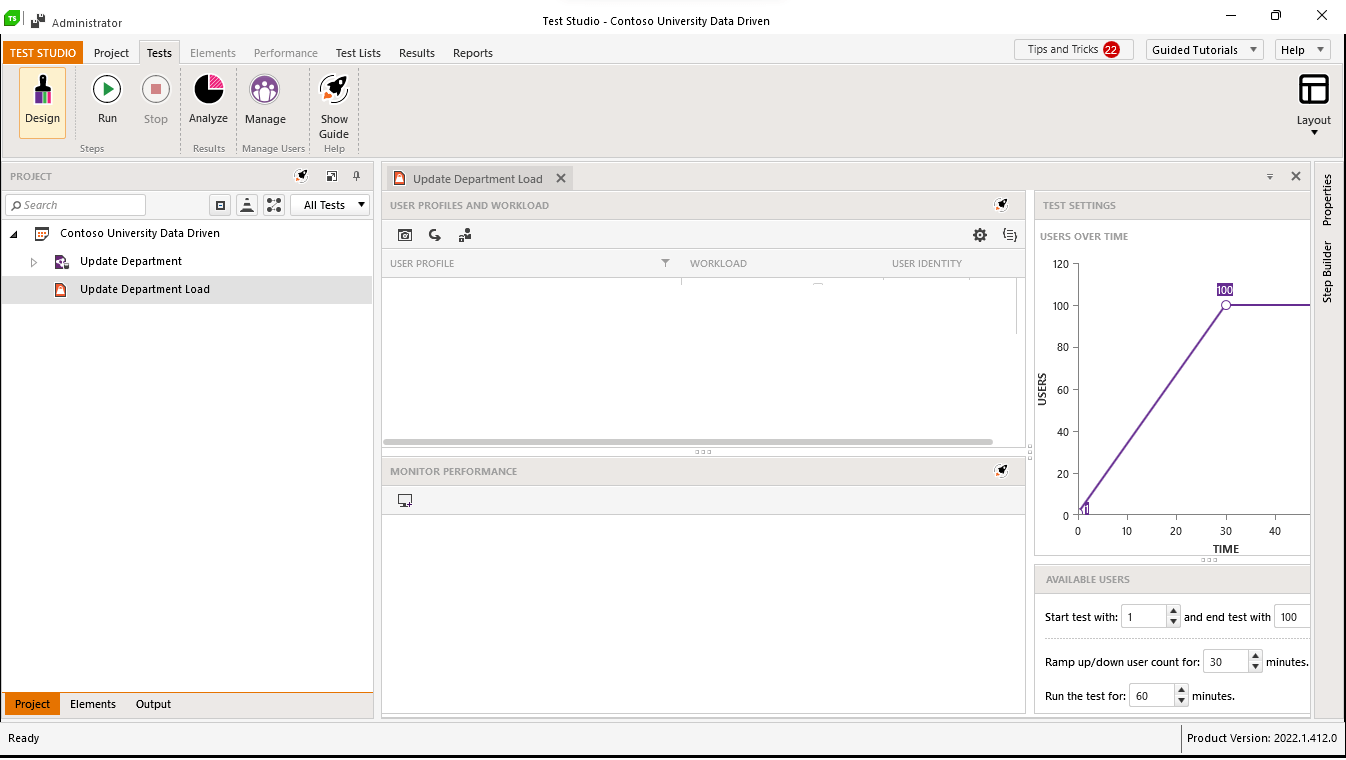
To create your first User profile, click on the Capture User profile icon to add a user profile.
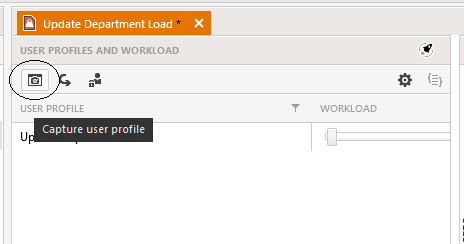
That will open the Capture Traffic dialog.
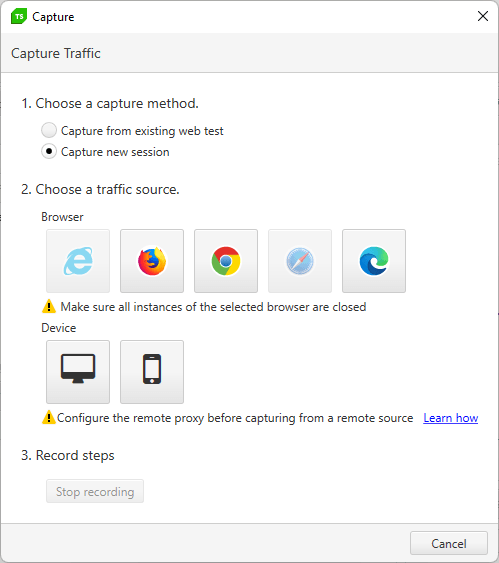
In this dialog you have two choices for creating a user profile:
- Capture from an existing web test (i.e., use an existing test script from the same project)
- Capture a new session (i.e., record a new set of actions)
Regardless of what option you pick, you’ll need to select one of the browser icons listed in Step 2. However, what happens after you pick the browser icon depends on which option you pick in Step 1.
If, in Step 1 of the Capture Traffic dialog, you pick Capture a New Session (the default), then once you’ve selected the browser you want to use, Test Studio will start the browser so your can record the actions that make up your user profile. Just like creating a test script, you’ll work through your application performing the actions you want to be part of your user profile. Test Studio will capture your actions to create the user profile.
While this is very similar to the experience of recording a test script, you’ll notice three differences:
- During the recording, you won’t have access to the Test Studio floating tool bar.
- The resulting user profile just records the browser’s interactions with the server (i.e., GET and POST requests with their corresponding responses).
- Because of that focus, after the recording, the editor for making changes to your user profile is more limited that when creating a test script.
If you’ve been recording test scripts, you’ve probably realized that recording a user profile isn’t going to be trivial. However, if you accidentally record some actions that you don’t want to be part of you user profile, you’ll have the option to delete them after you finish recording. You can also record your user profile against one server (e.g., your development server) and then, later, modify the profile to run against another server (e.g., your test server).
Still, for any user profile that involves more than a few interactions with the application, you may prefer to use an existing test script because it gives you more options for modifying your recording. In that case, in Step 1, choose Capture from an existing web test. With that option, Test Studio will display a list, just below Step 1, of all the scripts in your project.
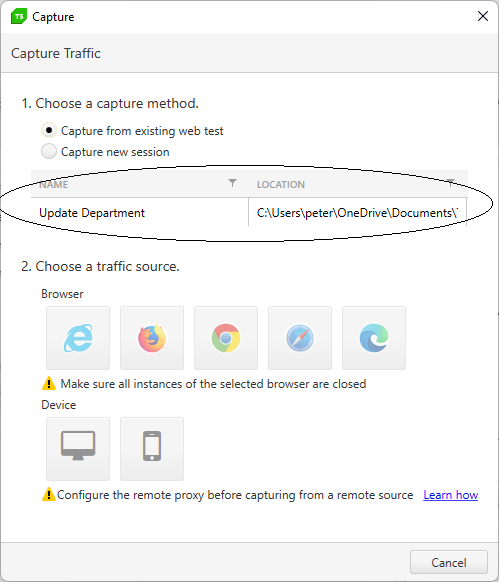
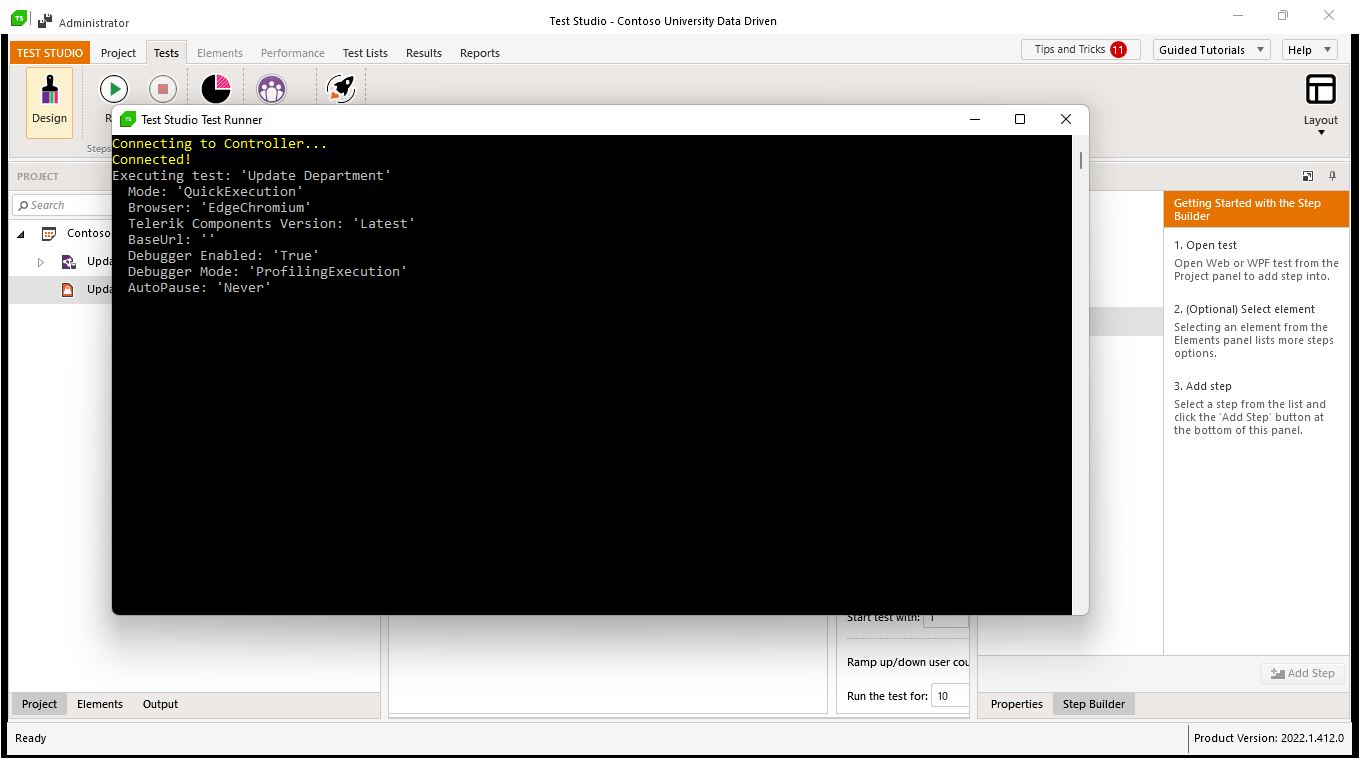
After selecting a test script and a browser from the icons displayed, Test Studio will open a command window and execute the test script, capturing the script’s actions to create your user profile.
If the test script you want isn’t part of your project, you can import it. You can also import an existing user profile from another test in the same project by using the Import user profile button at the top of the User Profile pane (that dialog will also let you create a user profile by importing a Fiddler trace).

Editing the User Profile
When you finish recording your user profile, Test Studio will display the Edit User Profile dialog and, over top of it, the Dynamic Target dialog for your user profile. With the Dynamic Targets dialog, your default action should be to select all the items and close the window (there is more you can do in this dialog).
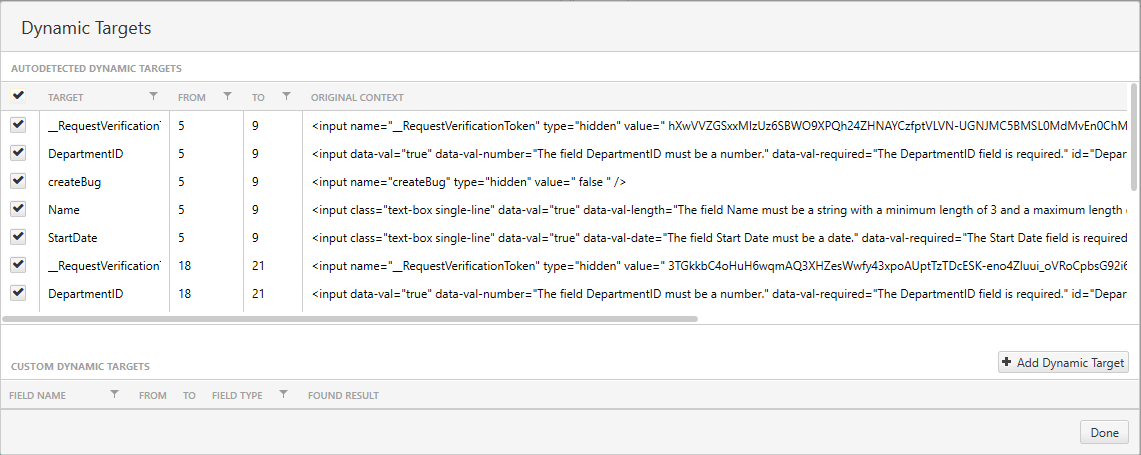
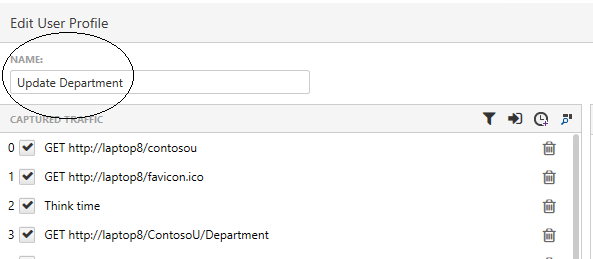
When you close the Dynamic Targets dialog, you’ll be shown the Edit User Profile dialog. This is where you can give your profile a meaningful name (if you created the profile from an existing web test, the profile’s name will default to the name of the web test).
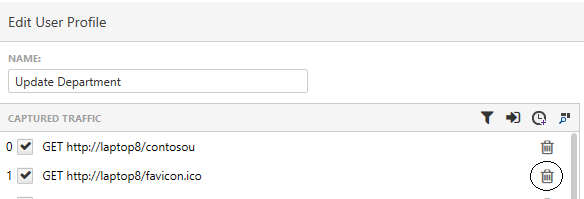
While recording, you may have accidentally clicked on a link or button that you don’t want to include in this your load test. In the Edit User Profile dialog, you can use the trash can icon to delete any steps you don’t want to be part of the user profile.
There’s more you can do in these dialogs, including running the profile against a different server.
Distributing Workloads
Once you’ve created your user profile, you’re ready to decide how many simultaneous users you want to have interacting with your server.
At this point, the distinction between a load test and a stress test starts to matter. If you’re doing a load test, then you want to set the number of users to what you reasonably expect to be either a typical or a peak load. If you want to test typical and peak loads, then you’ll need to create two tests, specifying a different number of virtual users in each test (here, the ability to import a user profile makes it easy for you to create the second test—just import the first test and modify the number of users). If you’re doing a stress test, then you’ll want to add a large number of users.
Setting the number of users is easy: In the User Profile pane, drag the slider in the Workload column to the right to specify what percentage of your available virtual users you want to use.
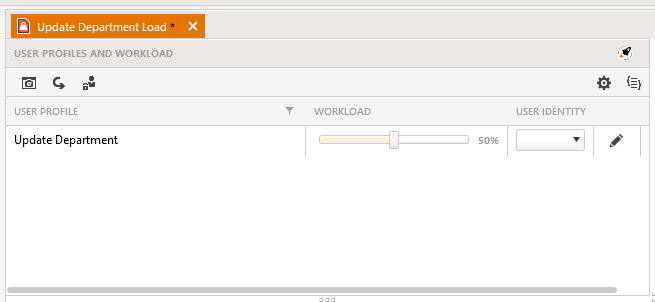
With the Test Studio Ultimate package, you have a maximum of 100 virtual users per seat available to you (you can purchase more if that’s not enough to reflect your typical or peak loads—five TS Ultimate licenses would give you the ability to generate a load of 500 simultaneous users). But you should be careful of how you distribute all your virtual users over your test computers—a good ratio is eight virtual users per CPU core on your test computer (in fact, only some of your 100 default virtual users are assigned to be used by your Test Studio computer)
Exceeding that “eight virtual users per core” guideline will probably give you an invalid result on your load tests. If you exceed that guideline and your load test fails, it’s probably because you overwhelmed the computer running the tests and not your application’s web servers. If you want to involve more virtual users than the guideline allows (for example, to create a stress test that causes your application to fail), then you’ll need to enlist multiple test computers (all of which you can manage from your Test Studio computer).
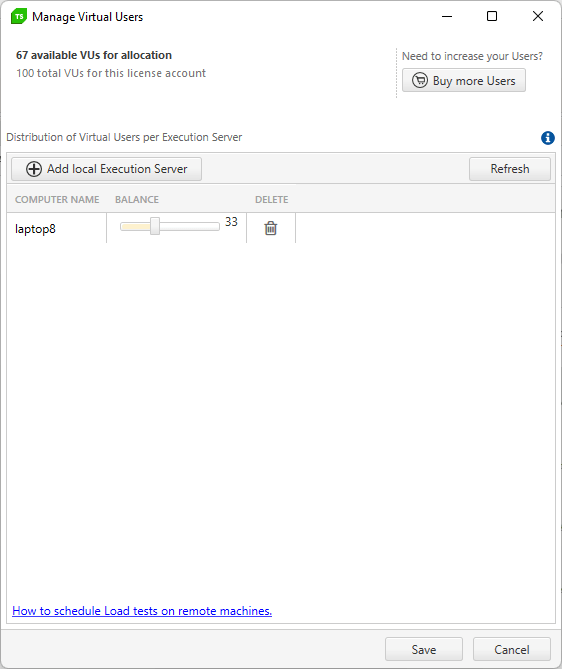
You can see how many virtual users are assigned to your compute by clicking the Manage button on the Test Studio menu’s Tests tab to display the Manage Virtual Users dialog.

That will let you specify how many users are available to the test computer. If, for example, your computer has four cores and the default 100 virtual users, the dialog will default to 33% or 32 users (four cores times eight users). Move the slider to the left or right to specify the available users for your test.
Setting Users and Timing
Your next step is to specify, in the Available Users pane in Test Studio’s lower right corner, your test parameters (again, you may need to unpin Test Studio’s Properties and Step Builder panes to expose this pane). In this pane, you’ll set:
- How long you want your test to run in minutes (helpful tip: for a soak test that you want to run over multiple days, remember that there are 1,440 minutes in a day)
- The number of virtual users present at the start of the test
- The number of virtual users still present at the end of the test
- How gradually your virtual users will be added to the test
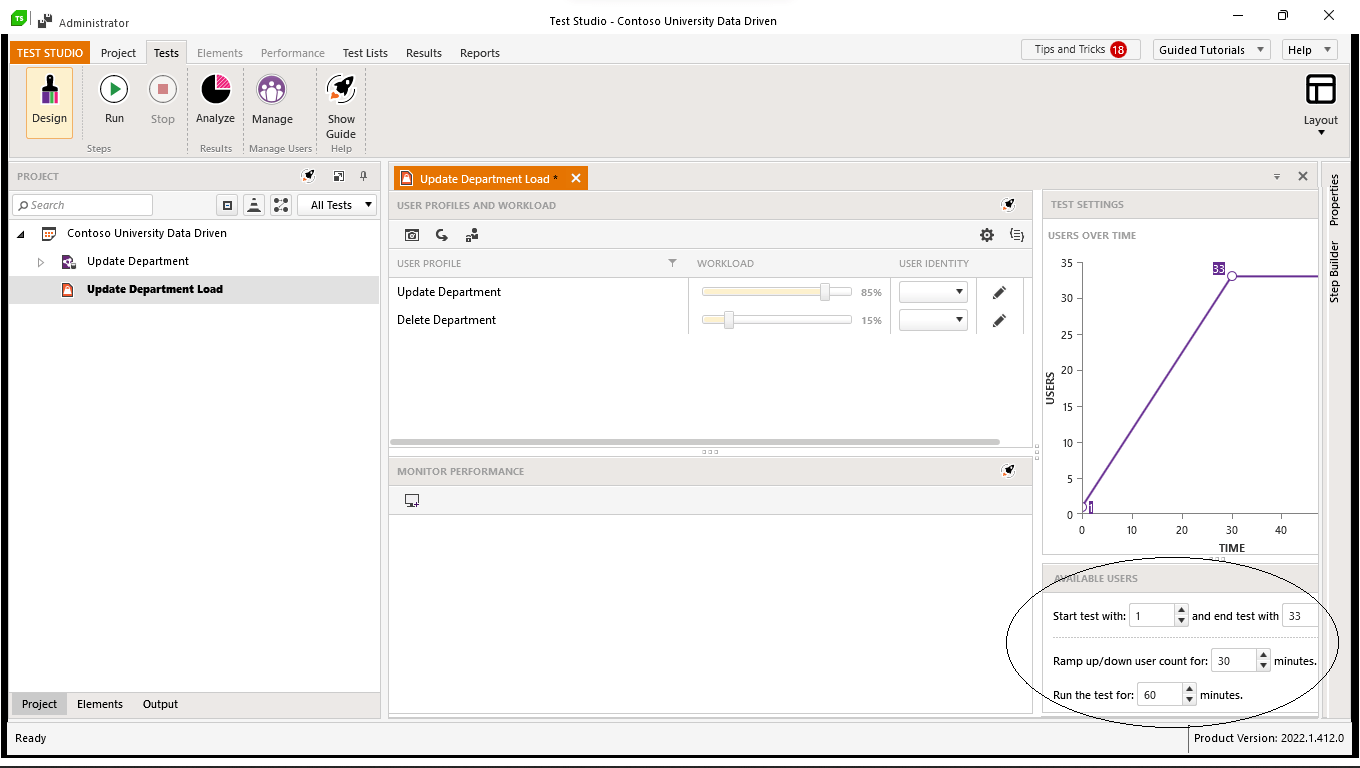
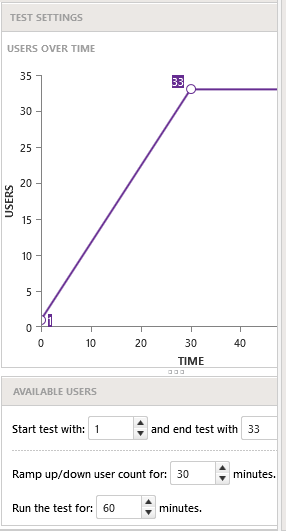
If, for example, you wanted to mimic a typical morning start up, you might specify a 60-minute test that begins with a single user but has all of your users present at the end of the test (up to the limit of the available users you specified). You might also specify that those additional users are to added over a 30-minute period. The Users Over Time pane right above the Available Users gives you some visual feedback on how users will be added.
You’re now just about ready to run your test: Click the Run button on Test Studio’s Tests tab.

Setting Test Options
When you click the Run button, Test Studio will pop up a textbox with some good advice. Once you click the Okay button on that dialog, Test Studio will display the Test Options dialog. In this dialog, you can specify how often test statistics are gathered (the default is every five seconds—probably a good first choice, but you might want to increase it if you find you’re getting more data than you need).
The primary purpose of this dialog, however, is to set conditions for an early end for your test.
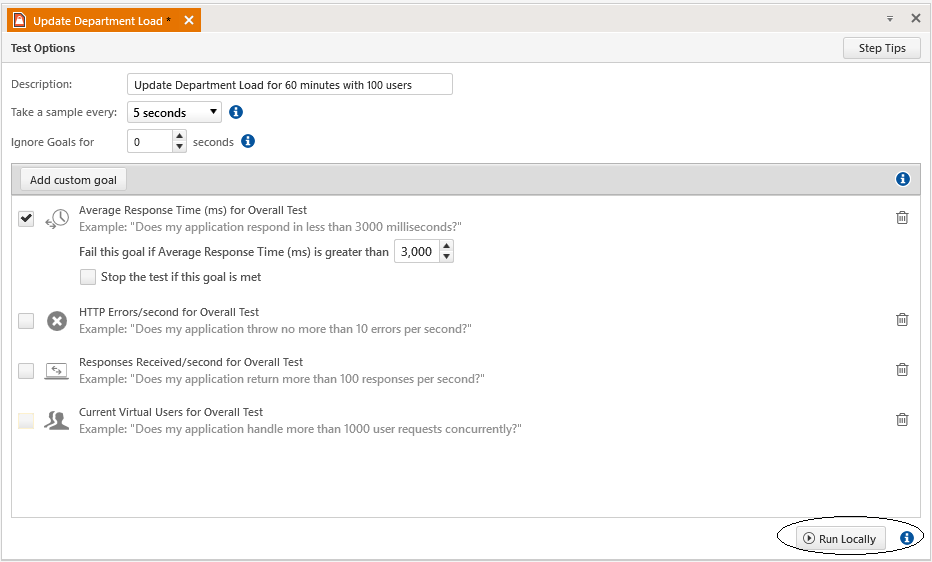
If you’re performing a stress test to see where your application will fail, the second and third options in this pane are useful:
- When average response time exceeds some value
- When the number of HTTP errors exceed some value
You can set these options so that, once either of these conditions are met, you’ve found your application’s fail point and there’s no need to continue the test.
For load tests, you’ll use the first and third options. The first option will terminate the test when the application has demonstrated that its average response time is less than a specified limit. The third option lets you stop your test when your application has demonstrated that it can process a specified number of responses or requests per second.
This dialog also allows you to specify that you don’t want any of your goals checked until your test has run for a specified period of time. In a load test, for example, you probably don’t want to bother checking the number of responses until “enough” virtual users have been added.
When you’ve made your choices, click the Run Locally button to start your test. Don’t panic when you get an initial screen that says that no results are available—remember that results are only gathered every five seconds, so you’ll need to wait for your initial results. Eventually, Test Studio will let you know how your test is doing.
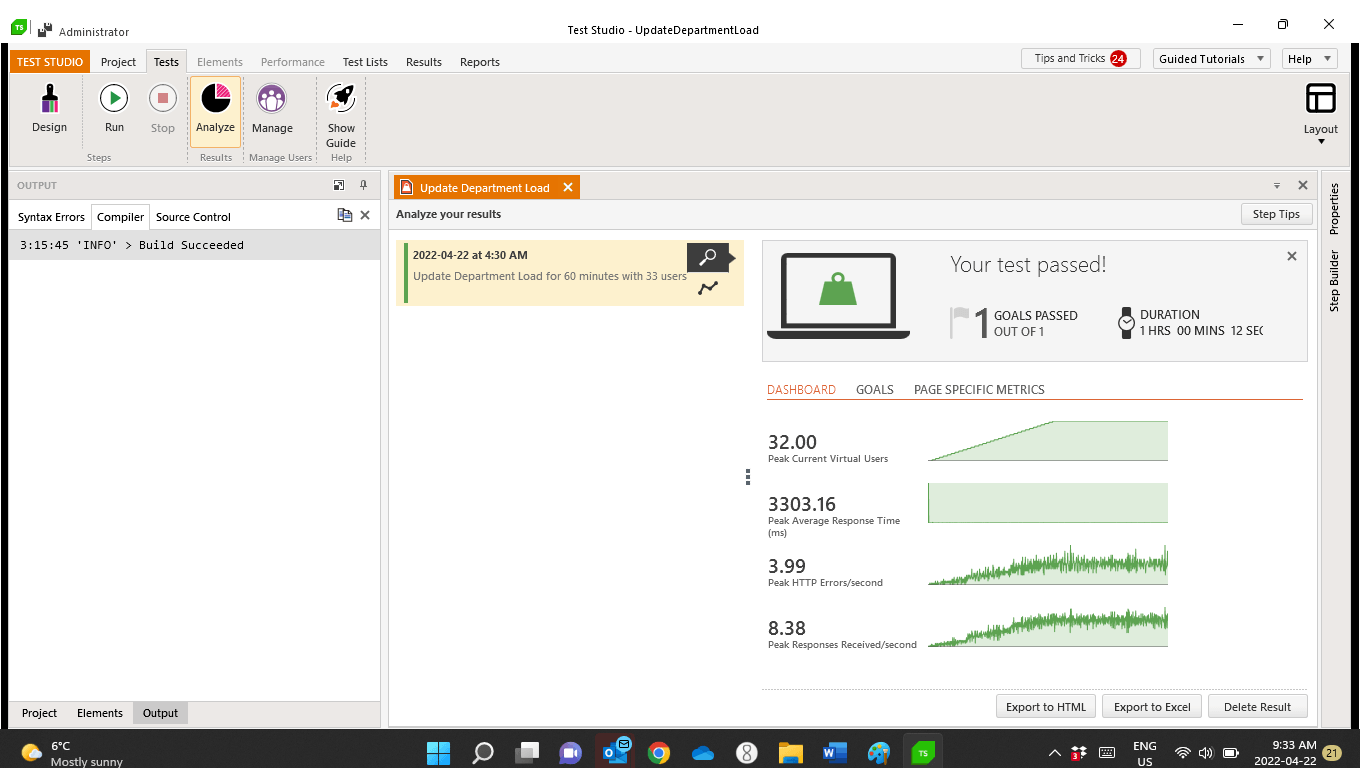
When your test is done, you can use Test Studio’s Analyze pane to dig deeper into the test’s results or to compare the results from different test runs. Test Studio will also let you export the results in a variety of formats (e.g., Excel, Word, HTML).
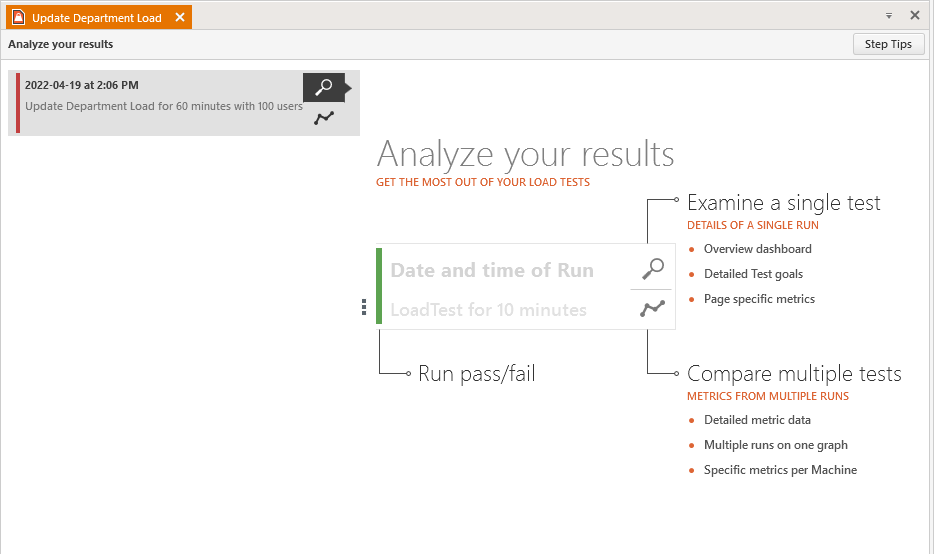
When you return to your test, the Test Options pane is displayed by default. You can return to the Analyze pane for your test by clicking on the Analyze button in the Test Studio menu’s Project’s tab.
If you want to modify your test (i.e., change the workload, timing or how users are added) then, in the Test Studio menu’s Tests tab, click on the Design button.

After Your First Load Test
Eventually, you’ll probably recognize that executing a single user profile isn’t a realistic test—it’s an unusual application that has all its users doing only one thing. You can create more realistic load tests by adding multiple user profiles to your test and then allocating a percentage of your virtual users to each profile. In the User Profile pane, the slide in the Workload column will let you distribute your virtual users among your profiles.
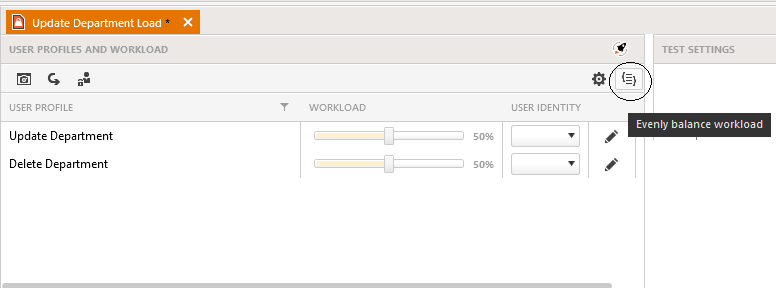
The easiest/fastest way to distribute your virtual users is to click the Evenly balance workload button in the upper right corner of the User Profile pane. If, for example, you have two profiles, clicking that button will allocate 50% of the users to each profile. However, an even distribution probably isn’t realistic, either, and you’ll want to play with the profiles’ sliders to get a balance you’re happy with. The only restriction is that the percentages for all the profiles can’t, of course, add up to more than 100%.
If you’ve been taking advantage of your existing functional test scripts to create your user profiles, you will also come to realize that a good functional test script won’t necessarily give you the ideal user profile for a load test. You shouldn’t let that stop you from leveraging your test scripts to create your first load tests, but you can use Test Studio’s script editor to evolve your functional test scripts into more effective non-functional load tests.
You also probably don’t want to tie up your Test Studio computer while your load test is running (especially for a soak test, which might run for many hours). You can schedule your load test to run outside of work hours by scheduling your tests.
Finally, you can run your load test run on another, remote computer controlled by your Test Studio computer. If you run a test on a remote computer, the maximum number of virtual users is controlled by the computer that’s managing the remote computer (i.e., your Test Studio computer). You still don’t want to exceed the “eight users per core” guideline on any test computer, but running your test on multiple remote computers will let you add more virtual users without overwhelming any of your test computers and let you manage that test from your Test Studio computer. An effective stress test will probably require you to use multiple remote computers (or one computer with a lot of cores).
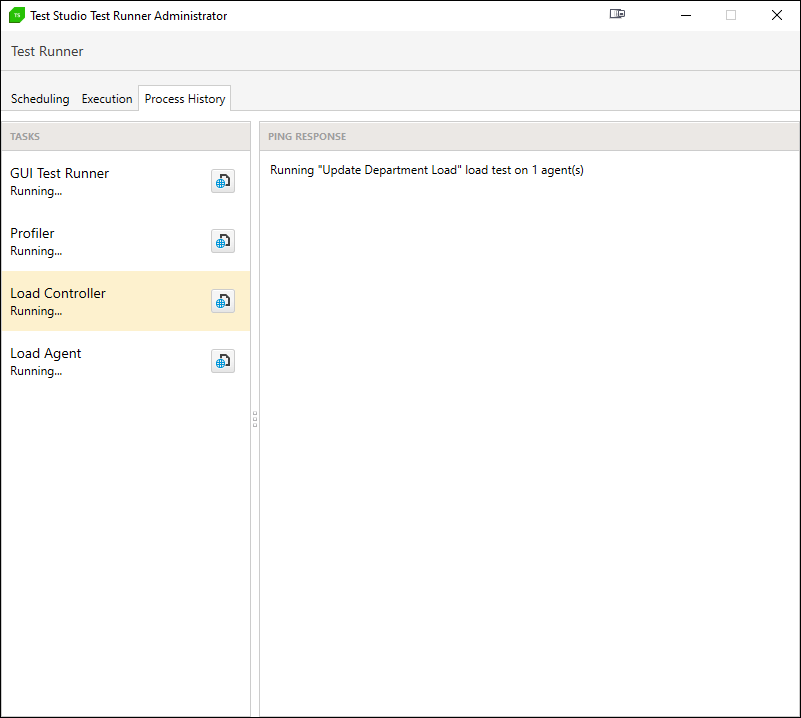
You can check that your test is running successfully on a remote computer by opening the Test Studio Runtime Administrator on the remote computer and, on the Process History tab, checking its Load Controller entry.
Start Early
Most teams leave load testing until late in the process (typically, after functional testing has shown that the application is free of known bugs). That’s not necessarily the best strategy. Load testing often reveals problems in the design or implementation of the application that can’t be fixed by throwing additional resources (e.g., more web servers) at the problem. In that scenario, code (even if it works correctly) is going to have to be rewritten. There’s not a lot of value in testing code you’re going to replace when load problems are discovered.
Test Studio lets you leverage your functional tests to get an early start on your load testing. Your initial functional tests may not be ideal load tests, but they can still tell you a lot about how your application deals with demand. It would be smart to take advantage of the ability to turn tests scripts into user profiles so that you know, as early as possible, that your application not only works, but that it works well.

Peter Vogel
Peter Vogel is a system architect and principal in PH&V Information Services. PH&V provides full-stack consulting from UX design through object modeling to database design. Peter also writes courses and teaches for Learning Tree International.

