

Open-source library TensorFlow.js was introduced about a couple of years ago. However, I didn’t manage to try it out up until now. In this article, we are going to get to know how to use this technology, and we are going to do it on one real-world classification problem. The idea is to use possibilities of TensorFlow.js to build and run our machine learning and deep learning modes in a browser or under Node.js. To be honest, I was a bit skeptical at first. However, this turned out as a cool way to keep web developers and data scientists closer together.

This bundle of e-books is specially crafted for beginners.
Everything from Python basics to the deployment of Machine Learning algorithms to production in one place.
Become a Machine Learning Superhero TODAY!
In this article we cover:
- Why should you consider Tensorflow.js?
- Installation
- Wine Quality Classification Problem
- Data Analysis
- Implementation with Tensorflow.js
1. Why should you consider Tensorflow.js?
In essence, there are several perks that we can consider when using TensorFlow.js. For me, the main gain is that you can build models directly in a browser. Apart from that, you can import existing pre-trained models from Python and re-train them as well. Imagine that you are working under JavaScript stack with NoSQL JSON based database (eg. MongoDB). This is certainly use case in which we should consider using TensorFlow.js.
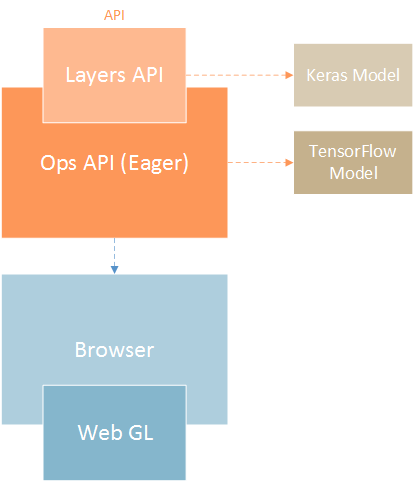
TensorFlow.js incudes Keras API and exposes it as it’s high-level API. This is very nice and it eases up the process of building machine learning and deep learning models. It also includes a lower level API, previously called deeplearn.js, which can be used for linear algebra and automatic differentiation. Eager execution is supported as well. Underneath
In this article, we are going to build a simple neural network using TensorFlow.js which will solve a simple classification problem. However, before that let’s see how we can install TensorFlow.js.
2. Installation
There are several ways in which we can use TensorFlow.js. First one, of course, is using it just by adding script tag inside of our main HTML file:
<script src="https://cdn.jsdelivr.net/npm/@tensorflow/tfjs@1.0.0/dist/tf.min.js"></script>
You can also install it using npm or yarn for setting it up under Node.js:
npm install @tensorflow/tfjs
yarn add @tensorflow/tfjs

TensorFlow has GPU support for higher performances. You can instal it like this:
npm install @tensorflow/tfjs-node-gpu
npm install @tensorflow/tfjs-node-gpu
Use this option only if your system has
npm install @tensorflow/tfjs-node
yarn add @tensorflow/tfjs-node
3. Wine Quality Classification Problem
If you read some of our previous articles, you may notice that we like using this dataset. That is because this dataset is really good for simple classification analysis, but it comes from real-world. Our goal is to predict the quality of the wine based on the provided chemical data. Data itself is about Vinho Verde, a unique product from the Minho region of Portugal. This product is taking up to 15% of the total Portuguese wine production and Portugal is the tenth biggest wine producer in the world.

Information was collected from May/2004 to February/2007 and due to privacy and logistic issues, only physicochemical and sensory variables are available. Price and origin of data are not provided in the dataset. The dataset contains two .csv files, one for red wine (1599 samples) and one for white wine (4898 samples). For the purpose of this article, we will use only the white wine samples.
Every sample contains these features:
- Fixed acidity
- Volatile acidity
- Citric acid
- Residual sugar
- Chlorides
- Free sulfur dioxide
- Total sulfur dioxide
- Density
- pH
- Sulfates
- Alcohol
- Quality (score between 0 and 10)
The dataset presented in tabular form looks something like this:

4. Data Analysis
I know that in
Data Analysis is consisting of several sub-steps itself:
- Univariate Analysis – Analysing types and nature of every feature.
- Missing Data Treatment – Detecting missing data and making a strategy about it.
- Outlier Detection – Detecting anomalies in the data. Outliers are samples that diverge from an overall pattern in some data.
- Correlation Analysis – Comparing features among each other.
During the univariate analysis, we noticed that output data quality is actually integer not category. This will be handled during implementation. Apart from that, we could
 During Missing Data Treatment phase we notice that some samples have Fixed acidity feature empty. Our strategy is to replace this information with the mean value of that feature. Other options are available too, like changing missing values with max feature value, or some default value. Let’s check the quality distribution and detect outliers:
From the picture above, we can see that most of the wines fall in the category between 5 and 6. This means the most of the wines are average and we have just a few wines with high or low quality. Finally, let’s check

As you can see we can not detect feature that effects quality too much. The only thing that can raise our suspicion is the high correlation between residual sugar feature and density feature. However, we will leave both features in the game and see where we will land.
5. Implementation with Tensorflow.js
5.1 Data as JSON
Dataset itself comes in .csv file format. So the first thing we had to do was to convert this into JSON file and upload it. You can find whole new created JSON file here. In general, every sample from
 [
    {
       "fixed_acidity":7,
       "volatile_acidity":0.27,
       "citric_acid":0.36,
       "residual_sugar":20.7,
       "chlorides":0.045,
       "free_sulfur_dioxide":45,
       "total_sulfur_dioxide":170,
       "density":1.001,
       "pH":3,
       "sulphates":0.45,
       "alcohol":8.8,
       "quality":6
    },
    {
       "fixed_acidity":6.3,
       "volatile_acidity":0.3,
       "citric_acid":0.34,
       "residual_sugar":1.6,
       "chlorides":0.049,
       "free_sulfur_dioxide":14,
       "total_sulfur_dioxide":132,
       "density":0.994,
       "pH":3.3,
       "sulphates":0.49,
       "alcohol":9.5,
       "quality":6
    },
  ...
We have done this because as you know, working with JSON files in JavaScript is
5.2 HTML File
Now, let’s check out our index.html file.
<!DOCTYPE html>
<html>
<head>
  <title>TensorFlow.js Wine Quality Classification</title>
  <script src="https://cdn.jsdelivr.net/npm/@tensorflow/tfjs@1.0.0/dist/tf.min.js"></script>
  <script src="https://cdn.jsdelivr.net/npm/@tensorflow/tfjs-vis@1.0.2/dist/tfjs-vis.umd.min.js"></script>
</head>

<body>
  <script src="script.js"></script>
</body>
</html>
As you can see we added mentioned script tag for TensorFlow.js and additional for
5.3 JavaScript File
Apart from that, you could notice that we defined script.js. This file is located in the same folder as index.html. To run this whole process, all you have to do is open index.html in your browser. Here is how the main run function from script.js file looks:
async function run() {

  const data = await getData();
  displayData(data);

	const model = createModel();
	tfvis.show.modelSummary({name: 'Model Summary'}, model);

	const tensorData = prepareData(data);
	const {inputs, outputs} = tensorData;

	await trainModel(model, inputs, outputs, 100);
	console.log('Done Training');

  await evaluateModel(model, inputs, outputs);
}
This function essentially reveals our workflow. First, we get data from this location, using
/**
  * @desc retrieves data from defined location
  * @return wine data as json
*/
async function getDataFunction() {
  const wineDataReq = await fetch('https://raw.githubusercontent.com/NMZivkovic/file_hosting/master/wine_quality.json');
  const wineData = await wineDataReq.json();
  return wineData;
}
This is achieved simply by using fetch method. After that, we use displayData to plot some interesting graphs:
/**
  * @desc plots one
  * @param array values - array of values
  * @param string name - name of the plot
  * @param string xoutput - x name
  * @param string youtput - y name
*/
function singlePlot(values, name, xoutput, youtput)
{
  tfvis.render.scatterplot(
    {name: name},
    {values},
    {
      xoutput: xoutput,
      youtput: youtput,
      height: 300
    }
  );
}

/**
  * @desc plots one
  * @param json data - complete json that contains wine quality data
*/
function displayDataFunction(data){
  let displayData = data.map(d => ({
    x: d.alcohol,
    y: d.quality,
  }));

  singlePlot(displayData, 'Alchocol v Quality', 'Alchocol', 'Quality')

  displayData = data.map(d => ({
    x: d.chlorides,
    y: d.quality,
  }));

  singlePlot(displayData, 'Chlorides v Quality', 'Chlorides', 'Quality')

  displayData = data.map(d => ({
    x: d.citric_acid,
    y: d.quality,
  }));

  singlePlot(displayData, 'Citric Acid v Quality', 'Citric Acid', 'Quality')
}
Note that in the gist above singlePlot function is presented as well. This method wraps tfjs-vis functionality and displays only one graph. The displayData function utilizes this method to plot three graphs. Here they are:
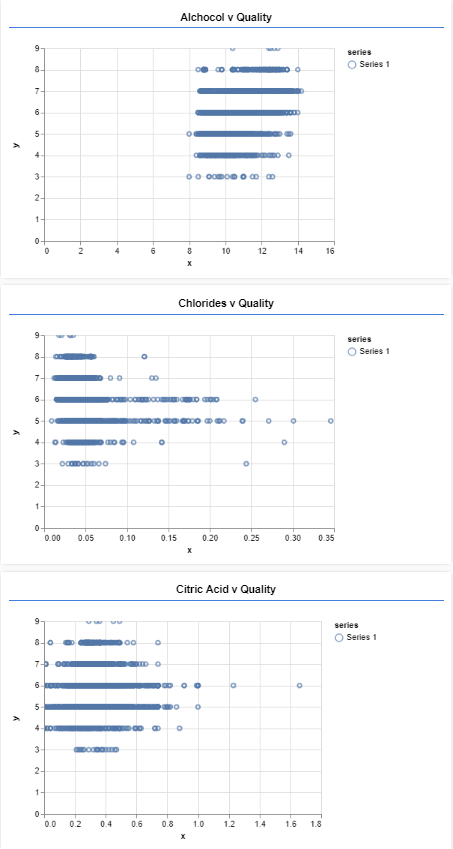
Here we can see distribution of quality by different feature. Once we visualized data, we can create our model. This is done in the function createModel:
/**
  * @desc creates tensorflow graph
  * @return model
*/
function createModelFunction() {
  const model = tf.sequential();
  model.add(tf.layers.dense({inputShape: [11], units: 50, useBias: true, activation: 'relu'}));
  model.add(tf.layers.dense({units: 30, useBias: true, activation: 'tanh'}));
  model.add(tf.layers.dense({units: 20, useBias: true, activation: 'relu'}));
  model.add(tf.layers.dense({units: 10, useBias: true, activation: 'softmax'}));

  return model;
}
The main goal here was not to generate a perfect model for this problem, but to try out some of the TensorFlow.js possibilities. If you are familiar with building neural network models with Keras, this API will be easy to understand. However, if you want to learn more about neural networks, you can check our set of e-books here.
Let’s have a quick overview. We use

Awesome! Now, we prepare data for model itself. Our model will not work with JSON objects, or with arrays for that matter. We need to create tensor objects. This is done in prepareData function:
/**
  * @desc creates array of input data for every sample
  * @param json data - complete json that contains wine quality data
  * @return array of input data
*/
function extractInputs(data)
{
  let inputs = []
  inputs = data.map(d => [d.fixed_acidity, d.volatile_acidity, d.citric_acid, d.residual_sugar, d.chlorides, d.free_sulfur_dioxide, d.total_sulfur_dioxide, d.density, d.pH, d.sulphates, d.alcohol])
	return inputs;
}

/**
  * @desc converts data from json format to tensors
  * @param json data - complete json that contains wine quality data
  * @return tuple of converted data that can be used for training model
*/
function prepareDataFunction(data) {

  return tf.tidy(() => {
    tf.util.shuffle(data);

    const inputs = extractInputs(data);
    const outputs = data.map(d => d.quality);

    const inputTensor = tf.tensor2d(inputs, [inputs.length, inputs[0].length]);
    const outputTensor = tf.oneHot(tf.tensor1d(outputs, 'int32'), 10);

    const inputMax = inputTensor.max();
    const inputMin = inputTensor.min();
    const outputMax = outputTensor.max();
    const outputMin = outputTensor.min();

    const normalizedInputs = inputTensor.sub(inputMin).div(inputMax.sub(inputMin));
    const normalizedoutputs = outputTensor.sub(outputMin).div(outputMax.sub(outputMin));

    return {
      inputs: normalizedInputs,
      outputs: normalizedoutputs,
      inputMax,
      inputMin,
      outputMax,
      outputMin,
    }
  });
}
In this function, we first convert JSON objects into simple arrays. We split data into inputs and outputs. In this particular example, we haven’t split data into train and test sets, which is something that can be improved.
Once this is done, we convert them into tensors. Finally, we normalize data, meaning we put it on the same scale. This is something that we noticed during the data analysis phase. Also, note that we use
So, we have done all preparation steps and we can train our model using trainModel function:
/**
* @desc trains model
* @return trained model
*/
async function trainModelFunction(model, inputs, outputs, epochs) {
model.compile({
optimizer: tf.train.adam(),
loss: 'categoricalCrossentropy',
metrics: ['accuracy'],
});
const batchSize = 64;
return await model.fit(inputs, outputs, {
batchSize,
epochs,
shuffle: true,
callbacks: tfvis.show.fitCallbacks(
{ name: 'Training Performance' },
['loss', 'accuracy'],
{ height: 200, callbacks: ['onEpochEnd'] }
)
});
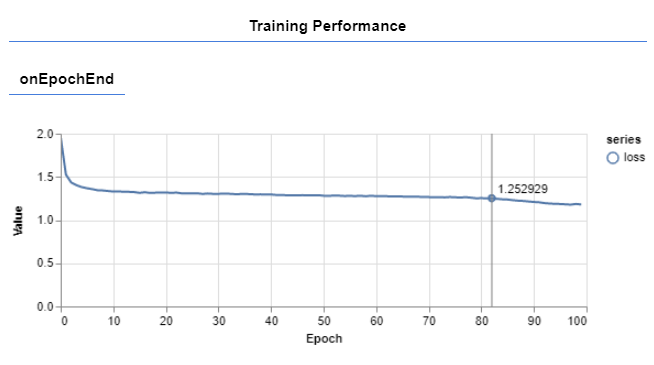
}Once again, you can notice that TensorFlow.js kept the API that is similar to the TensorFlow API in Python. We compile our model with Adam optimizer and cathegorical crossentropy. Then we run the training process with
Finally, we use evaluateModel method to evaluate accuracy of our neural network. This method is just a wrapper for evaluate method of created model:
/**
  * @desc evaluates the model
*/
async function evaluateModelFunction(model, inputs, outputs)
{
  const result = await model.evaluate(inputs, outputs, {batchSize: 64});
  console.log('Accuracy is:')
  result[1].print();
}
The output of evaluation is printed in the console:
Accuracy is: 0.7163332223892212
We got accuracy of just 71%, meaning there is a lot of place for improvement of our model. However, we were able to do all this in the browser, which is awesome.
Conclusion
In this article we learned how to use JavaScript for machine learning and deep learning. We figured out how to make basic models using TensorFlow.js and train them. In future articles, we will investigate this library even further and try to use it to implement more sophisticated architectures.
Thank you for reading!
This bundle of e-books is specially crafted for beginners.
Everything from Python basics to the deployment of Machine Learning algorithms to production in one place.
Become a Machine Learning Superhero TODAY!

Nikola M. Zivkovic
CAIO at Rubik's Code
Nikola M. Zivkovic is the author of books: Ultimate Guide to Machine Learning and Deep Learning for Programmers. He loves knowledge sharing, and he is an experienced speaker. You can find him speaking at meetups, conferences, and as a guest lecturer at the University of Novi Sad.


Trackbacks/Pingbacks