
Author Rich Reports With the Telerik Web Report Designer Now in .NET 6

Previously, you have seen how to build the Crypto Dashboard report in the Sleek, Pixel-Perfect Embedded Reporting with Telerik Web Report Designer in .NET 5 blog post. Now we have prepared a new masterpiece for you—the Conference report.
Building pixel-perfect reports has never been so easy. You might ask, “But how is this possible?” And here we have the answer. The Telerik Reporting team always works on improving your experience while developing reports with our report designer tools because we understand the value and the importance that our product brings to you.
In this blog post, we will use the Telerik Web Report Designer to build a complex report which later you can use as an example for your future projects.
Integrating the Web Report Designer to a .NET6 Application
The Web Report Designer can be added to .NET Core projects in three easy steps by using the Visual Studio item template:
- Create a new ASP.NET Core Web application.
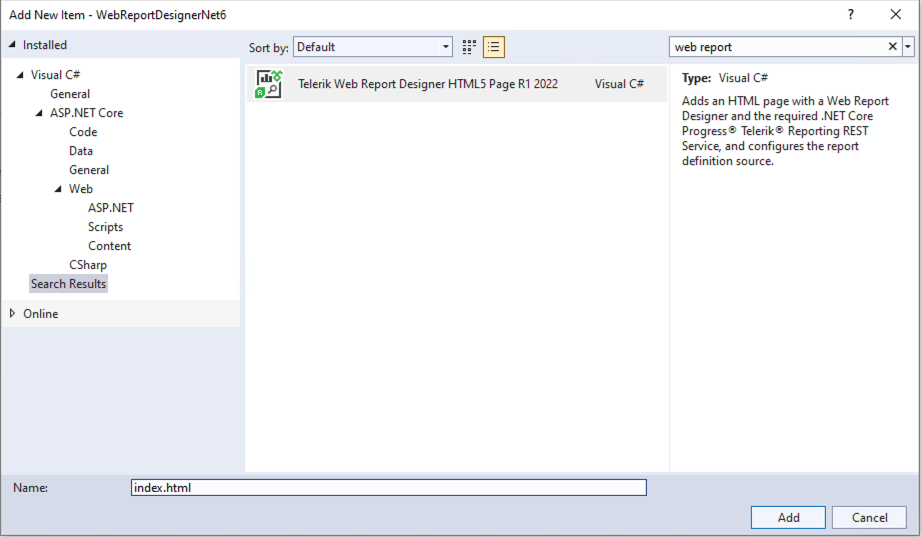
- Right-click over the project -> Add -> New item.
- Select the Telerik Web Report Designer HTML5 Page and set its name to index.html.
4. Follow the Wizard until it is completed.
Once you have added the designer, run the application. To create a new report, click on Menu -> New -> type the report’s name and hit the Save button.
Building the Report
The report that we are about to create will contain two pages—one that displays the conference program and the other that shows the speakers who will be presenting. On the program page, we will add the schedule for each day—date, time, information about the topic and the speaker. And on the second page, we will provide details about each lecturer—position, company, biography and so on.
Adding the Data Source
We will start by adding the data source that will contain the data about the conference agenda and its speakers. In this report, we will use JSON DataSource. You can find the JSON file in the GitHub repository.
To configure the datasource, go to the Components tab of the designer -> JSON DataSource. Then, you can either browse to the file (Upload JSON file option), select a file that has already been added to the assets (Use existing JSON file) or directly paste the JSON (Use JSON Inline) -> Next -> Finish.
Once you are done with adding the data, set the DataSource property of the report to be the JSON DataSource.
Grouping the Data
We want the report to contain two logical parts—one displaying the conference agenda and another providing information about the speakers. For that reason, we will add a group to the report. Go to the Properties panel of the report -> expand Data -> Groups -> click on + -> Groupings -> set the Expression to be “=Fields.Group” -> Save.
Configuring the Group Header Section
- Start by deleting the page header section. We want to use only the header of the group.
- In the group header section, we will add the logo of the conference by inserting a PictureBox.
- We also want to display information for each group. Add two TextBoxes with the following values: ”= Fields.Title ” and “= Fields.Subtitle”. In this report, we will use the Microsoft Sans Serif font.
- Set the BackgroundImage property of the section with the image from the resource folder (GitHub repository).
- Insert the rectangle image (also located in the resource folder) at the bottom of the section.
- Because the speakers group doesn’t have a subtitle, for this case, we want to decrease the height of the group header section and move up the rectangle. To decrease the height of the group header when the group is Speakers, add the following
Binding to the section by selecting the section -> Data ->
Bindings -> +:
Path: Height. Expression: = Fields.Group = "Program" ? "236px" : "176px" - To move the rectangle, again, we will add a new Binding for the Location:
Path: Location
Expression: = Fields.Group = "Program" ? "0px, 224px" : "0px, 161px"
Changing the location and size of report items with Bindings is not the best way to modify the layout at runtime. We usually recommend doing this using a container item with CanShrink set to true and control the visibility of its child items through Bindings. However, in this particular case we know how the report items bounds should be modified, and we also want to keep it as simple as possible, so the first approach is an acceptable option.
- Finally, set the PageBreak property of the header section to Before. We do this in order to display each group on a new page.
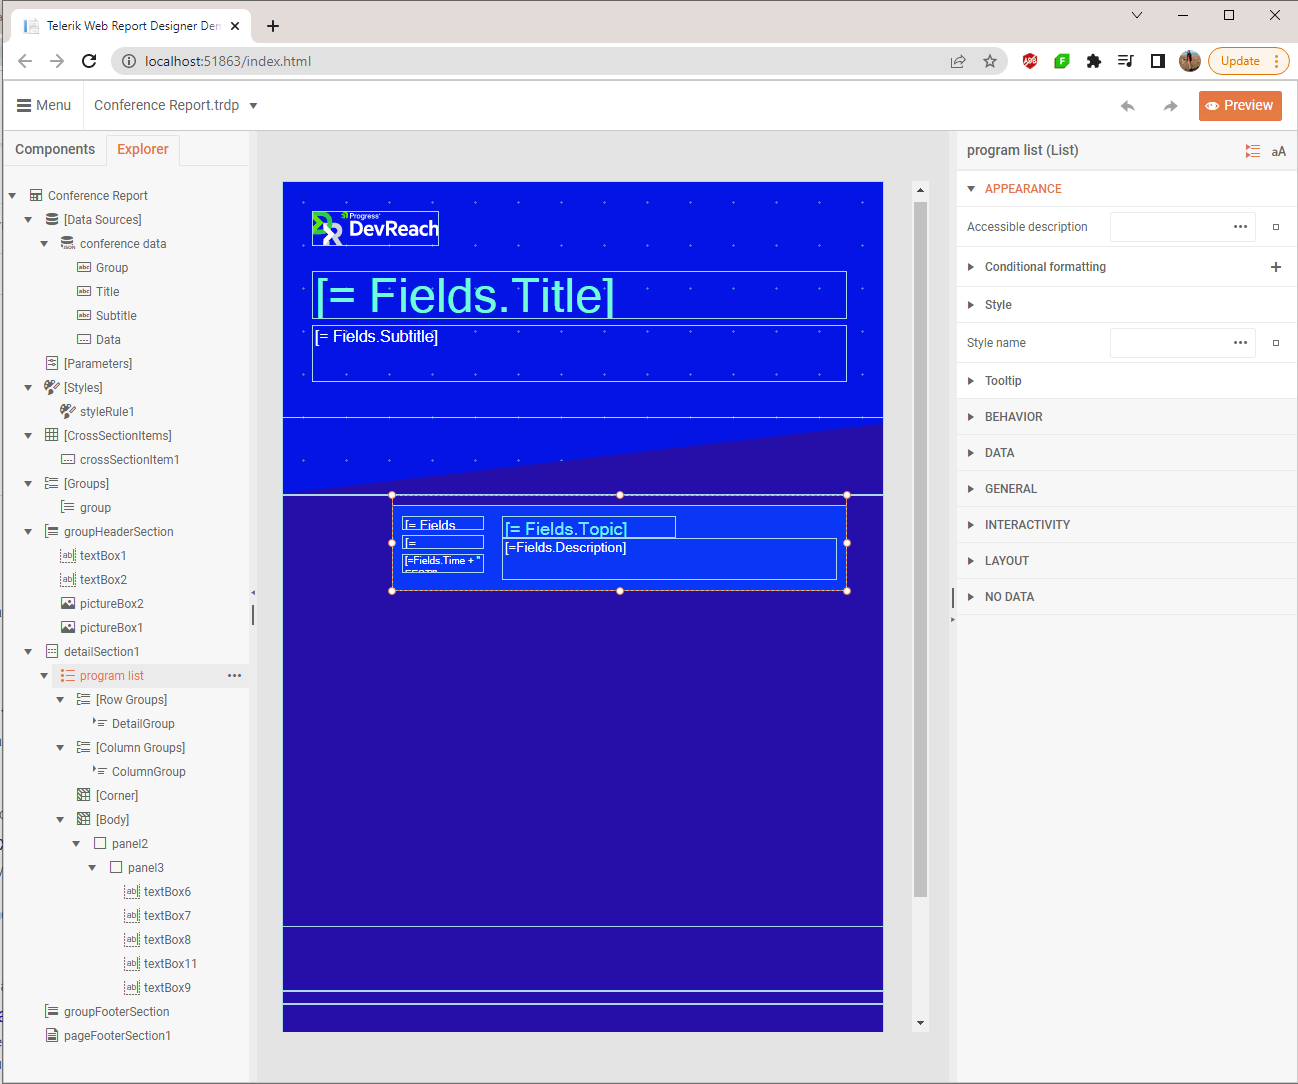
Displaying the Conference Agenda
- Insert a List from the Components tab to the detail section in order to show the details about each day of the conference. It will contain information about the date and time of the lecture, the topic that will be discussed, and a description of it.
- Set the BackgroundColor property of the panel to: #0a36f5.
- Because the fields are nested, we need to set the data source of the List by defining the following Binding:
Path: DataSource Expression: =Fields.Data - Add the TextBoxes that will display the data.
- Set the BackgroundColor property of the detail section to: #260ea9.
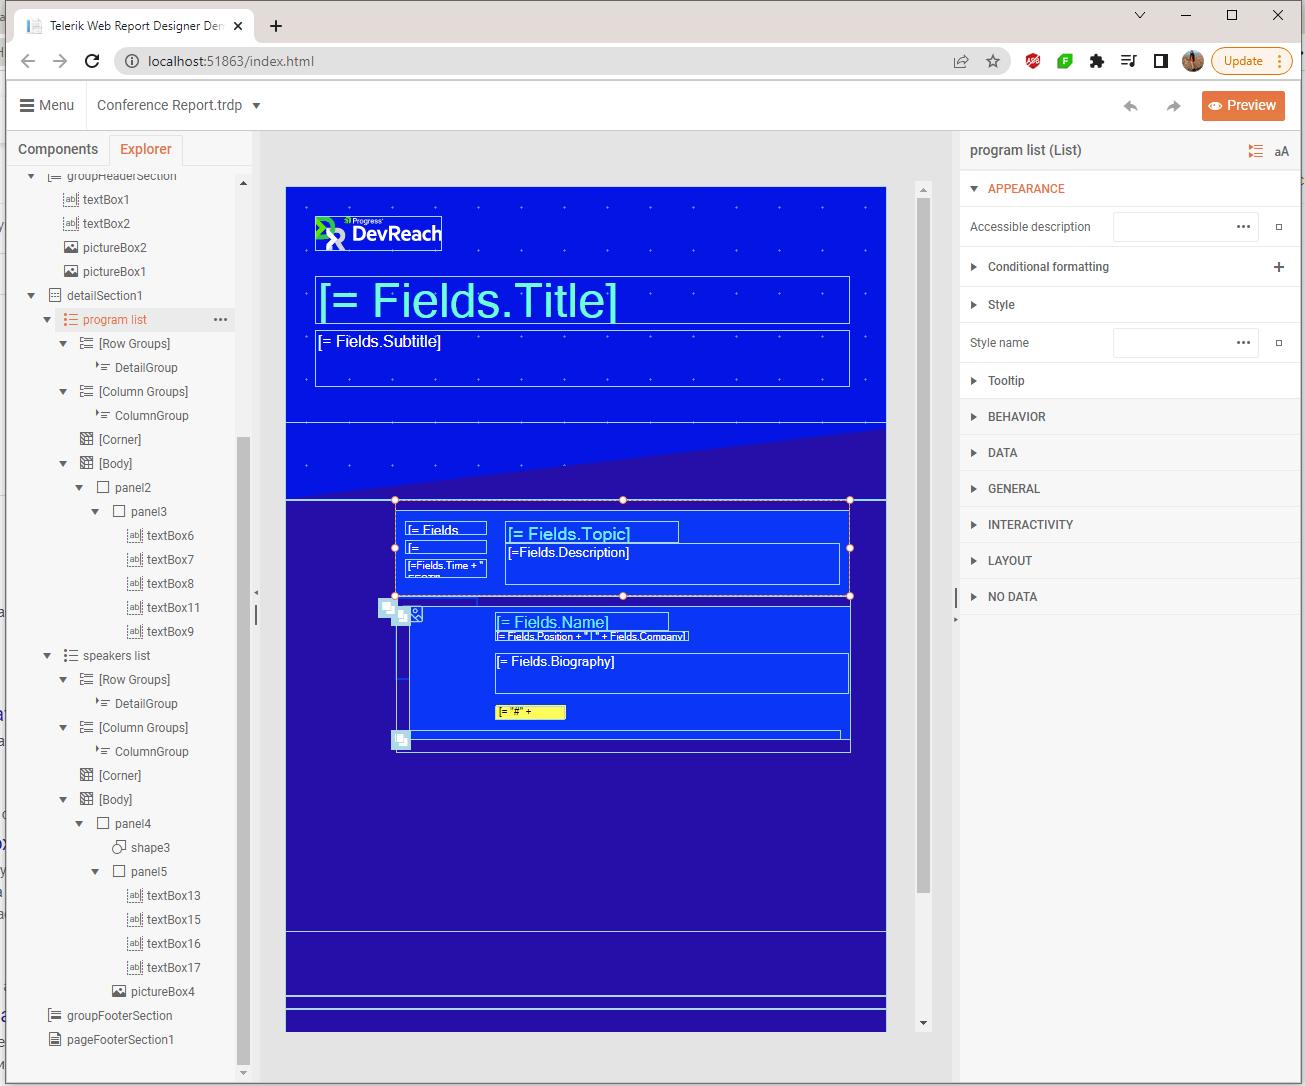
Displaying the Conference Speakers
In general, here we will repeat the same steps as in the previous section—add a list, set its DataSource through Binding, insert textboxes to display the data fields and a PictureBox to show a photo of the speaker.
Now we want to display a specific list depending on the current group. For example, if the current group is “program,” we want to show the list with the agenda and hide the list with the speakers.
We will cover this requirement by using ConditionalFormatting for the visibility of the list. From the properties of the list:
- Select the list with agenda and from the Properties menu, select ConditionalFormatting.
- Click on + to create a new rule and set it as follows:
Expression: = Fields.Group Operator: = Value: ="Speakers" - Click OK and go to the Style section -> uncheck Visible -> Save.
Repeat the same for the speakers list. In this case, the value of the rule will be ="Program".
Displaying the Current Group at the Bottom of the Page
We are almost on the final. Add a panel on the bottom of the detail section. In it, add two textboxes with the following values: =ToUpper("Devreach") and =ToUpper(Fields.Group). Set the Binding property of the panel so it is located in the proper position
based on the group:
Path: Location
Expression: = Fields.Group = "Program" ? "0.1in, 1in" : "0.1in, 2.4in"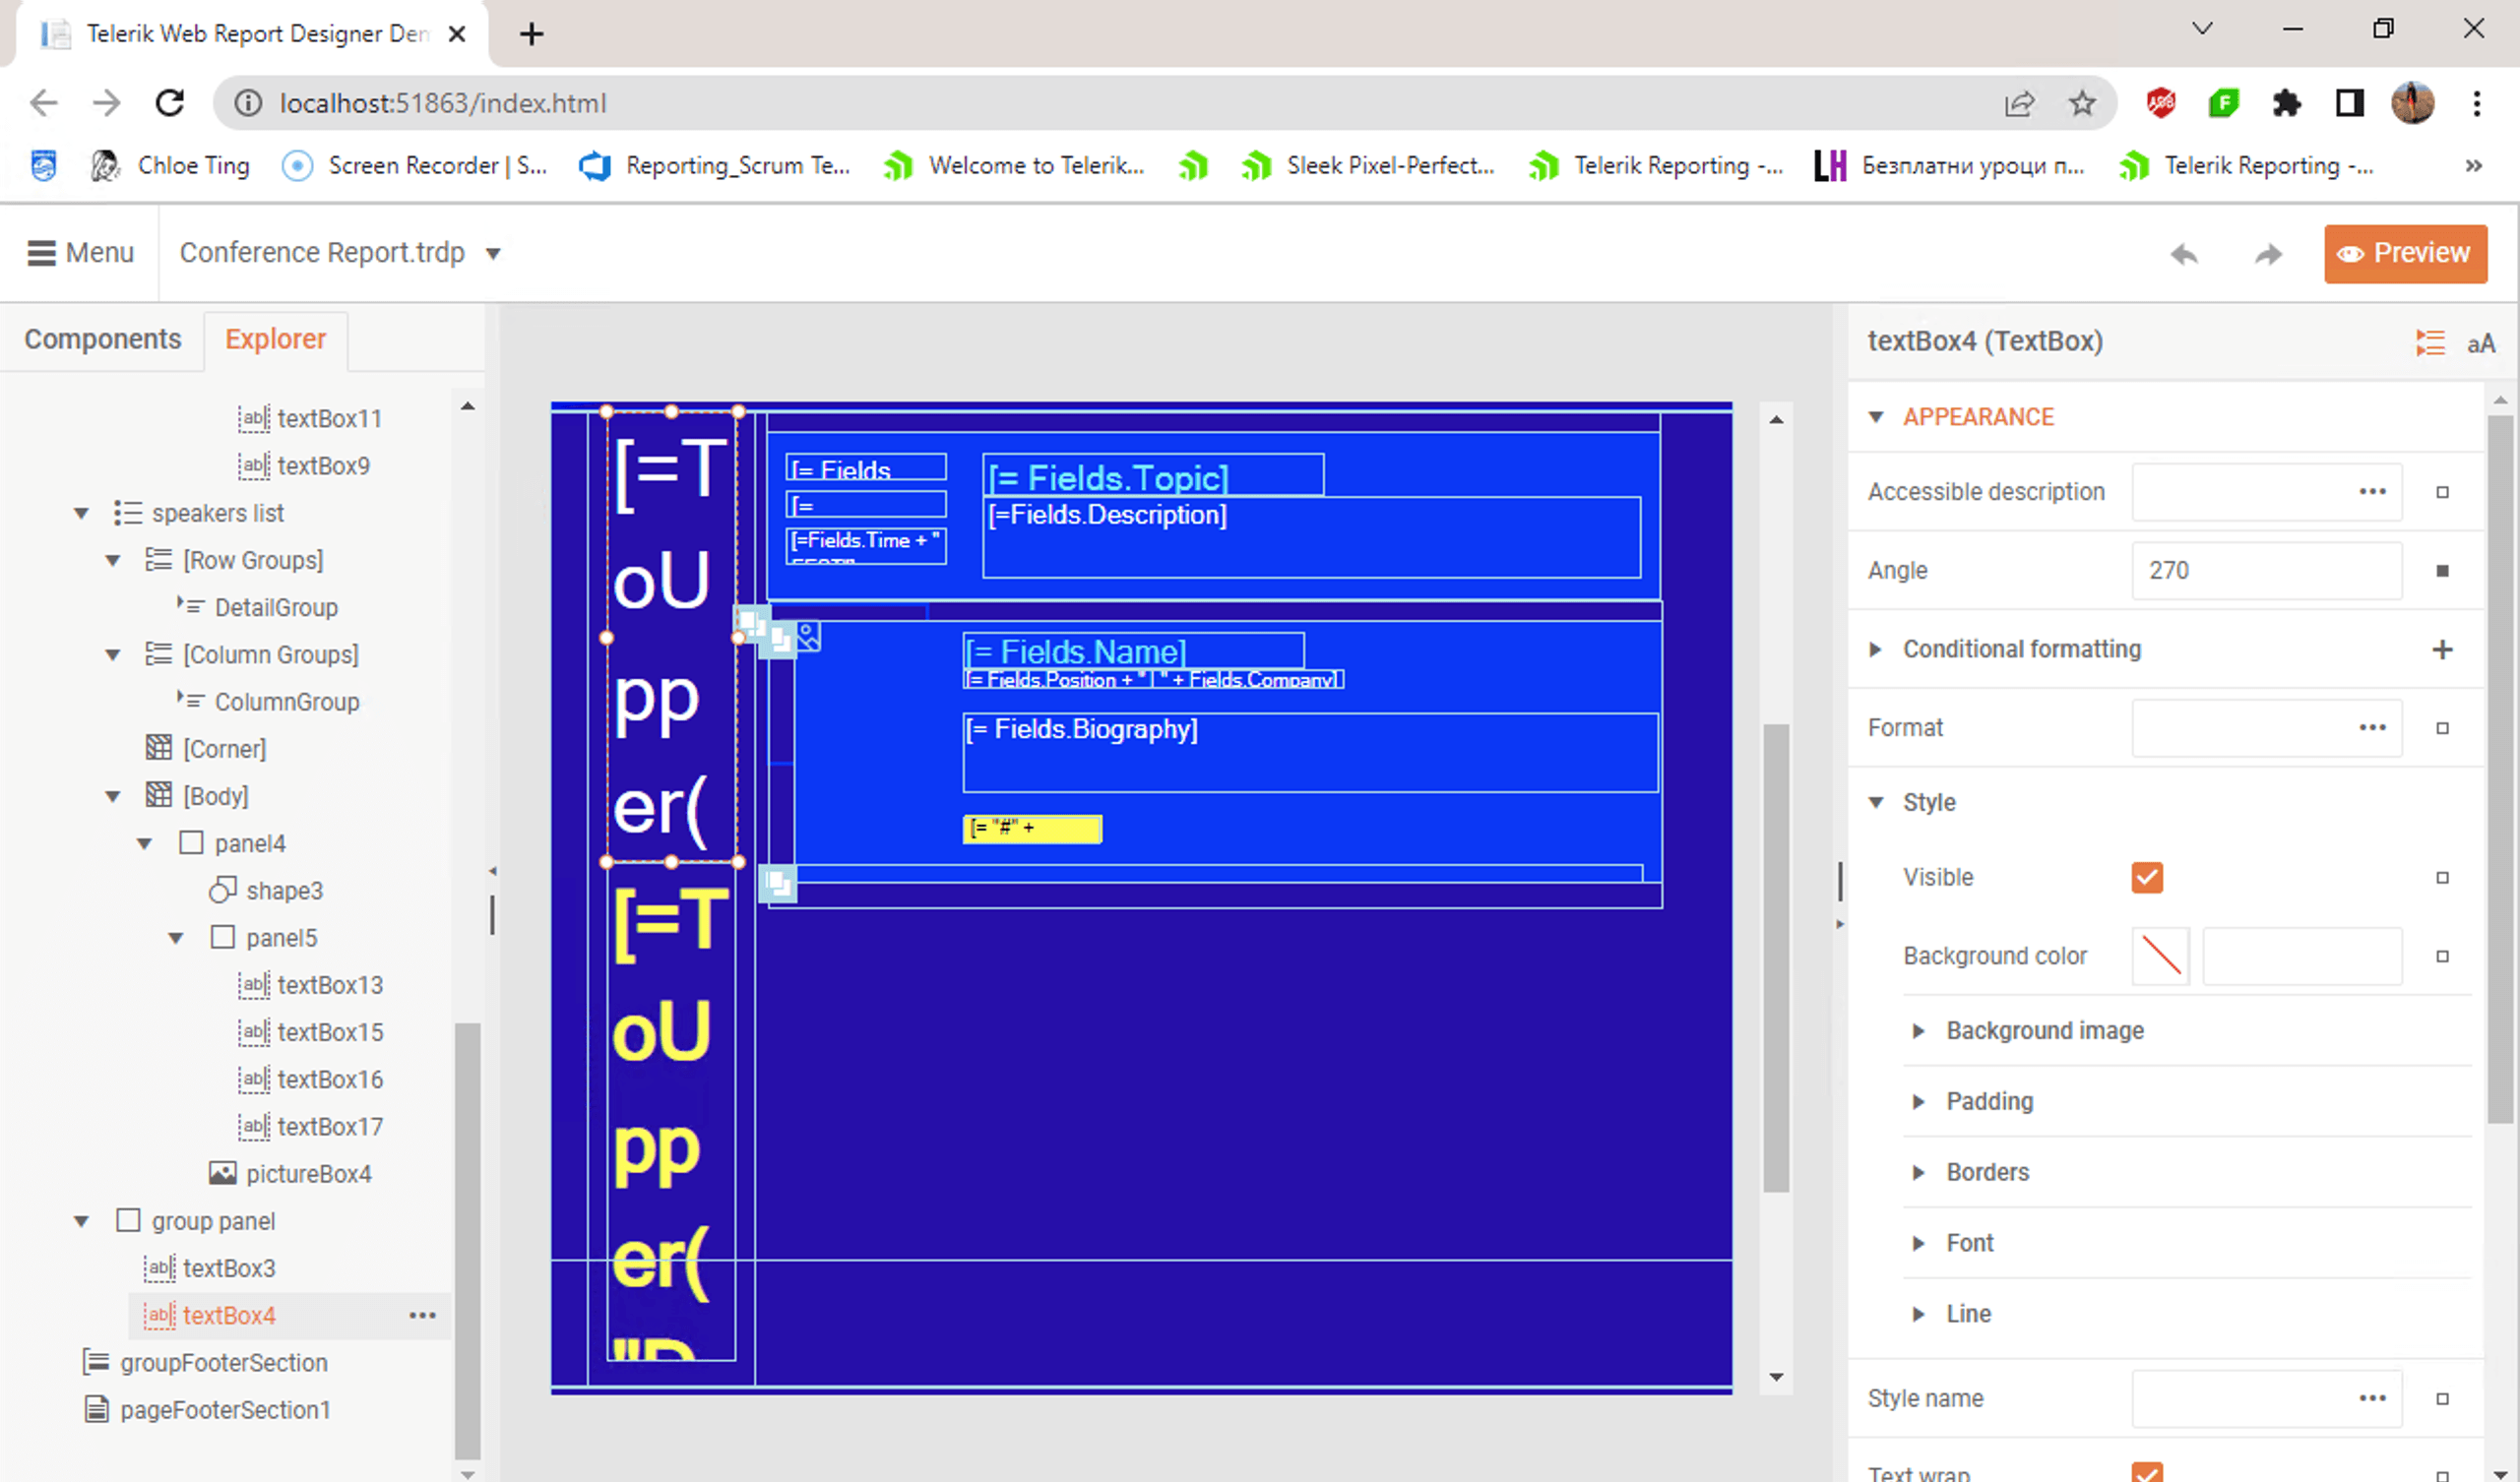
Final Look and Project
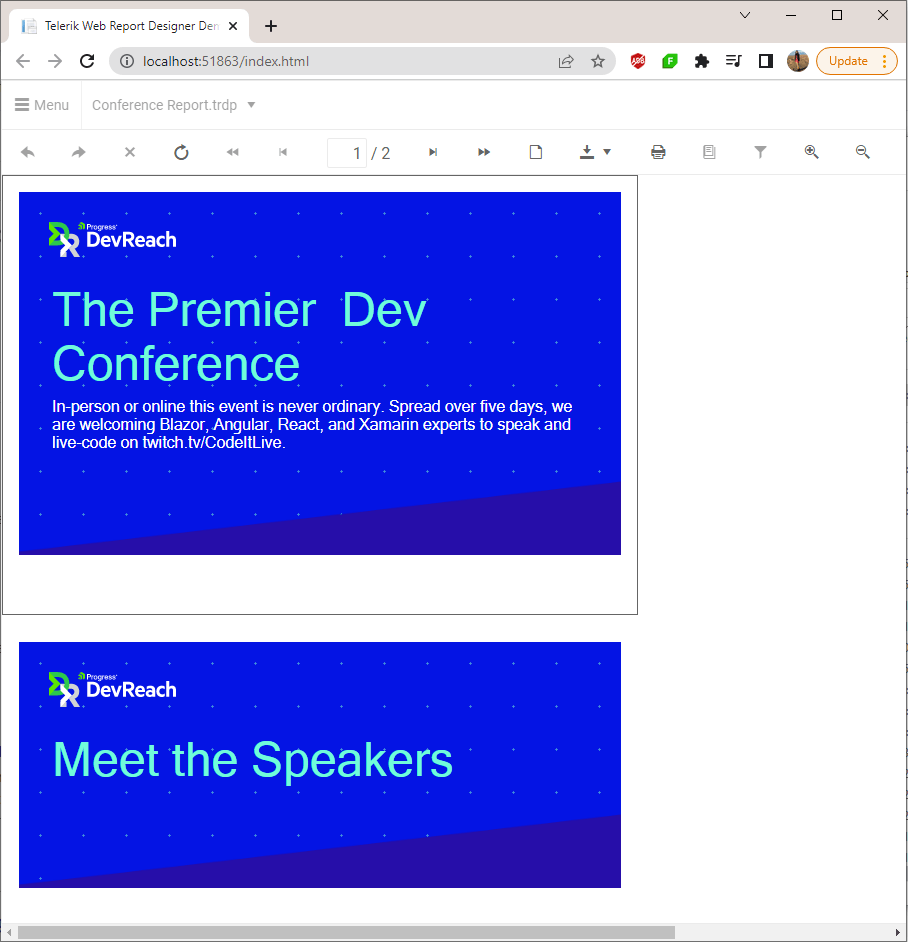
And we are all done! Click on the Preview button to check the final outcome.

You can also review the report in our online demos—Conference Report Demo. The full project can be found in our GitHub repository with sample projects.
Want to Try Telerik Reporting?
If you still have not, start your free trial of Telerik Reporting today and share your thoughts in our respective Feedback Portals, or right in the comments below.
Telerik Reporting is a complete, easy-to-use and powerful .NET embedded reporting tool for web and desktop applications that support: Blazor, ASP.NET Core, ASP.NET MVC, ASP.NET AJAX, HTML5/JS, Angular, React, Vue, WPF, WinForms and UWP.
Also available as a part of our Telerik DevCraft bundles, Reporting allows you to create, style, view and export rich, interactive and reusable reports to attractively present analytical and any business data. Add reports to any business application through report viewer controls. Export the ready reports in more than 15 formats.

Neli Todorova
Neli Todorova was a Technical Support Engineer in the Telerik Reporting division.
Related Posts
Comments
All articles
Topics
Latest Stories
in Your Inbox
Subscribe to be the first to get our expert-written articles and tutorials for developers!
All fields are required