Pillar Point Stewards, pypi-to-sqlite, improvements to shot-scraper and appreciating datasette-dashboards
8th April 2022
This week I helped Natalie launch the Pillar Point Stewards website and built a new tool for loading PyPI package data into SQLite, in order to help promote the excellent datasette-dashboards plugin by Romain Clement.
Pillar Point Stewards
I’ve been helping my wife Natalie Downe build the website for the Pillar Point Stewards initative that she is organizing on behalf of the San Mateo MPA Collaborative and California Academy of Sciences.
We live in El Granada, CA—home to the Pillar Point reef.
The reef has always been mixed-use, with harvesting of sea life such as mussels and clams legal provided the harvesters have an inexpensive fishing license.
Unfortunately, during the pandemic the number of people harvesting the reef raised by an order of magnitude—up to over a thousand people in just a single weekend. This had a major impact on the biodiversity of the reef, as described in Packed at Pillar Point by Anne Marshall-Chalmers for Bay Nature.
Pillar Point Stewards is an initiative to recruit volunteer stewards to go out on the reef during low tides, talking to people and trying to inspire curiosity and discourage unsustainable harvesting practices.
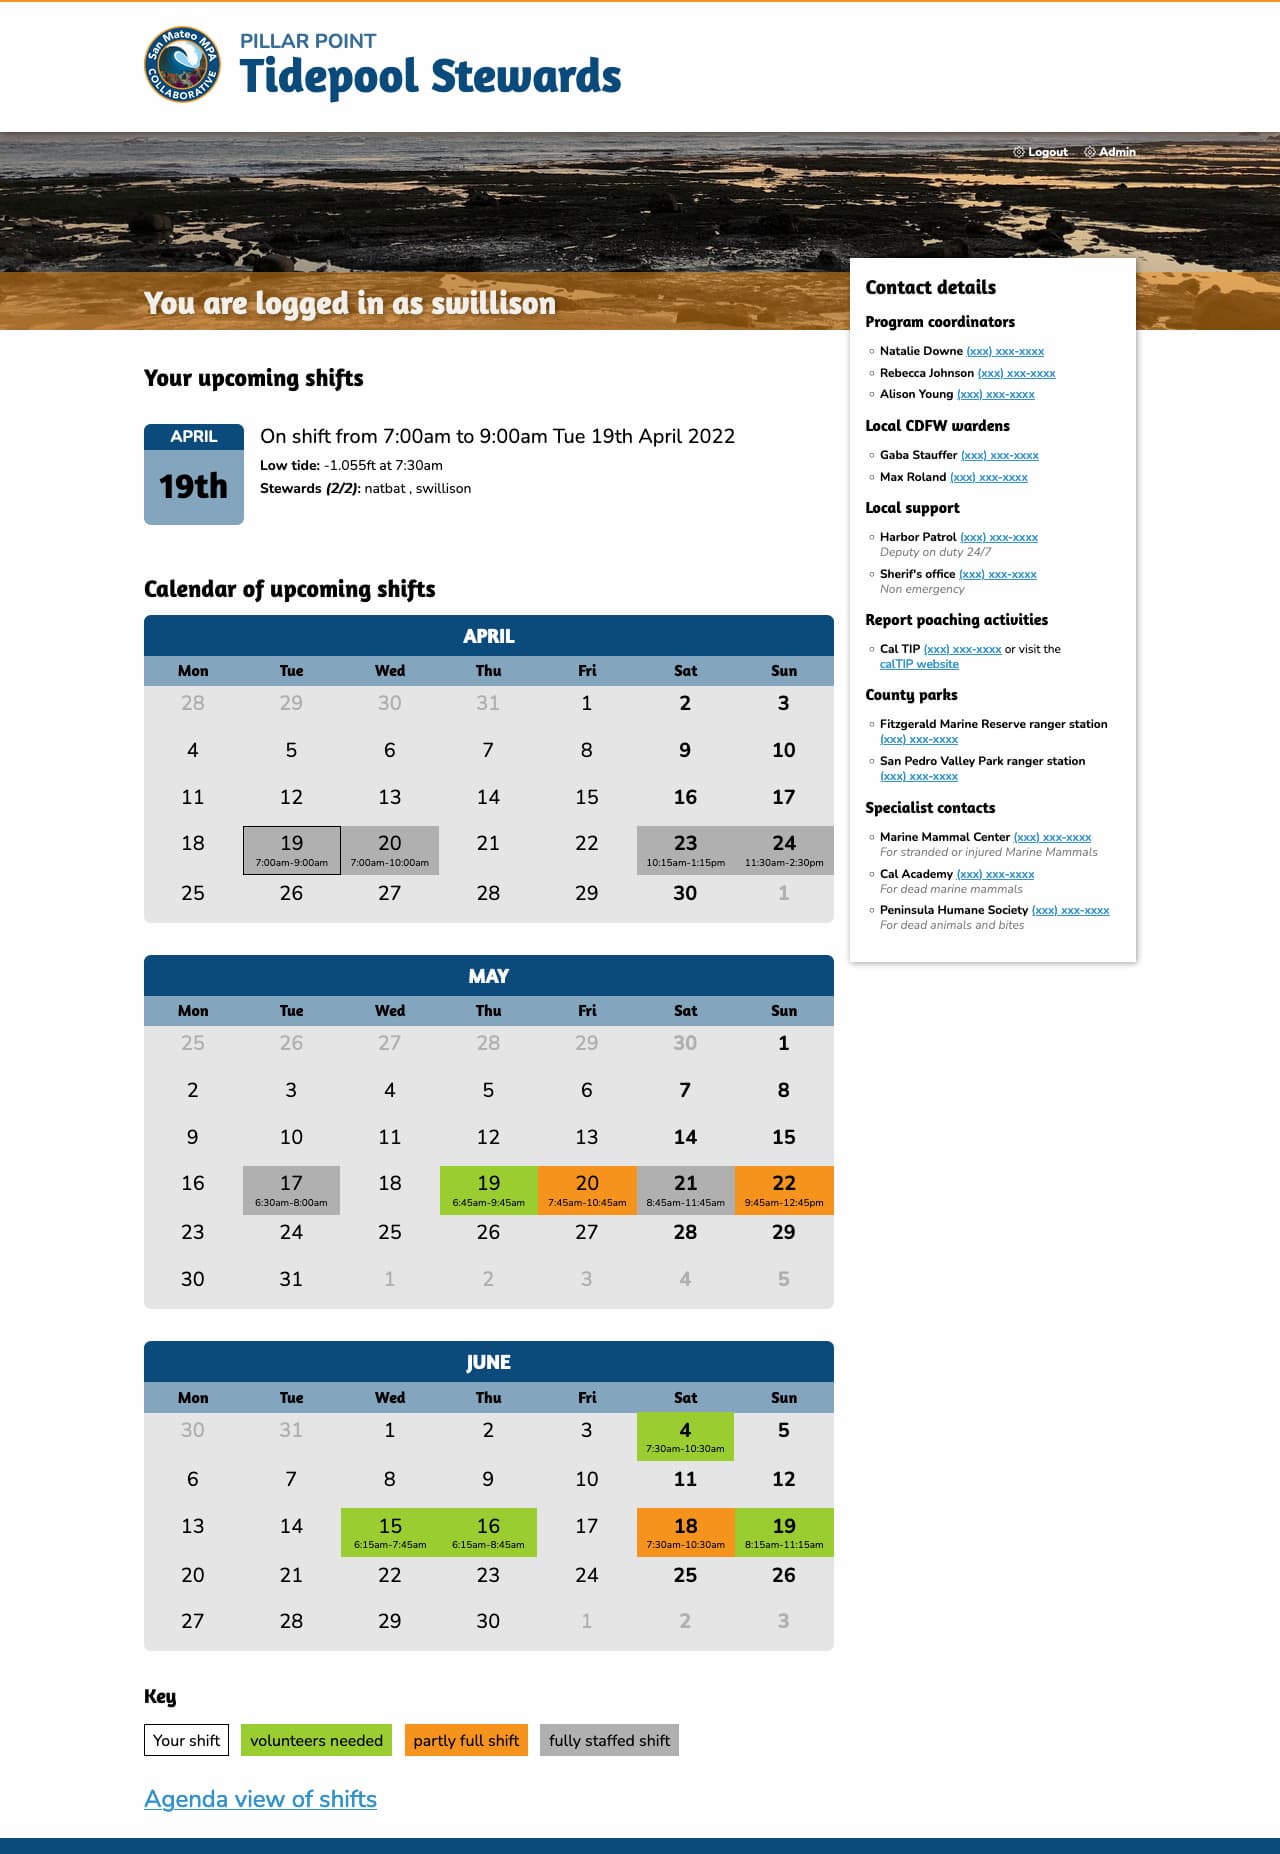
A very small part of the project is the website to support it, which helps volunteers sign up for shifts at low tides.
We re-used some of the work we had previously done for Rocky Beaches, in particular the logic for working with tide times from NOAA to decide when the shifts should be.
Natalie designed the site and built the front-end. I implemented the Django backend and integrated with Auth0 in order to avoid running our own signup and registration flow. This was the inspiration for the datasette-auth0 plugin I released last week.
Signed in volunteers can select their shift times from a calendar:
We also included an SVG tide chart on each shift page using the tide data from NOAA, which looks like this:

We’ve been building the site in public. You can see how everything works in the natbat/pillarpointstewards GitHub repository, including how the site uses continuous deployment against Fly.
datasette-dashboards
This is not my project, but I’m writing about it here because I only just found out about it and it’s really cool.
Romain Clement built a plugin for Datasette called datasette-dashboards. It’s best explained by checking out his live demo, which looks like this:
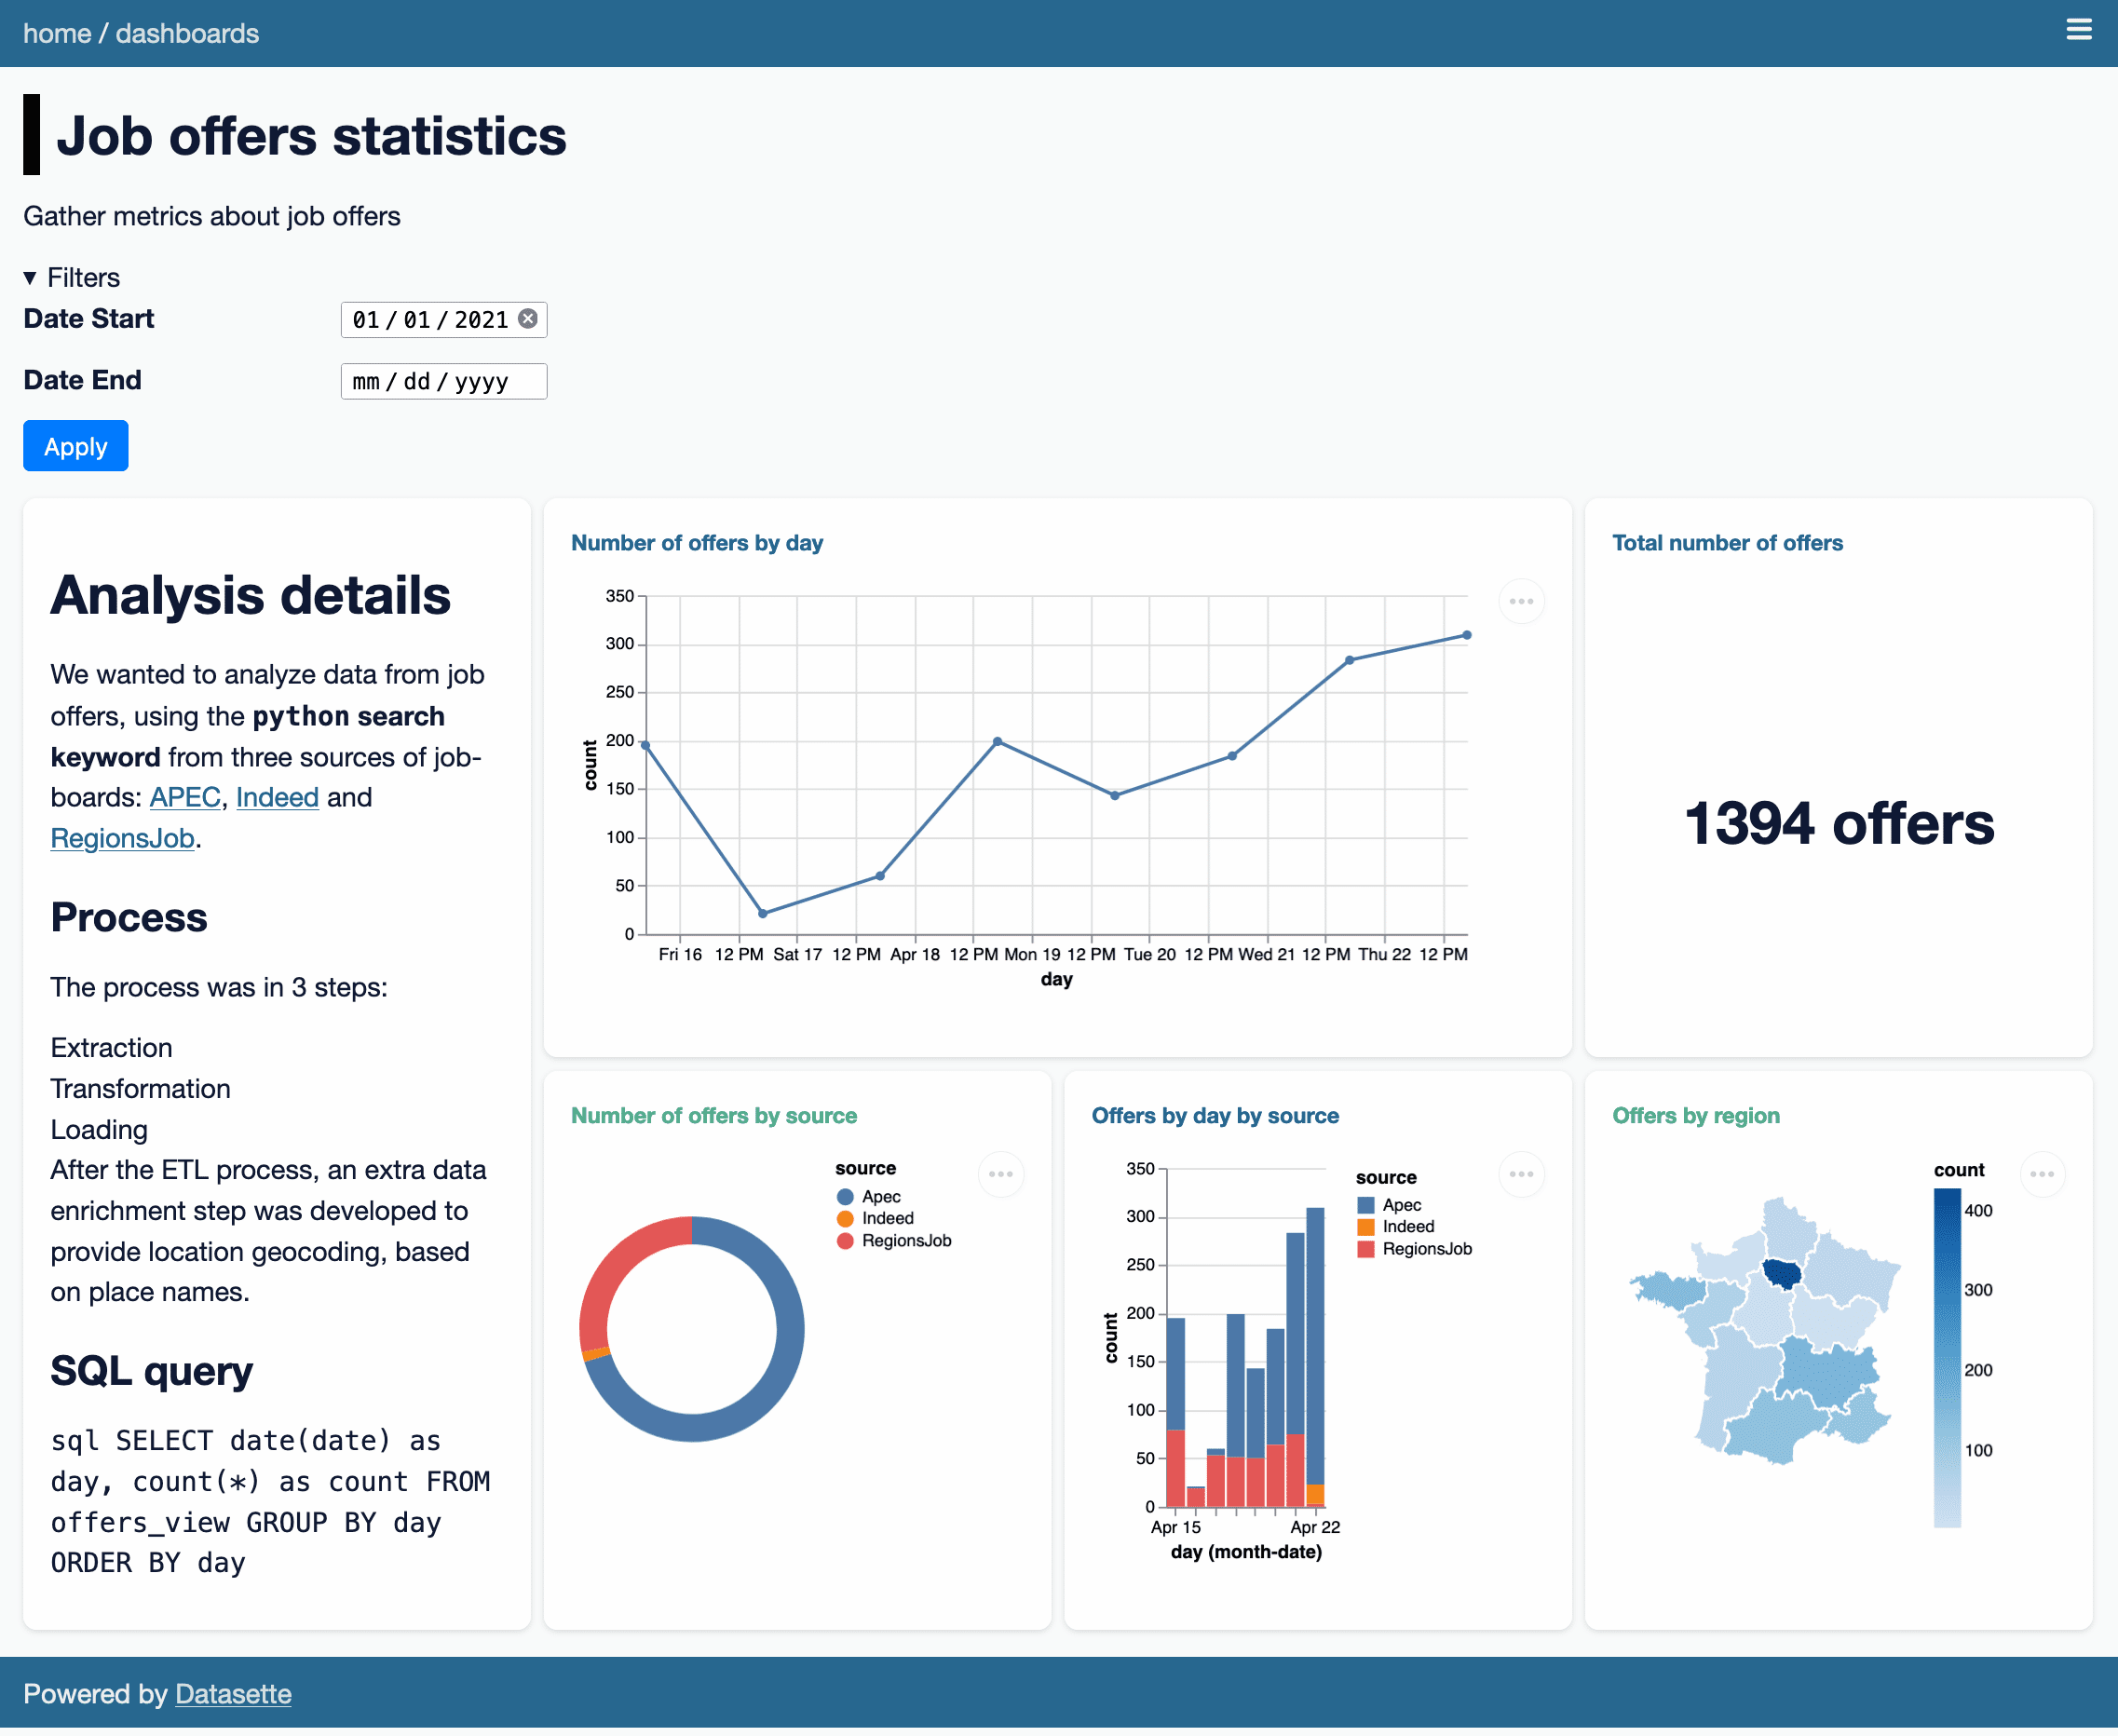
There are a bunch of clever ideas in this plugin.
It uses YAML syntax to define the different dashboard panels, outsourcing the actual visualization elements to Vega. You can see the YAML for the demo here. Here’s an edited subset of the YAML illustrating some interesting points:
plugins:
  datasette-dashboards:
    job-offers-stats:
      title: Job offers statistics
      description: Gather metrics about job offers
      layout:
        - [analysis-note, offers-day, offers-day, offers-count]
        - [analysis-note, offers-source, offers-day-source, offers-region]
      filters:
        date_start:
          name: Date Start
          type: date
          default: '2021-01-01'
        date_end:
          name: Date End
          type: date
      charts:
        analysis-note:
          library: markdown
          display: |-
            # Analysis details
            ...
        offers-count:
          title: Total number of offers
          db: jobs
          query: SELECT count(*) as count FROM offers_view WHERE TRUE [[ AND date >= date(:date_start) ]] [[ AND date <= date(:date_end) ]];
          library: metric
          display:
            field: count
            prefix:
            suffix: " offers"
        offers-day:
          title: Number of offers by day
          db: jobs
          query: SELECT date(date) as day, count(*) as count FROM offers_view WHERE TRUE [[ AND date >= date(:date_start) ]] [[ AND date <= date(:date_end) ]] GROUP BY day ORDER BY day
          library: vega
          display:
            mark: { type: line, tooltip: true }
            encoding:
              x: { field: day, type: temporal }
              y: { field: count, type: quantitative }
The SQL query for each panel is defined as query:—and can take parameters such as :date_end which are defined by the filters: section. Note that here one of the filters has a type of date, which turns into a <input type="date"> in the filter interface.
For library: vega panels the display: key holds the raw Vega specification, so anything the Vega visualization library can do is available to the plugin.
I didn’t know Vega could render choropleth maps! That map there is defined by this YAML, which loads a GeoJSON file of the regions in France from the gregoiredavid/france-geojson GitHub repository.
display:
  mark: geoshape
  projection: { type: mercator }
  transform:
    - lookup: region
      from:
        data:
          url: https://raw.githubusercontent.com/gregoiredavid/france-geojson/master/regions.geojson
          format: { type: json, property: features }
        key: properties.nom
        fields: [type, geometry]
I think my favourite trick though is the way it handles layout. The layout for the demo is defined thus:
layout:
  - [analysis-note, offers-day, offers-day, offers-count]
  - [analysis-note, offers-source, offers-day-source, offers-region]
This is then implemented using CSS grids! Here’s the template fragment that does the work:
<style>
  @media (min-width: 800px) {
    .dashboard-grid {
      {% if dashboard.layout %}
      grid-template-areas: {% for row in dashboard.layout %}"{% for col in row %}{{ col }} {% endfor %}" {% endfor %};
      {% else %}
      grid-template-columns: repeat(2, 1fr);
      {% endif %}
    }

    {% if dashboard.layout %}
    {% for chart_slug, chart in dashboard.charts.items() %}
    #card-{{ chart_slug }} {
      grid-area: {{ chart_slug }};
    }
    {% endfor %}
    {% endif %}
  }
</style>
Such a clever and elegant trick.
pypi-to-sqlite
I wanted to add datasette-dashboards to the official Datasette plugins directory, but there was a catch: since most of the plugins listed there are written by me, the site has some baked in expectations: in particular, it expects that plugins will all be using the GitHub releases feature (for example) to announce their releases.
Romain’s plugin wasn’t using that feature, instead maintaining its own changelog file.
I’ve been meaning to make the plugin directory more forgiving for a while. I decided to switch from using GitHub releases as the definitive source of release information to using releases published to PyPI (the Python package index) instead.
PyPI offers a stable JSON API: https://pypi.org/pypi/datasette-dashboards/json—which includes information on the package and all of its releases.
To reliably pull that information into datasette.io I decided on a two-step process. First, I set up a Git scraper to archive the data that I cared about into a new repository called pypi-datasette-packages.
That repo stores the current PyPI JSON for every package listed on the Datasette website. This means I can see changes made to those files over time by browsing the commit history. It also means that if PyPI is unavailable I can still build and deploy the site.
Then I wrote a new tool called pypi-to-sqlite to load that data into SQLite database tables. You can try that out like so:
pip install pypi-to-sqlite
pypi-to-sqlite pypi.db datasette-dashboards pypi-to-sqlite --prefix pypi_
That --prefix option causes the tables to be created with the specified prefix in their names.
Here are the three tables generated by that command:
Using data from these tables I was able to rework the SQL view that powers the plugins and tools directories on the site, and now datasette-dashboards has its own page there.
shot-scraper 0.10 and 0.11
shot-scraper is my tool for taking automated screenshots of web pages, built on top of Playwright.
Ben Welsh has been a key early adopter of shot-scraper, using it to power his news-homepages project which takes screenshots of various news websites and then both tweets the results and uploads them to the News Homepages collection on the Internet Archive.
shot-scraper 0.10 is mostly Ben’s work: he contributed both a --timeout option and a --browser option to let you install and use browsers other than the Chromium default!
(Ben needed this because some news homepages were embedding videos in a format that wasn’t supported by Chromium but did work fine in regular Chrome.)
Ryan Cheley also contributed to 0.10—thanks to Ryan, the shot-scraper multi command now continues taking shots even if one of them fails, unless you pass the --fail-on-error flag.
In writing my weeknotes, I decided to use shot-scraper to take a screenshot of the signed in homepage of the www.pillarpointstewards.com site.
In doing so, I found out that Google SSO refuses to work with the default Playwright Chromium! But it does continue to work with Firefox, so I fixed the shot-scraper auth to support the --browser option.
I took the screenshot like this:
shot-scraper auth https://www.pillarpointstewards.com/ -b firefox auth.json
# Now manually sign in with Auth0 and Google
shot-scraper https://www.pillarpointstewards.com/ -b firefox -a auth.json \
  --javascript "
    Array.from(
      document.querySelectorAll('[href^=tel]')
    ).forEach(el => el.innerHTML = '(xxx) xxx-xxxx')"
That --javascript line there redacts the phone numbers that are displayed on the page to signed in volunteers.
I created the second screenshot of just the tide times chart using this:
shot-scraper https://www.pillarpointstewards.com/shifts/182/ \
  -b firefox -a auth.json \
  --selector '.primary h2:nth-child(8)' \
  --selector .day-alone --padding 15
shot-scraper 0.11, released a few minutes ago, contains the new auth --browser feature plus some additional contributions from Ben Welsh, Ryan Murphy and Ian Wootten:
- New
shot-scraper accessibility --timeoutoption, thanks Ben Welsh. #59shot-scraper auth --browseroption for authentication using a browser other than Chromium. #61- Using
--qualitynow results in a JPEG file with the correct.jpgextension. Thanks, Ian Wootten. #58- New
--reduced-motionflag for emulating the “prefers-reduced-motion” media feature. Thanks, Ryan Murphy. #49
Releases this week
-
shot-scraper: 0.11—(12 releases total)—2022-04-08
Tools for taking automated screenshots of websites -
pypi-to-sqlite: 0.2.2—(3 releases total)—2022-04-08
Load data about Python packages from PyPI into SQLite -
shot-scraper: 0.10—(12 releases total)—2022-03-29
Tools for taking automated screenshots of websites
TIL this week
More recent articles
- Options for accessing Llama 3 from the terminal using LLM - 22nd April 2024
- AI for Data Journalism: demonstrating what we can do with this stuff right now - 17th April 2024
- Three major LLM releases in 24 hours (plus weeknotes) - 10th April 2024
- Building files-to-prompt entirely using Claude 3 Opus - 8th April 2024
- Running OCR against PDFs and images directly in your browser - 30th March 2024
- llm cmd undo last git commit - a new plugin for LLM - 26th March 2024
- Building and testing C extensions for SQLite with ChatGPT Code Interpreter - 23rd March 2024
- Claude and ChatGPT for ad-hoc sidequests - 22nd March 2024
- Weeknotes: the aftermath of NICAR - 16th March 2024
- The GPT-4 barrier has finally been broken - 8th March 2024