Haskell Performance Debugging
Someone posted a Treap implementation to reddit that was slow. Let’s analyze it and determine what’s up.
The repo is available here
Base Run
I set the code up in a Cabal project, created a makefile, and ran an initial profiling run.
The code and profiling output are in the base branch on GitHub.
Before we look at any of the executing code or profilign output, let’s check out the definition of the data structure in question:
data Node  v d = Node { val :: v, info :: d, prior :: Int }
    deriving (Eq, Show)
data Treap v d = Leaf | Tree {node :: Node v d, left :: Treap v d, right :: Treap v d}
    deriving Show
We have a binary tree along with some annotations. The spine and values are lazy, like a linked list.
Here’s the main function that we’re going to be inspecting output for:
main = do
    g <- getStdGen
    let nulls = repeat ()
        n = 100000
        rxs = take n $ randomRs (1,100000) g  :: [Int]
        nodeList = feedFold (zip rxs nulls) g buildNode
        treap = insertMany empty nodeList

    print $ heightTreap treap

    print $ map (\Node{val = v} -> v) $ inOrder treap
I build the executable with profiling and do a run with -p and -s.
This gets me a time and allocation profile.
Here’s the -s output:
   1,691,027,808 bytes allocated in the heap
   1,179,783,328 bytes copied during GC
      42,694,944 bytes maximum residency (25 sample(s))
       8,493,296 bytes maximum slop
             121 MB total memory in use (0 MB lost due to fragmentation)

                                     Tot time (elapsed)  Avg pause  Max pause
  Gen  0      3033 colls,     0 par    0.716s   0.752s     0.0002s    0.0008s
  Gen  1        25 colls,     0 par    0.544s   0.560s     0.0224s    0.0460s

  INIT    time    0.000s  (  0.000s elapsed)
  MUT     time    1.088s  (  1.140s elapsed)
  GC      time    1.260s  (  1.312s elapsed)
  RP      time    0.000s  (  0.000s elapsed)
  PROF    time    0.000s  (  0.000s elapsed)
  EXIT    time    0.000s  (  0.003s elapsed)
  Total   time    2.404s  (  2.455s elapsed)

  %GC     time      52.4%  (53.4% elapsed)

  Alloc rate    1,554,253,500 bytes per MUT second

  Productivity  47.6% of total user, 46.5% of total elapsed
52% time spent in GC isn’t great.
The profiling output indicates we’re spending the vast majority of our time in the splitTreap function.
So let’s look there and see what’s up:
splitTreap :: (Ord v) => Treap v d -> v -> (Treap v d, Treap v d)
splitTreap Leaf _ = (Leaf, Leaf)
splitTreap (tree @ Tree {node = Node { val = x }, left = l, right = r})   v
    | x < v  =
        let (lt, rt) = splitTreap r v
         in ( Tree { node = node tree, left = l, right = lt }
            , rt
            )
    | v <= x =
        let (lt, rt) = splitTreap l v
         in ( lt
            , Tree { node = node tree, left = rt, right = r}
            )
I see two things that are concerning to me:
- Tuples.
- Recursion.
Tuples are a source of often unwanted laziness and space leaks. GHC can sometimes “see through” a tuple data structure and unbox it entirely, making it 0 overhead. However, sometimes it can’t, and then you have a bunch more allocations and thunks happening.
Recursion totally defeats GHC’s ability to inline things, which can wreck performance.
Stuff like map, foldr, etc. have clever means of being optimized, but naive recursive functions can often have issues with inlining.
So, these are my impressions before I get started with experimenting.
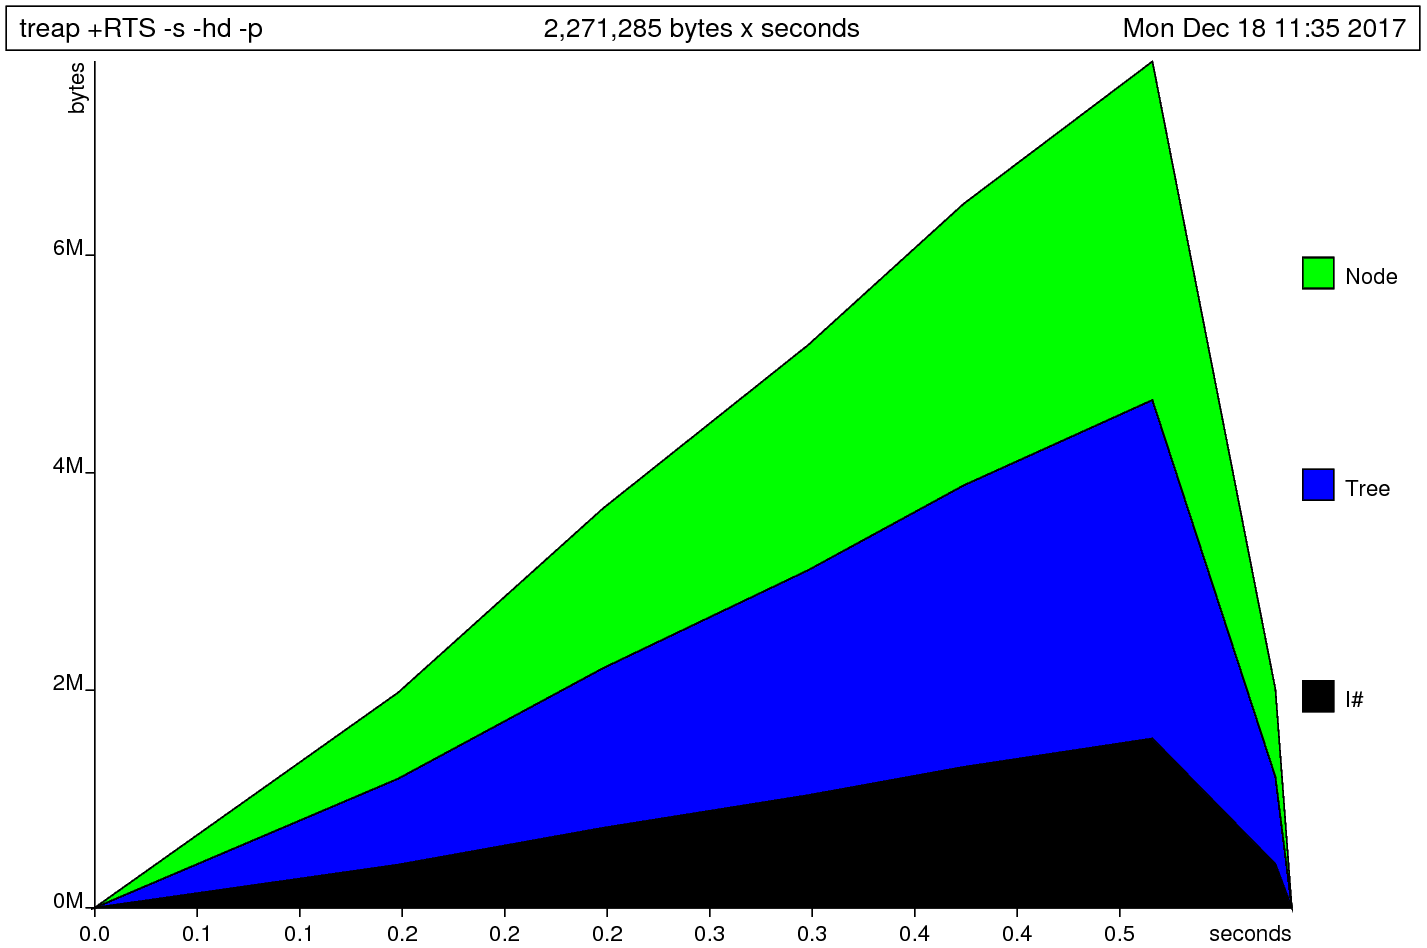
In order to test my “tuple allocation” hypothesis, I’m going to run a heap profiling run.
We’ll use the -hd flag to get the data constructors that are allocated:
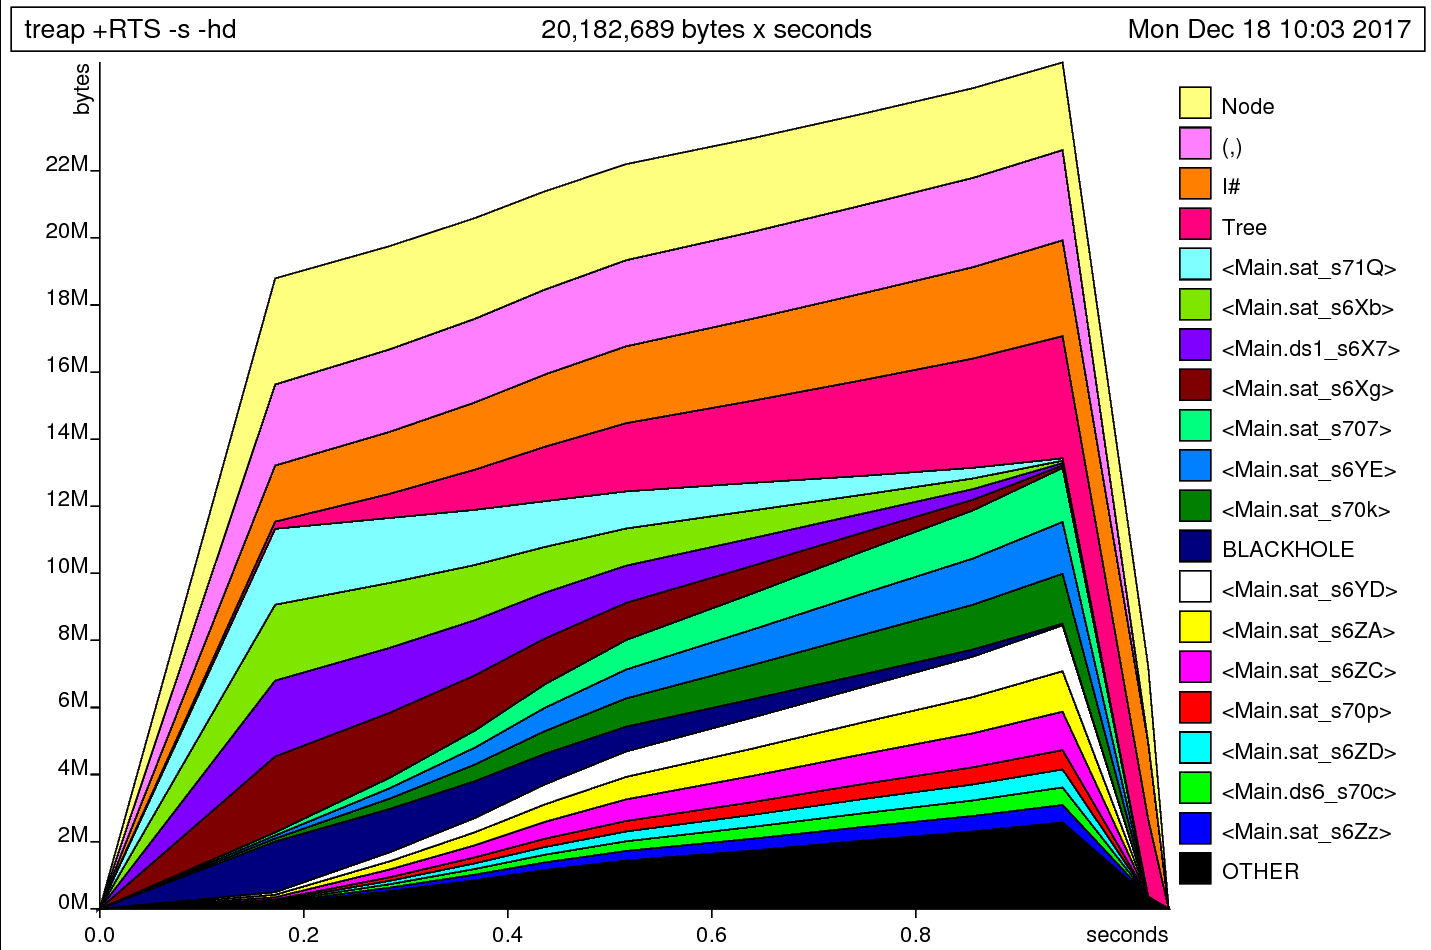
Neat! Okay, so this graph tells us that we allocate a ton of nodes, tuples, and I# (the constructor for Int), before we start allocating a bunch of Tree constructors.
Given the main function we’re dealing with, that’s not entirely unreasonable.
Experiment One: Strictifying the Data Structure
The code for this section is in strictify-treap.
I modify the data structure by placing bang patterns at certain points:
data Node v d
    = Node
    { val :: !v
    , info :: d
    , prior :: !Int
    } deriving (Eq, Show)

data Treap v d
    = Leaf
    | Tree
    { node :: !(Node v d)
    , left :: Treap v d
    , right :: Treap v d
    } deriving Show
This makes the Node type strict in the val and prior fields, and the Treap type strict in the node field.
The info field is left lazy, like most containers.
We are leaving the spine of the data structure lazy as well.
Here’s the -s output:
   1,659,050,200 bytes allocated in the heap
   1,144,049,696 bytes copied during GC
      43,890,168 bytes maximum residency (33 sample(s))
       8,508,680 bytes maximum slop
             102 MB total memory in use (0 MB lost due to fragmentation)

                                     Tot time (elapsed)  Avg pause  Max pause
  Gen  0      2905 colls,     0 par    0.676s   0.696s     0.0002s    0.0007s
  Gen  1        33 colls,     0 par    0.544s   0.567s     0.0172s    0.0409s

  INIT    time    0.000s  (  0.000s elapsed)
  MUT     time    0.920s  (  0.996s elapsed)
  GC      time    1.220s  (  1.263s elapsed)
  RP      time    0.000s  (  0.000s elapsed)
  PROF    time    0.000s  (  0.000s elapsed)
  EXIT    time    0.000s  (  0.001s elapsed)
  Total   time    2.196s  (  2.260s elapsed)

  %GC     time      55.6%  (55.9% elapsed)

  Alloc rate    1,803,315,434 bytes per MUT second

  Productivity  44.4% of total user, 44.1% of total elapsed
We’re using about 20MB less memory now, which is good. And we’re using less time overall (2.4 vs 2.2 seconds), which is also good! But we’re actually doing 55% GC now, which is worse than before!
Here’s the output of the heap profile now:
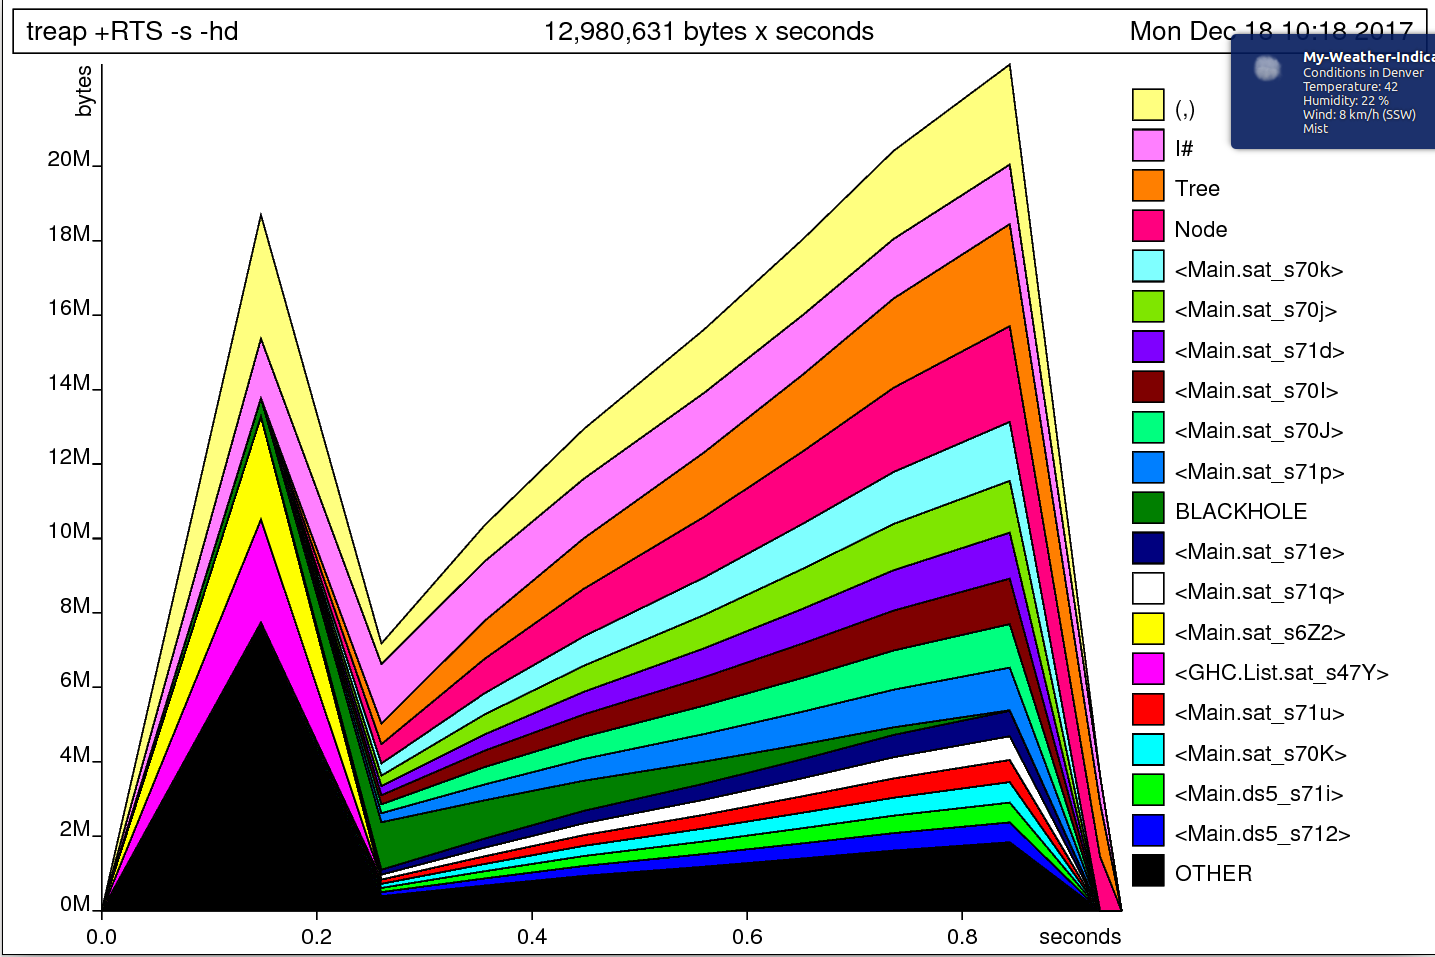
This hasn’t made a huge difference, but it’s certainly a bit better. The time and allocation profile tell another story: we’ve gone from 2.49 seconds to run the program to 0.97 seconds.
I’m feeling pretty encouraged by this, so I’m going to make the tree spine-strict as well.
data Node v d
    = Node
    { val :: !v
    , info :: d
    , prior :: !Int
    } deriving (Eq, Show)

data Treap v d
    = Leaf
    | Tree
    { node :: !(Node v d)
    , left :: !(Treap v d)
    , right :: !(Treap v d)
    } deriving Show
We’re still at around 94MB of total memory in use according to the -s output:
   1,161,437,656 bytes allocated in the heap
     449,893,272 bytes copied during GC
      43,890,328 bytes maximum residency (24 sample(s))
       8,520,808 bytes maximum slop
              94 MB total memory in use (0 MB lost due to fragmentation)

                                     Tot time (elapsed)  Avg pause  Max pause
  Gen  0      2143 colls,     0 par    0.152s   0.166s     0.0001s    0.0006s
  Gen  1        24 colls,     0 par    0.188s   0.203s     0.0085s    0.0272s

  INIT    time    0.000s  (  0.000s elapsed)
  MUT     time    0.556s  (  0.644s elapsed)
  GC      time    0.320s  (  0.345s elapsed)
  RP      time    0.000s  (  0.000s elapsed)
  PROF    time    0.020s  (  0.024s elapsed)
  EXIT    time    0.000s  (  0.000s elapsed)
  Total   time    0.952s  (  0.989s elapsed)

  %GC     time      33.6%  (34.9% elapsed)

  Alloc rate    2,088,916,647 bytes per MUT second

  Productivity  64.3% of total user, 62.6% of total elapsed
This is much better. 33% GC isn’t great, but it’s much better than we had before. We’re down from 2.4 seconds to 0.95 seconds, which is a substantial improvement.
Let’s look at the heap output now:
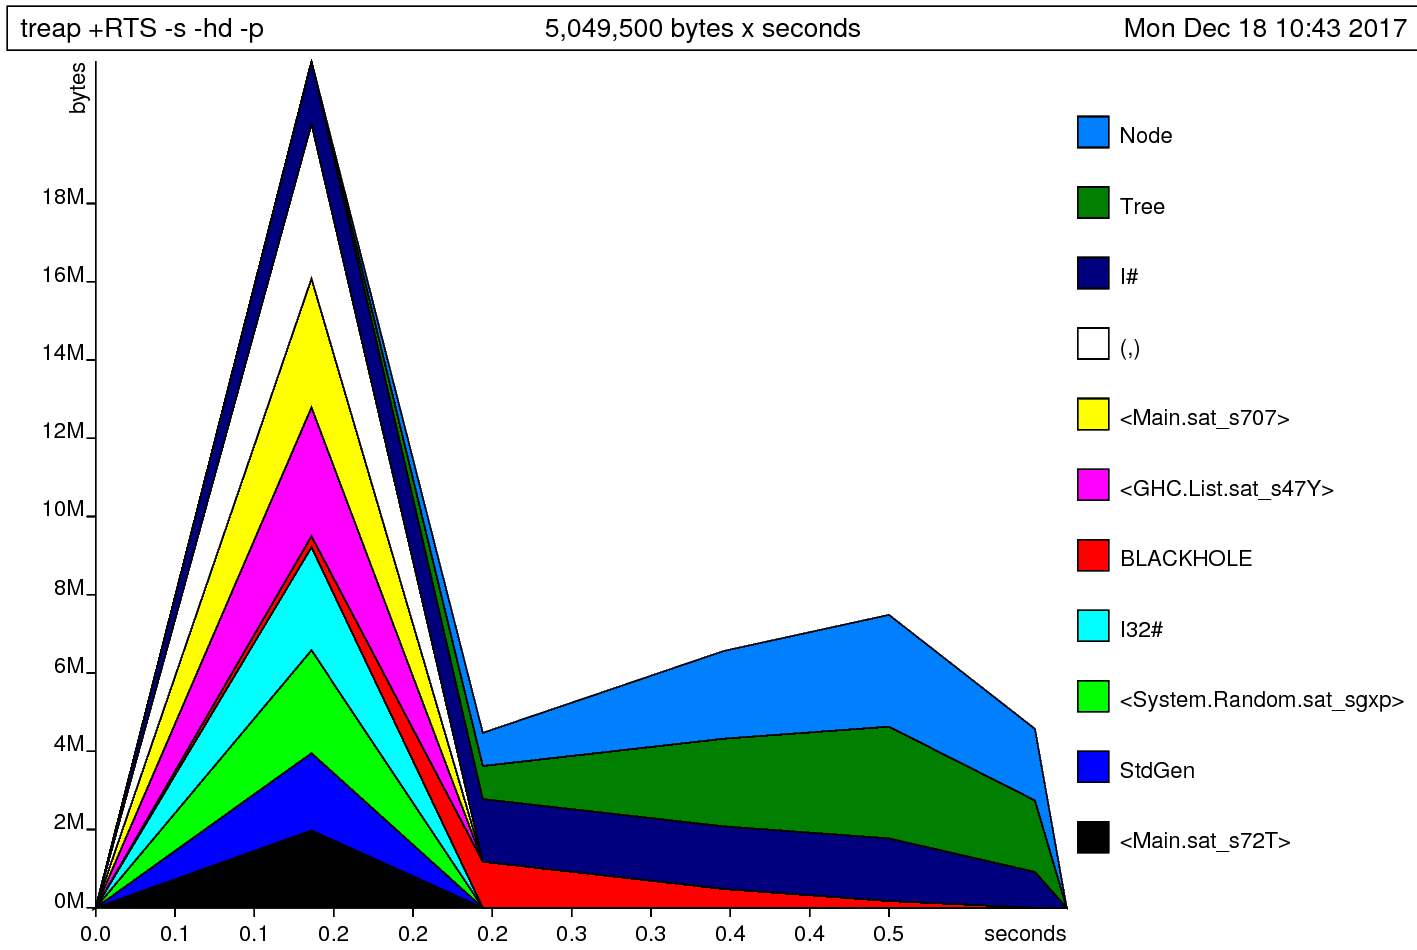
Now that’s a lot closer! We’ll note that we generate a big spike of memory, and then collect it all. That’s a pretty tell-tale sign that something’s up. We’ve got a lot of allocations on tuple constructors, which bothers me.
Strictifying the Split
We’re still at the largest offendor being splitTreap, which is responsible for nearly half of the runtime of the program.
We know we’re allocating and then throwing away tuples, so we’ve likely got a space leak there.
I am going to add bang patterns inside of the tuples and observe the output.
Here’s the change:
splitTreap :: (Ord v) => Treap v d -> v -> (Treap v d, Treap v d)
splitTreap Leaf _ = (Leaf, Leaf)
splitTreap (tree @ Tree {node = Node { val = x }, left = l, right = r})   v
    | x < v  = let (!lt, !rt) = splitTreap r v in
                (   Tree { node = node tree, left = l, right = lt },
                    rt  )
    | v <= x = let (!lt, !rt) = splitTreap l v in
                (   lt,
                    Tree { node = node tree, left = rt, right = r}  )
Where the original code destructures the tuple immediately and leaves the lt and rt variables lazy, this forces those variables to weak head normal form.
Here’s the new -s output:
   1,331,896,120 bytes allocated in the heap
     497,880,136 bytes copied during GC
      43,890,328 bytes maximum residency (25 sample(s))
       8,516,712 bytes maximum slop
              94 MB total memory in use (0 MB lost due to fragmentation)

                                     Tot time (elapsed)  Avg pause  Max pause
  Gen  0      2245 colls,     0 par    0.188s   0.186s     0.0001s    0.0007s
  Gen  1        25 colls,     0 par    0.212s   0.251s     0.0100s    0.0386s

  INIT    time    0.000s  (  0.000s elapsed)
  MUT     time    0.636s  (  0.756s elapsed)
  GC      time    0.360s  (  0.394s elapsed)
  RP      time    0.000s  (  0.000s elapsed)
  PROF    time    0.040s  (  0.043s elapsed)
  EXIT    time    0.000s  (  0.000s elapsed)
  Total   time    1.084s  (  1.151s elapsed)

  %GC     time      33.2%  (34.2% elapsed)

  Alloc rate    2,094,176,289 bytes per MUT second

  Productivity  63.1% of total user, 62.0% of total elapsed
This is barely changed at all from the previous run.
The heap profile didn’t change, either.
I’m going to do a run now with -hc to see where these tuples are getting allocated.
-hc records which functions are actually producing the data, which tells us where to focus our efforts.
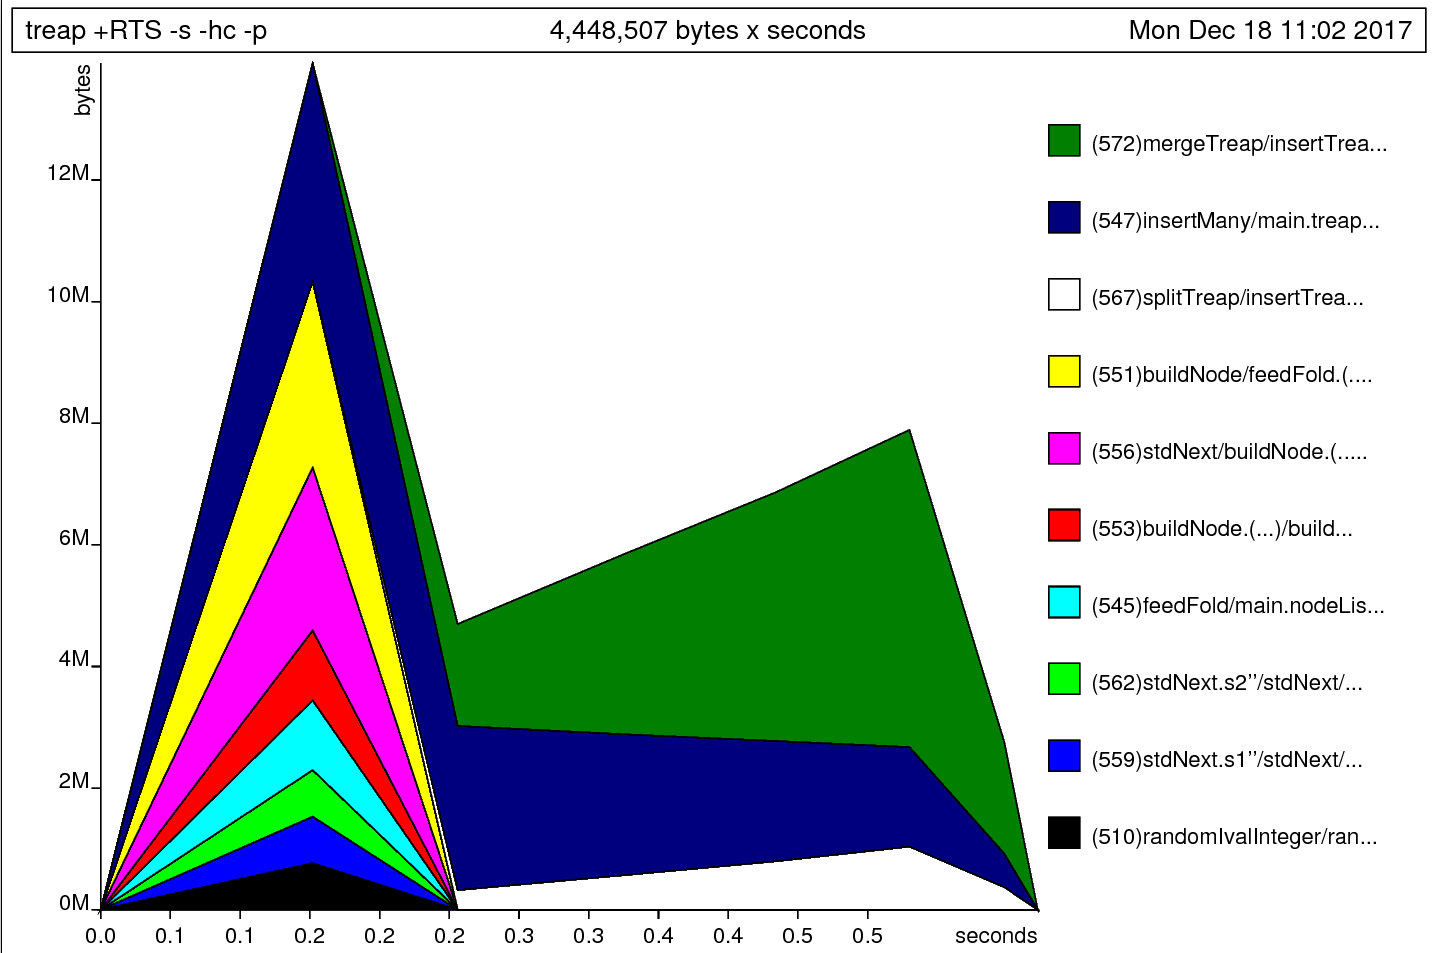
Ah, nuts! splitTreap is allocating a tiny amount of memory now.
It looks like we’re allocating the most in buildNode, feedFold, and insertMany.
This seems to disagree with the -p output, which indicates that we’re spending the majority of our time and allocations in splitTreap.
Well, I guess I’ll focus on insertMany now.
insertMany
The code for this section is on insert-many in GitHub.
mergeTreap is curried for some reason:
mergeTreap :: (Treap v d, Treap v d) -> Treap v d
And this bothers me, so I’m uncurrying it. This doesn’t do anything.
At this point I actually look at insertMany:
insertMany :: (Ord v) => Treap v d -> [Node v d] -> Treap v d
insertMany = foldl insertTreap
Oh. Duh. foldl strikes again.
insertMany :: (Ord v) => Treap v d -> [Node v d] -> Treap v d
insertMany = foldl' insertTreap
Who would win, GHC’s amazing optimization powers, or one prime boi??
-s output:
   1,115,162,944 bytes allocated in the heap
     245,033,472 bytes copied during GC
      12,088,896 bytes maximum residency (22 sample(s))
         306,112 bytes maximum slop
              32 MB total memory in use (0 MB lost due to fragmentation)

                                     Tot time (elapsed)  Avg pause  Max pause
  Gen  0      2134 colls,     0 par    0.116s   0.128s     0.0001s    0.0003s
  Gen  1        22 colls,     0 par    0.080s   0.105s     0.0048s    0.0136s

  INIT    time    0.000s  (  0.000s elapsed)
  MUT     time    0.596s  (  0.700s elapsed)
  GC      time    0.180s  (  0.216s elapsed)
  RP      time    0.000s  (  0.000s elapsed)
  PROF    time    0.016s  (  0.018s elapsed)
  EXIT    time    0.000s  (  0.001s elapsed)
  Total   time    0.852s  (  0.916s elapsed)

  %GC     time      21.1%  (23.6% elapsed)

  Alloc rate    1,871,078,765 bytes per MUT second

  Productivity  77.0% of total user, 74.4% of total elapsed
Nice, down to 32MB of total memory in use, and about a tenth of a second less time overall. We’re also only spending 21% of our time in garbage collection, which is a huge win.
Let’s check out the heap profile:
Never Ever Use foldl
Always Use foldl'
What if we go back to the beginning and only do the foldl to foldl' change?
I run git checkout base to get back to the original timeline, change foldl to foldl'.
Here’s -s:
   1,581,972,168 bytes allocated in the heap
   1,140,799,032 bytes copied during GC
      40,964,944 bytes maximum residency (43 sample(s))
         495,784 bytes maximum slop
             114 MB total memory in use (0 MB lost due to fragmentation)

                                     Tot time (elapsed)  Avg pause  Max pause
  Gen  0      3044 colls,     0 par    0.664s   0.636s     0.0002s    0.0004s
  Gen  1        43 colls,     0 par    0.796s   0.812s     0.0189s    0.0611s

  INIT    time    0.000s  (  0.000s elapsed)
  MUT     time    0.964s  (  1.226s elapsed)
  GC      time    1.336s  (  1.320s elapsed)
  RP      time    0.000s  (  0.000s elapsed)
  PROF    time    0.124s  (  0.128s elapsed)
  EXIT    time    0.000s  (  0.002s elapsed)
  Total   time    2.488s  (  2.548s elapsed)

  %GC     time      53.7%  (51.8% elapsed)

  Alloc rate    1,641,049,966 bytes per MUT second

  Productivity  41.3% of total user, 43.2% of total elapsed
Not great – actually a little worse than where we started! What about the heap profile?
This profile is also nearly the same!
The allocations appear to be a little smoother, but not significantly different.
So just switching to foldl' without also making the data structure strict didn’t help.
Final Run
Finally, we disable profiling and run the code again:
     650,786,800 bytes allocated in the heap
     132,515,880 bytes copied during GC
       7,278,528 bytes maximum residency (17 sample(s))
         353,296 bytes maximum slop
              21 MB total memory in use (0 MB lost due to fragmentation)

                                     Tot time (elapsed)  Avg pause  Max pause
  Gen  0      1233 colls,     0 par    0.112s   0.100s     0.0001s    0.0004s
  Gen  1        17 colls,     0 par    0.056s   0.056s     0.0033s    0.0122s

  INIT    time    0.000s  (  0.000s elapsed)
  MUT     time    0.212s  (  0.341s elapsed)
  GC      time    0.168s  (  0.156s elapsed)
  EXIT    time    0.000s  (  0.000s elapsed)
  Total   time    0.436s  (  0.497s elapsed)

  %GC     time      38.5%  (31.3% elapsed)

  Alloc rate    3,069,749,056 bytes per MUT second

  Productivity  61.5% of total user, 68.7% of total elapsed
We get 21MB total memory usage and 0.43 seconds of execution time.
Conclusion?
Strict in the spine, lazy in the leaves
Data structures should be strict in the spine and lazy in the leaves, unless you explicitly intend on constructing/consuming the data constructor in a streaming fashion.
Never use foldl
Seriously, don’t.
Make an hlint rule to never use it.
Ban it from your codebase.
Make a GHC proposal to repeal and replace it in Prelude.