Overview of the Wireshark User Interface (GUI)
Wireshark is a Free and Open Source Software (FOSS) and it is developed by a community of enthusiastic developers. Wireshark (formerly Ethereal) is used for capturing and investigating the traffic going on a network. It is a very popular network protocol analyzer among network professionals, security analysts, and research scholars around the world. The good thing is that it is open source and freely available under the GNU General Public License version 2. It is available for major OSes like Windows, macOS, Linux, and UNIX.
Wireshark has many features like profound inspection of network traffic, real-time capture, offline analysis, R/W support for different capture file types etc. It also organizes SharkFest, an annual educational conference, around the world for imparting knowledge of their product. These conferences are focused on the best practices of using Wireshark.
What will we cover?
In this guide, we will see an overview of Wireshark's user interface. Let’s dive in now to explore Wireshark GUI.
Wireshark’s Startup Screen
When you launch Wireshark, the following startup screen appears:
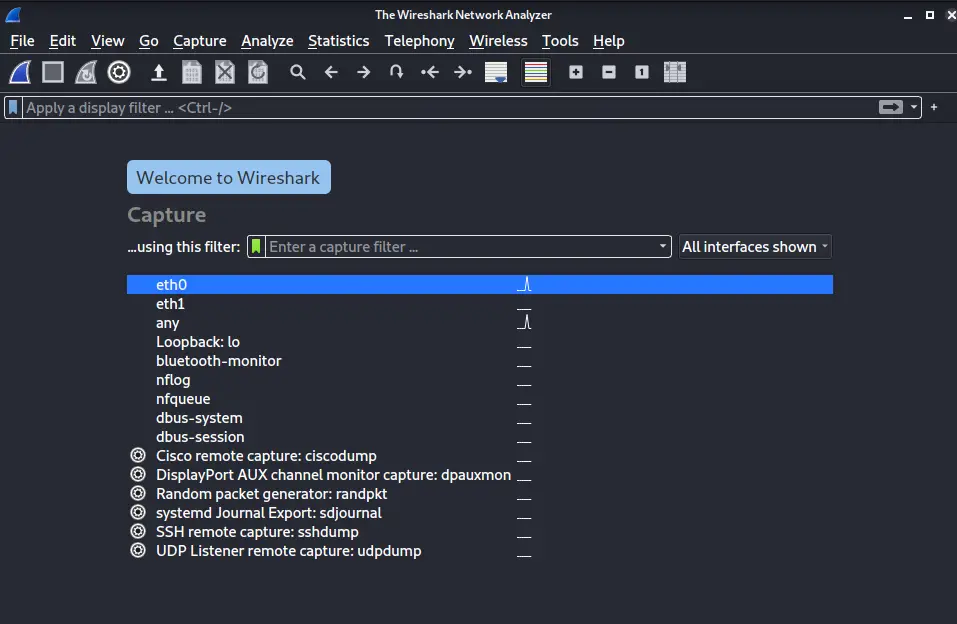
Let us break down the whole interface into four parts:
- Main Menu
- Main Menu Toolbar
- Filter Tool
- Interface list
The Main Menu Bar
![]()
It is located at the top of the main window and has 11 items. We are not going to describe each item in detail, but important aspects of a few.
1. File Menu
The file menu contains the basic IO operation set. You can open and close files, import and export operations and of course you can quit Wireshark from here.
2. Edit Menu
Marking/Unmarking: Use this option or the ‘Ctrl + M’ to mark/unmark a packet. It actually helps when you later want to inspect a packet.
Packet Comment: You can add a comment to a selected packet with this option or alternatively use the shortcut ‘Ctrl + Alt+C’ to do the same. Comment helps to collaborate with other people or to remember things ourselves when later we approach our work.
Configuration profiles: It is actually a great tool to customize Wireshark as per our requirements. For e.g. we can organize columns by adding a new one or rearranging them. Profiles can be added and can also be downloaded and then imported to Wireshark. The profile can also be changed from the bottom right panel.
Preferences: Here when you click it, a prompt window will open from where you can control the look and feel of the GUI, set capture options, and other advanced features like adding RSA keys, modifying protocol settings etc. This submenu can also be used to customize our configuration profile.
3. View Menu
This menu deals with the display of tools on the main screen, time format to use, packet colorization options, zooming options etc. For e.g. instead of showing time in seconds you can show it in UTC. We can colorize and decolorize packets and even change the colorization rules.
4. Go Menu
This is actually a packet management menu. You can use it to traverse capture packets. The “Next Packet” and “Previous Packet” buttons can be used to navigate the display data on the screen. Of Course, you can simply use the ‘Ctrl + up/down’ buttons or the mouse scroll to more easily do the traversing.
5. Capture Menu
Use it to control the start and stop position of Capture and to edit and add capture filters.
6. Analyze Menu
Here one can add and edit display filters as well as display filter macros, decode packets as specific protocols, follow TCP or UDP stream etc. One can select a packet and then from the packet details pane apply a filter using ‘Analyze -> Apply as filter’.
7. Statistics Menu
It is just like a reporting tool. We can break down the whole packet capture statistically. We can for e.g., see what portion of the capture is IPv6 or UDP. So this displays various statistics like properties of Capture file, flow graph, protocol hierarchy, IPv4 and IPv6 statistics etc.
8. Telephony Menu
Here you will find options to display several telephony-associated statistic windows like flow diagrams, display protocol hierarchy statistics etc.
9. Wireless Menu
This deals with the display of statistics related to Bluetooth and IEEE 802.11 standard.
10. Tools Menu
It contains several tools of Wireshark like creating Firewall ACL rules.
11. Help Menu
It basically provides help-related aspects like the link to help contents, manual pages, FAQs, Wireshark’s Wiki, and also links to sample capture etc.
The Main Toolbar
![]()
In simple words, Toolbar is actually a set of shortcuts of most used main Menu items. Once you are acquainted with Wireshark, you will quickly remember which icon is used for what.
The Filter Toolbar
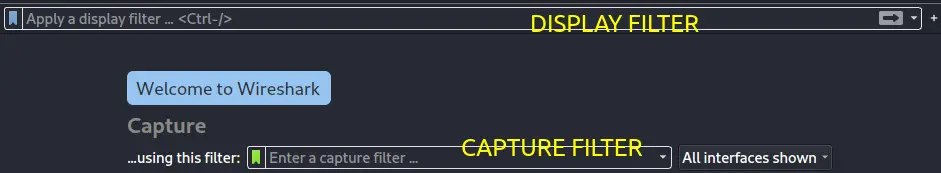
There are two filter toolbars: Display filter and Capture Filter. There is a difference between the two, however both are used to simplify your packet search.
Interfaces list
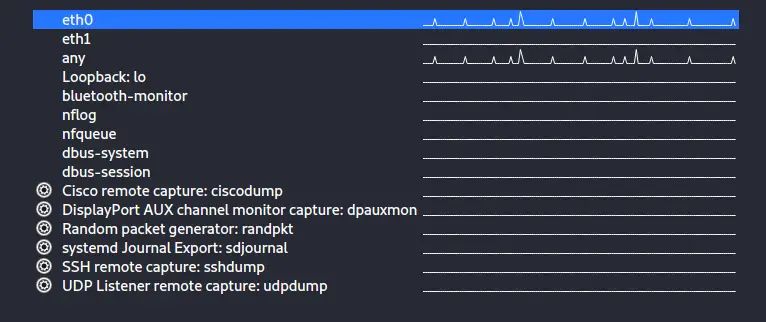
The start page of Wireshark lists all the available interfaces on your device for capture. If you do not see your interface here, go to ‘Capture > Refresh Interfaces’ or press ‘F5’ key to refresh the interface list. You can also manage the listing of the interface on the start page. For this select the drop-down menu on the right side of the capture filter search box.
Conclusion
In this guide, we have covered an overview of the Wireshark user interface. We have tried to cover only the important aspects because explaining every option is beyond the scope of this guide.

