
The EventHorizon Saga

This is an epic tale of EventHorizon, and how we finally got it to a happy place.
EventHorizon is a tool we use to watch events streaming into our system. Events (also known as beacons) are basically clickstream data—a record of actions visitors take on our site, what content they saw, what experiments they were bucketed into, etc.
Events are sent primarily from our web & API servers (backend events) and web browsers (frontend events), and logged in Kafka. EventHorizon is primarily used as a debugging tool, to make sure that a new event you’ve added is working as expected, but also serves to monitor the health of our event system.
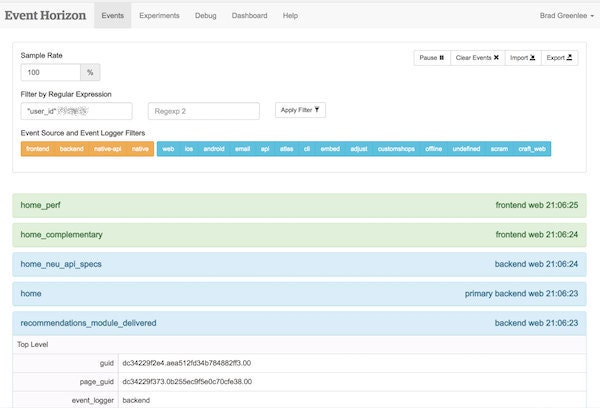
EventHorizon is pretty simple; it’s only around 200 lines of Go code. It consumes messages from our main event topic on Kafka ("beacon-main") and forwards them via WebSockets to any connected browsers. Ideally, the time between when an event is fired on the web site and when it appears in the EventHorizon UI is on the order of milliseconds.
EventHorizon has been around for years, and in the early days, everything was hunky-dory. But then, the lagging started.
Nobody Likes a Laggard
As with most services at Etsy, we have lots of metrics we monitor for EventHorizon. One of the critical ones is consumer lag, which is the age of the last message we’ve read from the beacon-main Kafka topic. This would normally be milliseconds, but occasionally it would start lagging into minutes or even hours.
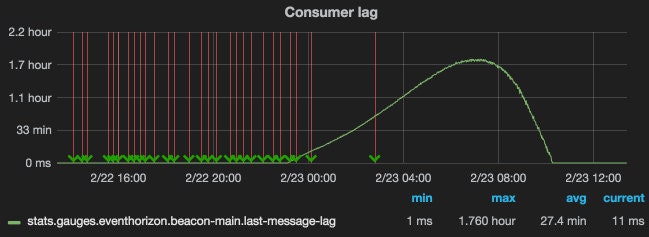
Sometimes it would recover on its own, but if not, restarting EventHorizon would often fix the problem, but only temporarily. Within anywhere from a few hours to a few weeks we’d notice lag time beginning to grow again.
We spent a lot of time pouring over EventHorizon’s code, thinking we had a bug somewhere. It makes use of Go’s channels—perhaps there was a subtle concurrency bug that was causing a deadlock? We fiddled with that, but it didn’t help.
We noticed that we could sometimes trigger the lag if two users connected to EventHorizon at the same time. This clue led us to think that there was a bug somewhere in the code that sent events to the browsers. Something with Websockets? We considered rewriting it to use Server-sent Events, but never got around to that.
We also wondered if the sheer quantity of events we were sending to browsers was causing the problem. We updated EventHorizon to only send events from Etsy employees to browsers in production. Alas, the lag didn’t go away—although seemed to have gotten a little better.
We eventually moved onto other things. We set up a Nagios alert for when EventHorizon started lagging, and just restarted it when it got bad. Since it would often be fine for 2-3 weeks before lagging, spending more time trying to fix it wasn't a top priority.
Orloj Joins the Fray
In September 2017 EventHorizon lag had gotten really bad. We would restart it and it would just start lagging again immediately. At some point we even turned off the Nagios alert.
However, another system, Orloj (pronounced "OR-loy", named after the Prague astronomical clock), had started experiencing lag as well. Orloj is another Kafka consumer, responsible for updating the Recently Viewed Listings that are shown on the homepage when are you are signed in. As Orloj is a production system, figuring out what was happening became much more urgent.
Orloj’s lag was a little different: lag would spike once an hour, whenever the Hadoop job that pulls beacons down from Kafka into HDFS ran, and at certain times of the day it would be quite significant.
It turned out that due to a misconfiguration, KafkaPullJob, which was only supposed to launch one mapper per Kafka partition (of which we have 144 for beacon-main), was actually launching 400 mappers, which was swamping the network. We fixed this, and Orloj was happy again.
For about a week.
Trouble with NICs
Orloj continued to have issues with lag. While digging into this, I realized that the machines in the Kafka clusters only had 1G network interfaces (NICs), whereas 10G NICs were standard in most of our infrastructure. I talked to our networking operations team to ask about upgrading the cluster and one of the engineers asked what was going on with one particular machine, kafkautil01. The network graph showed that its bandwidth was pegged at 100%, and had been for a while. kafkautil01 also had a 1G NIC. And that’s where EventHorizon ran.
A light bulb exploded over my head.
Relaying this info to Kevin Gessner, the engineer who wrote Orloj, he said “Oh yeah, consuming beacon-main requires at least 1.5 Gbps.” Suddenly it all made sense.
Beacon traffic fluctuates in proportion to Etsy site traffic, which is cyclical. Parts of the day were under 1 Gbps, parts over, and when it went over, EventHorizon couldn’t keep up and would start lagging. And we were going over more and more often as Etsy grew.
And remember the bit about two browsers connecting at once triggering lag? With EventHorizon forwarding the firehose of events to each browser, that was also a good way to push the network bandwidth over 1 Gbps, triggering lag.
We upgraded the Kafka clusters and the KafkaUtil boxes to 10G NICs and everything was fixed.No more lag!
Ha, just kidding.
Exploding Events
We did think it was fixed for a while, but EventHorizon and Orloj would both occasionally lag a bit, and it seemed to be happening more frequently.
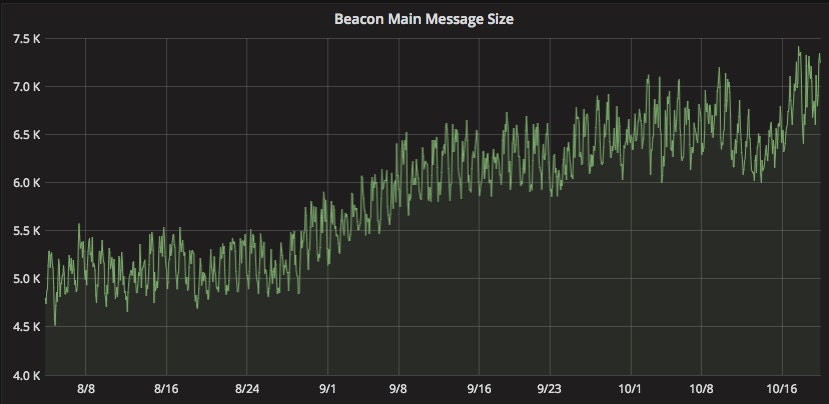
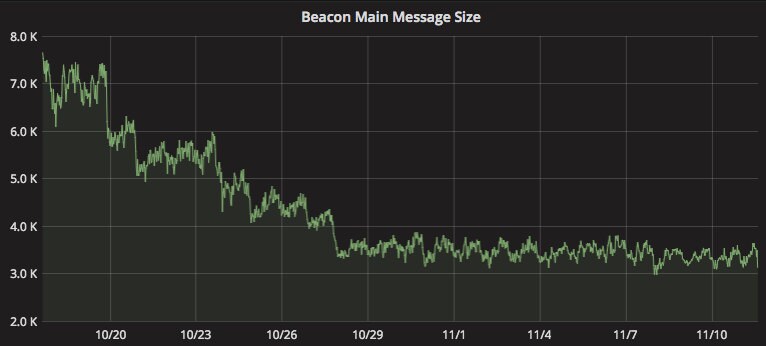
While digging into the continuing lag, we discovered that the size of events had grown considerably. Looking at a graph of event sizes, there was a noticeable uptick around the end of August.
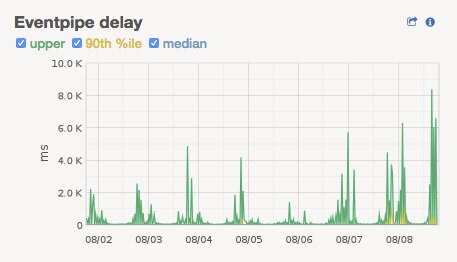
This tied into problems we were having with capacity in our Hadoop cluster—larger events mean longer processing times for nearly every job.
Inspecting event sizes showed some clear standouts. Four search events were responsible for a significant portion of all event bandwidth. The events were on the order of 50KB each, about 10x the size of a “normal” event. The culprit was some debugging information that had been added to the events.
The problem was compounded by something that has been part of our event pipeline since the beginning: we generate complementary frontend events for each backend primary event (a "primary event" is akin to a page view) to capture browser-specific data that is only available on the frontend, and we do it by first making a copy of the entire event and then adding the frontend attributes. Later, when we added events for tracking page performance metrics, we did the same thing. These complementary events don’t need all the custom attributes of the original, so this is a lot of wasted bandwidth. So we stopped doing that.
Between slimming down the search events, not copying attributes unnecessarily, and finding a few more events that could be trimmed down, we managed to bring down the average event size, as well as event volume, considerably.
Nevertheless, the lag persisted.
The Mysterious Partition 20
Orloj was still having problems, but this time it was a little different. The lag seemed to be happening only on a single partition, 20. We looked to see if the broker that was the leader for that partition was having any problems, and couldn’t see anything. We did see that it was serving a bit more traffic than other brokers, though.
The first thing that came to mind was a hot key. Beacons are partitioned by a randomly-generated string called a “browser_id” that is unique to a client (browser, native device, etc.) hitting our site. If there’s no browser_id, as is the case with internal API calls, it gets assigned to a random partition.
I used a command-line Kafka consumer to try to diagnose. It has an option for only reading from a single partition. Here I sampled 100,000 events from partitions 20 and 19:
Partition 20
$ go run cmds/consumer/consumer.go -ini-files config.ini,config-prod.ini -topic beacon-main -partition 20 -value-only -max 100000 | jq -r '[.browser_id[0:6],.user_agent] | @tsv' | sort | uniq -c | sort -rn | head -5
    558 orcIq5  Dalvik/2.1.0 (Linux; U; Android 7.0; SAMSUNG-SM-G935A Build/NRD90M) Mobile/1 EtsyInc/4.77.0 Android/1
    540 null    Api_Client_V3/Bespoke_Member_Neu_Orchestrator
    400 ArDkKf  Dalvik/2.1.0 (Linux; U; Android 8.0.0; Pixel XL Build/OPR3.170623.008) Mobile/1 EtsyInc/4.78.1 Android/1
    367 hK8GHc  Dalvik/2.1.0 (Linux; U; Android 7.0; SM-G950U Build/NRD90M) Mobile/1 EtsyInc/4.75.0 Android/1
    366 EYuogd  Dalvik/2.1.0 (Linux; U; Android 7.0; SM-G930V Build/NRD90M) Mobile/1 EtsyInc/4.77.0 Android/1
Partition 19
$ go run cmds/consumer/consumer.go -ini-files config.ini,config-prod.ini -topic beacon-main -partition 19 -value-only -max 100000 | jq -r '[.browser_id[0:6],.user_agent] | @tsv' | sort | uniq -c | sort -rn | head -5
    570 null    Api_Client_V3/Bespoke_Member_Neu_Orchestrator
    506 SkHj7N  Dalvik/2.1.0 (Linux; U; Android 7.0; LG-LS993 Build/NRD90U) Mobile/1 EtsyInc/4.78.1 Android/1
    421 Jc36zw  Dalvik/2.1.0 (Linux; U; Android 7.0; SM-G930V Build/NRD90M) Mobile/1 EtsyInc/4.78.1 Android/1
    390 A586SI  Dalvik/2.1.0 (Linux; U; Android 8.0.0; Pixel Build/OPR3.170623.008) Mobile/1 EtsyInc/4.78.1 Android/1
    385 _rD1Uj  Dalvik/2.1.0 (Linux; U; Android 7.0; SM-G935P Build/NRD90M) Mobile/1 EtsyInc/4.77.0 Android/1
I couldn’t see any pattern, but did notice we were getting a lot of events from the API with a null browser_id. These appeared to be distributed evenly across partitions, though.
We were seeing odd drops and spikes in the number of events going to partition 20, so I thought I’d see if I could just dump events around that time, so I started digging into our beacon consumer command-line tool to try to do that. In this process, I came across the big discovery: the -partition flag I had been relying on wasn’t actually hooked up to anything. So I was never consuming from a particular partition, but from all partitions. Once I fixed this, the problem was obvious:
Partition 20
$ go run cmds/consumer/consumer.go -ini-files config.ini,config-prod.ini -topic beacon-main -q -value-only -max 10000 -partition 20 | jq -r '[.browser_id[0:6],.user_agent] | @tsv' | sort | uniq -c | sort -nr | head -5
   8268 null    Api_Client_V3/Bespoke_Member_Neu_Orchestrator
    335 null    Api_Client_V3/BespokeEtsyApps_Public_Listings_Offerings_FindByVariations
    137 B70AD9  Mozilla/5.0 (iPhone; CPU iPhone OS 11_1_1 like Mac OS X) AppleWebKit/604.3.5 (KHTML, like Gecko) Mobile/15B150 EtsyInc/4.78 rv:47800.37.0
     95 C23BB0  Mozilla/5.0 (iPhone; CPU iPhone OS 10_3_3 like Mac OS X) AppleWebKit/603.3.8 (KHTML, like Gecko) Mobile/14G60 EtsyInc/4.78 rv:47800.37.0
     83 null    Api_Client_V3/Member_Carts_ApplyBestPromotions
and another partition for comparison:
$ go run cmds/consumer/consumer.go -ini-files config.ini,config-prod.ini -topic beacon-main -q -value-only -max 10000 -partition 0 | jq -r '[.browser_id[0:6],.user_agent] | @tsv' | sort | uniq -c | sort -nr | head -5
   1074 dtdTyz  Dalvik/2.1.0 (Linux; U; Android 7.0; VS987 Build/NRD90U) Mobile/1 EtsyInc/4.78.1 Android/1
    858 gFXUcb  Dalvik/2.1.0 (Linux; U; Android 7.0; XT1585 Build/NCK25.118-10.2) Mobile/1 EtsyInc/4.78.1 Android/1
    281 C380E3  Mozilla/5.0 (iPhone; CPU iPhone OS 11_0_3 like Mac OS X) AppleWebKit/604.1.38 (KHTML, like Gecko) Mobile/15A432 EtsyInc/4.77 rv:47700.64.0
    245 E0464A  Mozilla/5.0 (iPhone; CPU iPhone OS 11_0_3 like Mac OS X) AppleWebKit/604.1.38 (KHTML, like Gecko) Mobile/15A432 EtsyInc/4.78 rv:47800.37.0
    235 BAA599  Mozilla/5.0 (iPhone; CPU iPhone OS 11_0_3 like Mac OS X) AppleWebKit/604.1.38 (KHTML, like Gecko) Mobile/15A432 EtsyInc/4.78 rv:47800.37.0
All the null browser_ids were going to partition 20. But how could this be? They’re supposed to be random.
I bet a number of you are slapping your foreheads right now, just like I did. I wrote this test of the hashing algorithm: https://play.golang.org/p/MJpmoPATvO
Yes, the browser_ids I was thinking were null were actually the string “null”, which is what was getting sent in the JSON event. I put in a fix for this, and:
 Orloj Partition 20 Baumgartner
Lessons
I’m not going to attempt to draw any deep conclusions from this sordid affair, but I’ll close with some advice for when you find yourself with a persistent confounding problem like this one.
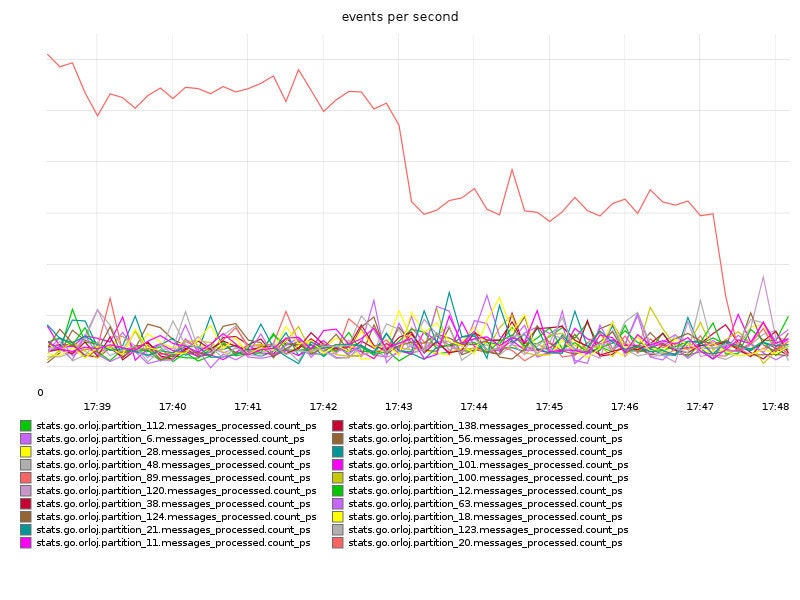
Graph everything. Then add some more graphs. Think about what new metrics might be helpful in diagnosing your issue. Kevin added the above graph showing Orloj events/sec by partition, which was critical to realizing there was a hot key issue.
If something makes no sense, think about what assumptions you’ve been making in diagnosing it, and check those assumptions. Kevin's graph didn't line up with what I was seeing, so I dug deeper into the command-line consumer and found the problem with the -partition flag.
Talk to people. Almost every small victory along the way came after talking with someone about the problem, and getting some crucial insight and perspective I was missing. Keep at it. As much as it can seem otherwise at times, computers are deterministic, and with persistence, smart colleagues, and maybe a bit of luck, you’ll figure it out.
Epilogue
On November 13 Cloudflare published a blog post on tuning garbage collection in Go. EventHorizon and Orloj both spent a considerable percentage of time (nearly 10%) doing garbage collection. By upping the GC threshold for both, we saw a massive performance improvement:
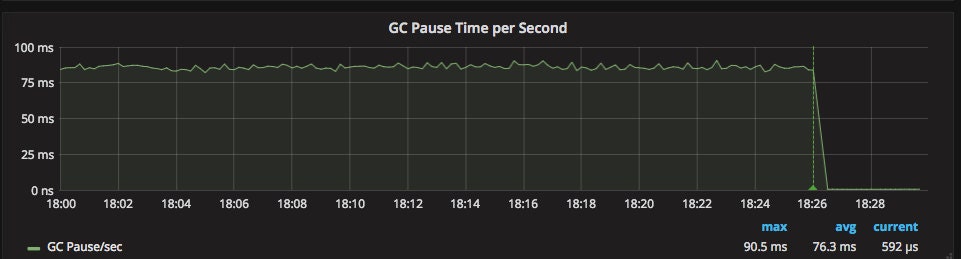
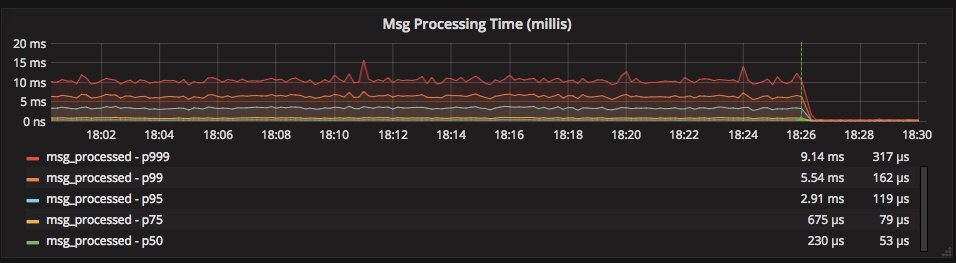
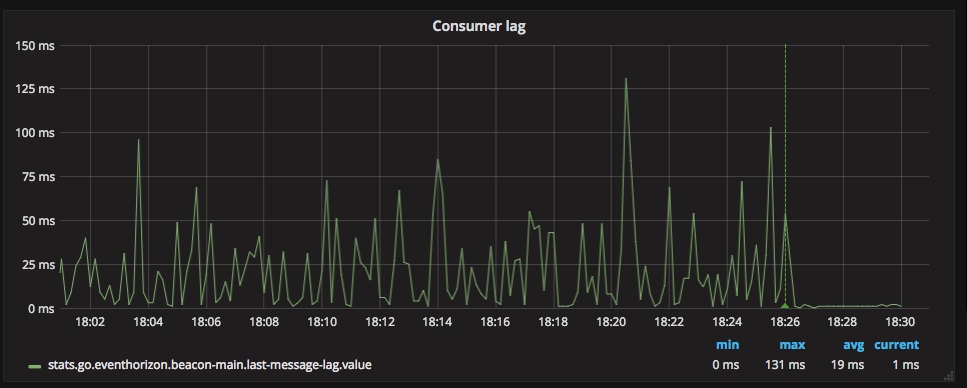
Except for a couple brief spikes during our last Kafka upgrade, EventHorizon hasn’t lagged for more than a second since that change, and the current average lag is 2 ms.
Thanks to Doug Hudson, Kevin Gessner, Patrick Cousins, Rebecca Sliter, Russ Taylor, and Sarah Marx for their feedback on this post. You can follow me on Twitter at @bgreenlee.