
This is Sato from the Developer Success team looking back at LINE DEVELOPER DAY 2021, which took place during November 10 to November 11 this year. I would like to thank every attendee and staff member who made the event possible. Due to COVID-19, this year's event was once again exclusively online. In this post, I'd like to take a look at some statistics relating to this year's event.
77 speakers from LINE and LINE group companies hosted 59 sessions over the course of two days for LINE DEVELOPER DAY 2021. In total, they've delivered 28 hours of content. Last year, we had 155 sessions divided into six tracks over the course of three days. Although the number of sessions decreased compared to last year, we've instead focused on putting more resources into each session to improve their quality, and also to reduce the amount of resources required from the speakers, support teams, and event operation teams.
We've archived each session's recordings and materials on YouTube and Speaker Deck respectively. You can also check the official LINE DEVELOPER DAY 2021 website for more information on each session. We have many interesting and high-quality sessions to share with you, so please have a look if you're interested.
Additionally, you can check out each session in text at logmi Tech. (Japanese only)
Event registration statistics
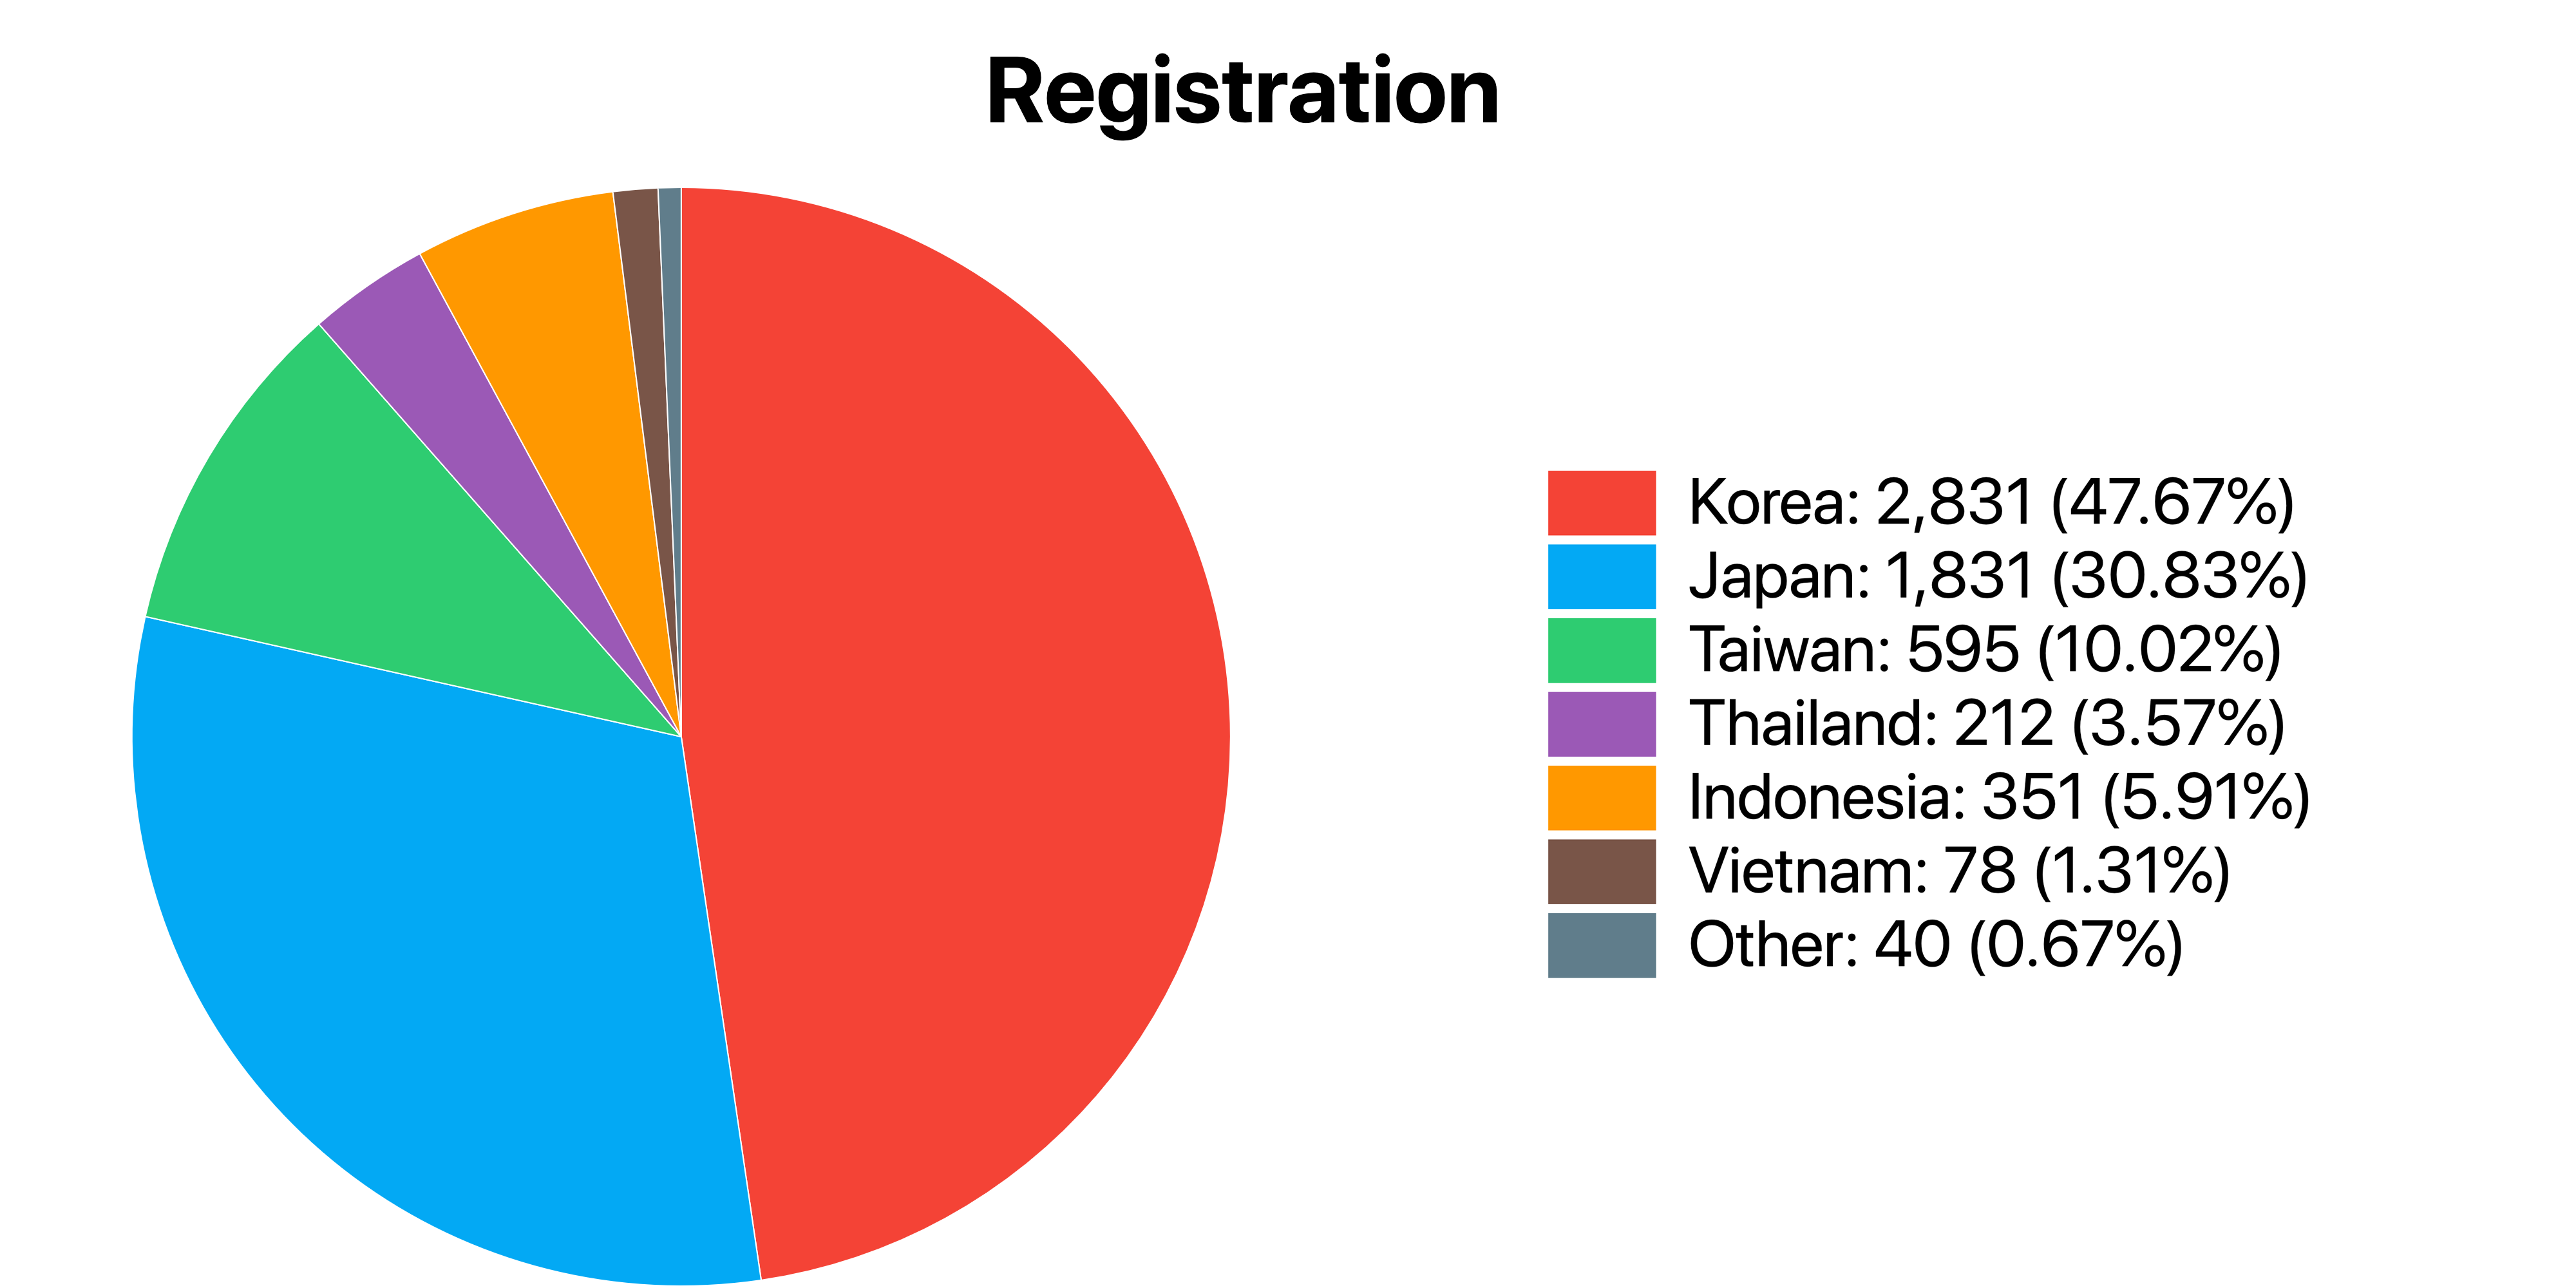
As of the end of the event on November 11, a total of 5,938 people have signed up for the event. When divided into regions, Korea had the most with 2,831 attendees (47.7%), followed by Japan with 1,831 attendees (30.8%). More details per region are below.
| Attendees | Ratio | |
|---|---|---|
| Korea | 2,831 | 47.67% |
| Japan | 1,831 | 30.83% |
| Taiwan | 595 | 10.02% |
| Thailand | 212 | 3.57% |
| Indonesia | 351 | 5.91% |
| Vietnam | 78 | 1.31% |
| Other | 40 | 0.67% |
| Total | 5,938 | - |
The total number of attendees saw a decrease from last year's 9,980 to 5,938. Last year was the very first time that LINE DEVELOPER DAY was taken online and promoted outside Japan, which lead to a lower barrier of entry and a huge influx of registrations that well exceeded our expectations. We saw this year's decrease in number of attendees as a stabilization of interest towards the online format. Worthy of note for this year was the fact that Korean attendees saw an increase from 1,980 to 2,831 due to Korean interpretation being made available for the official website and also every session.
Next, let's take a look at some details gathered from our attendees.
Attendee occupations
We had 1,822 server side engineers (30.69%) who signed up for the event, followed by 684 students (11.52%), and 664 frontend engineers (11.18%).
| Occupation | Attendees | Ratio | Occupation | Attendees | Ratio |
|---|---|---|---|---|---|
| Server Side Engineer | 1,822 | 30.69% | Data Scientist | 131 | 2.21% |
| Student | 684 | 11.52% | Marketing/PR | 91 | 1.53% |
| Frontend Engineer | 664 | 11.18% | Security Engineer | 75 | 1.26% |
| Other | 378 | 6.37% | IT Consultant | 71 | 1.20% |
| Android Engineer | 259 | 4.36% | Site Reliability Engineer | 67 | 1.13% |
| Data Engineer | 211 | 4.36% | Data Analyst | 63 | 1.06% |
| iOS Engineer | 246 | 4.14% | Designer | 63 | 1.06% |
| R&D | 172 | 2.90% | Software Engineer in Test | 30 | 0.51% |
| QA/Test Engineer | 171 | 2.88% | Support Engineer | 27 | 0.45% |
| Project Manager | 170 | 2.86% | Database Engineer | 21 | 0.35% |
| ML Engineer | 169 | 2.85% | Network Engineer | 20 | 0.34% |
| Product Manager | 165 | 2.78% | Sales Engineer | 20 | 0.34% |
| Infra Engineer | 135 | 2.27% | Hardware Engineer | 12 | 0.20% |
Interests
Attendee interests were ranked as follows.
| Rank | Category | Votes | Rank | Category | Rank |
|---|---|---|---|---|---|
| 1 | Server Side | 2,892 | 8 | Team & Process | 1,908 |
| 2 | AI | 2,632 | 9 | iOS/Android | 1,516 |
| 3 | Data | 2,620 | 10 | Security | 1,399 |
| 4 | Infrastructure | 2,129 | 11 | QA/Test | 1,376 |
| 5 | Developer Product | 2,066 | 12 | Blockchain | 1,292 |
| 6 | Machine Learning | 1,973 | 13 | OSS | 973 |
| 7 | Frontend | 1,944 | 14 | Corporate IT | 959 |
Bookmarks
Each attendee bookmarked 3.12 sessions on average. The top 10 sessions that were bookmarked are as follows.
Event attendance
The number of attendees (according to the number of unique visitors to the official website) was 22,685 across two days. A large increase compared to last year where we saw 15,116 attendees. Most of the attendees were focused in Japan and Korea. The sessions were open to those who haven't signed up or logged in to the website, and promotion on social media likely contributed to the number of actual attendees exceeding the number of those who signed up for the event. The details of attendee regions per day are as follows.
| Day 1 | Day 2 | Total | |
|---|---|---|---|
| Japan | 5,161 | 3,911 | 9,072 |
| Korea | 5,012 | 3,017 | 8,029 |
| Taiwan | 890 | 543 | 1,433 |
| Thailand | 665 | 381 | 1,036 |
| United States | 427 | 272 | 699 |
| Indonesia | 417 | 258 | 675 |
| Vietnam | 395 | 243 | 638 |
| Other | 642 | 451 | 1,093 |
| Total | 13,609 | 9,076 | 22,685 |
Next are the top 10 sessions with the most live viewers. The Opening Keynote delivered by LINE CTO Euivin Park was the most viewed session with 1,682 viewers. In general sessions that took place on day 1 had more live viewers.
Top 10 most viewed session during day 1
| Rank | Session title | Live viewers | Page views |
|---|---|---|---|
| 1 | Opening Keynote | 1,682 | 4,276 |
| 2 | HBase and Kafka data pipeline and applications for LINE Messaging Platform | 1,184 | 1,838 |
| 3 | LINT: Journey to Network Modernization with HTTP/2 and TLS | 1,040 | 1,733 |
| 4 | LINE Computer Vision Research: As Is and To Be | 652 | 1,028 |
| 5 | Outage Handling Process and Culture of the LINE Platform Server | 616 | 947 |
| 6 | Upgrading the Food Delivery Service Using Machine Learning | 594 | 808 |
| 7 | All We Need Is Prompting on a Pre-trained Japanese Large Language Model | 575 | 829 |
| 8 | Unification of Divided Data into Single Big Data Platform with 2000+ Nodes | 543 | 822 |
| 9 | PIPE: CI/CD + Runtime as a Service for Better Developer Experience | 532 | 719 |
| 10 | Adopting Apache Iceberg on LINE Data Platform | 491 | 743 |
Top 10 most viewed session during day 2
LINE Avatars
For this year's event, we prepared LINE Avatars for each of our speakers; which were prominently displayed on our session details and live introduction cards. All of our speakers customized their own avatars to their heart's content, making every avatar unique to themselves. We think this heavily contributed to making the event feel more casual and welcoming.


Survey results
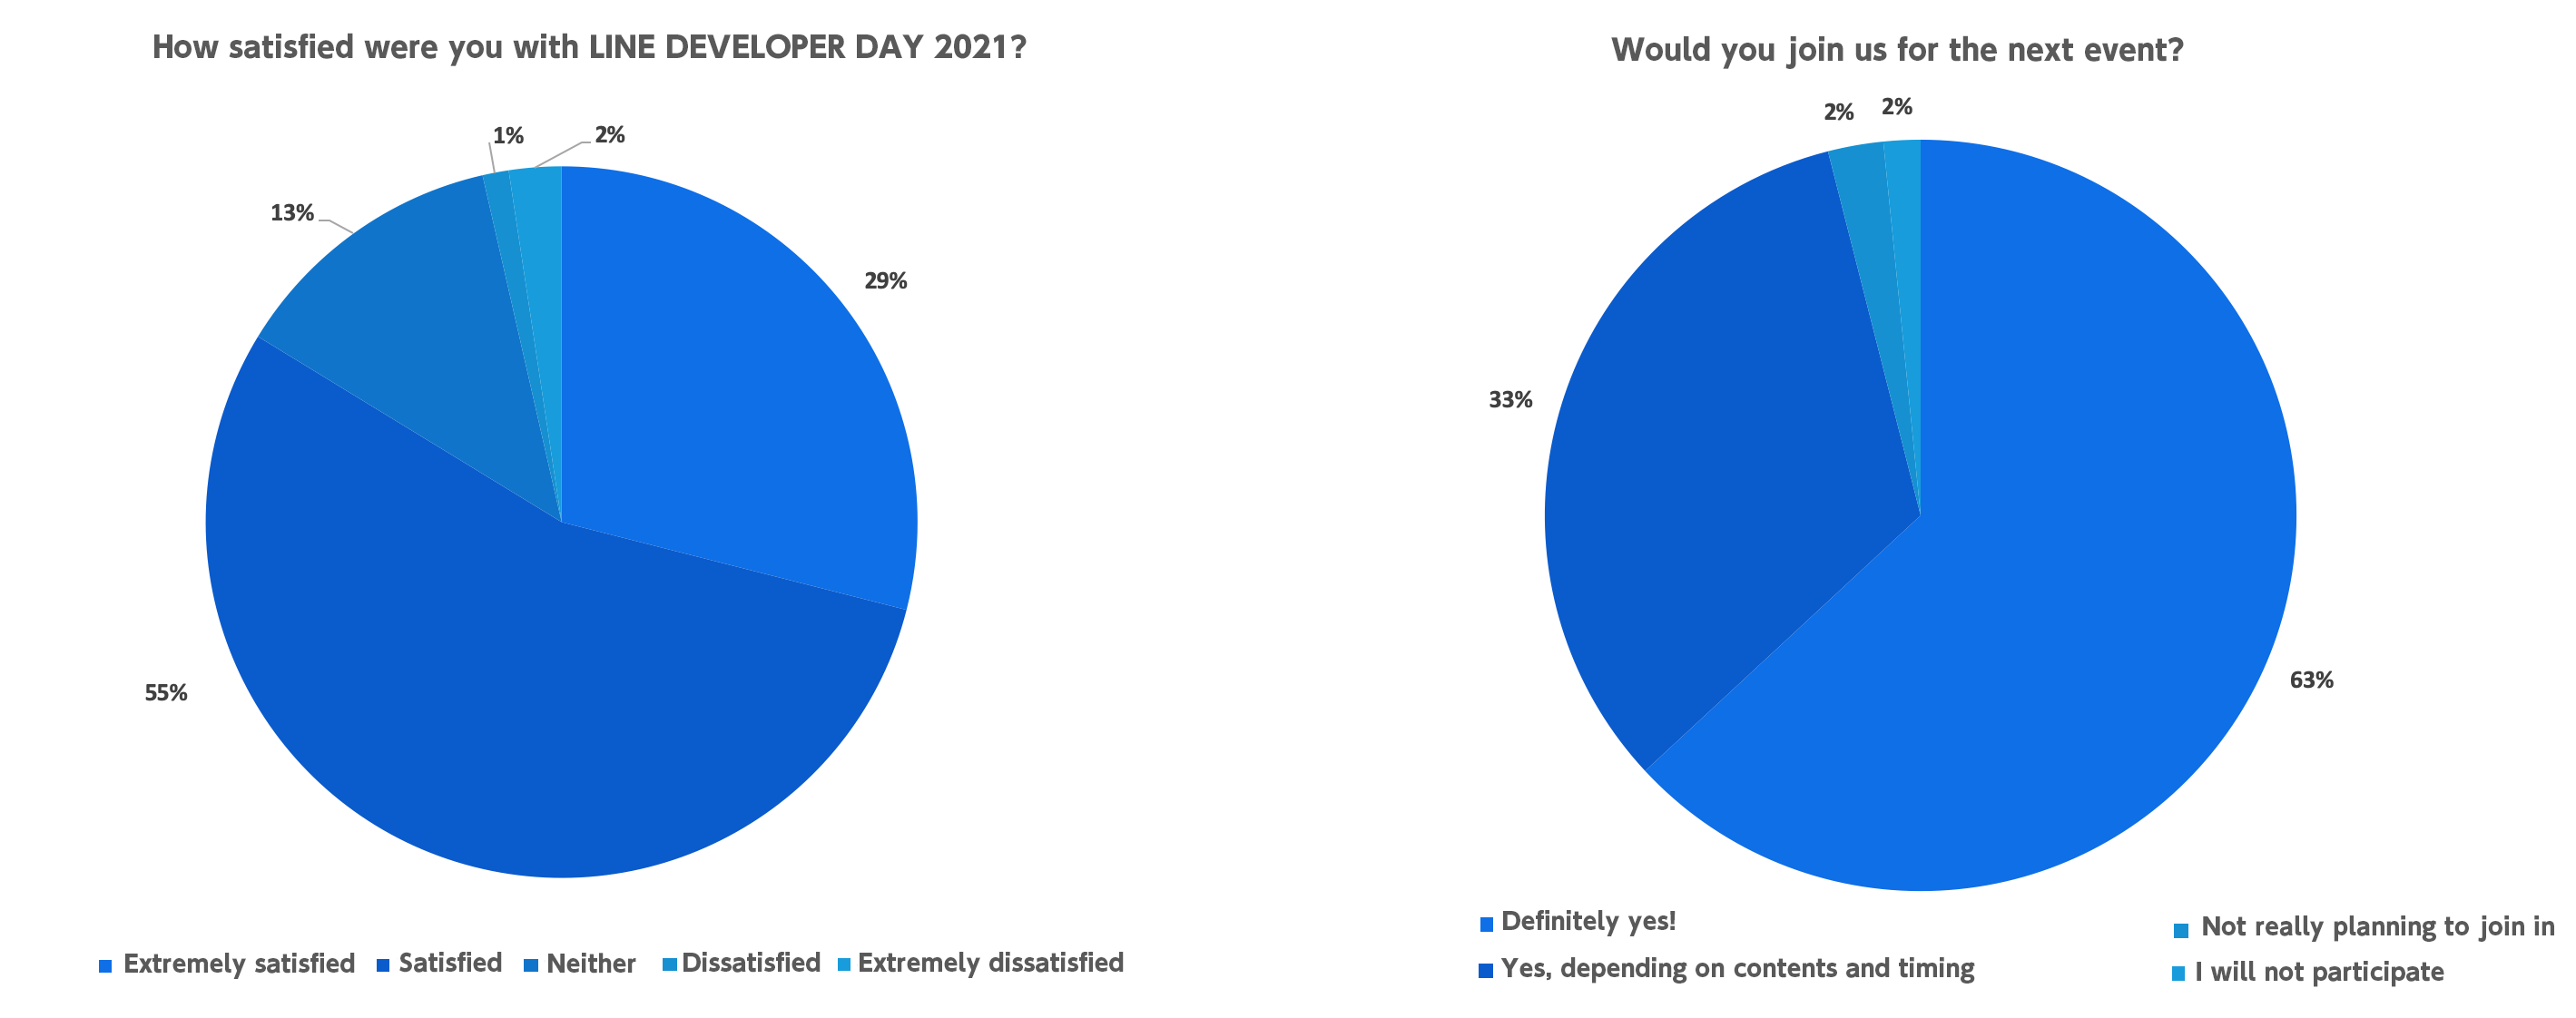
We asked participants to answer a survey asking about the event, and received 252 responses. We thank everyone who spent the time to answer the survey. To the question "How satisfied were you with LINE DEVELOPER DAY 2021?" received generally positive feedback with 73 people (26%) who answered "Extremely satisfied," 138 people (66%) who answered "Satisfied," 32 people (13%) who answered "Neither," 3 people (1%) who answered "Dissatisfied," and 6 people (2%) who answered "Extremely dissatisfied." When asked "Would you join us for the next event?" we also received generally positive feedback with 156 people (63%) who answered "Definitely yes!," 83 people (33%) who answered "Yes, depending on contents and timing," 6 people (2%) who answered "Not really planning to join in," and 4 people (2%) who answered "I will not participate."
Closing remarks
We were able to conclude this year's event without any issues, delivering high quality content to all of our attendees. While it wasn't one our priorities for this year, we plan to focus on more active attendee participation and enjoyable viewing experiences for future events. We promise that we will put all of our effort into providing a meaningful experience for those who are presenting, attending, and running the event going forward.
That concludes this retrospective report on LINE DEVELOPER DAY 2021. We would like to once again thank all of you who have attended the event and watched the videos.