

 Recently we published the first part of research comparing Graviton (ARM) with AMD and Intel CPU on AWS. In the first part, we selected general-purpose EC2 instances with the same configurations (amount of vCPU). The main goal was to see the trend and make a general comparison of CPU types on the AWS platform only for MySQL. We didn’t set the goal to compare the performance of different CPU types. Our expertise is in MySQL performance tuning. We share research “as is” with all scripts, and anyone interested could rerun and reproduce it.
All scripts, raw logs and additional plots are available on GitHub: (2021_10_arm_cpu_comparison_c5, csv_file_with_all_data).
We were happy to see the reactions from our Percona Blog readers to our research, and we are open to any feedback. If anyone has any ideas on updating our methodology, we would be happy to correct it.
This post is a continuation of research based on our interest in compute-optimized EC2 (and, of course, because we saw that our audience wanted to see it). Today, we will talk about (AWS) Compute Optimized EC2: C5, C5a, C6g (complete list in appendix).
Next time we are going to share our findings on the economic efficiency of m5 and c5 instances.
Short Conclusion:
- In most cases for c5, c5a, and c6g instances, Intel shows better performance in throughput for MySQL read transactions.
- Sometimes Intel could show a significant advantage — more than almost 100k rps than other CPUs.
- If we could say in a few words: c5 instances (with Intel) are better in their class than other c5a, c6g instances (in performance). And this advantage starts from 5% and could be up to 40% compared with other CPUs.
Details and Disclaimer:
- Tests were run on C5.* (Intel) , C5a.* (AMD), C6g.*(Graviton) EC2 instances in the US-EAST-1 region. (List of EC2 see in the appendix.)
- Monitoring was done with PMM
- OS: Ubuntu 20.04 TLS
- Load tool (sysbench) and target DB (MySQL) installed on the same EC2 instance.
- Oracle MySQL Community Server — 8.0.26-0 — installed from official packages.
- Load tool: sysbench — 1.0.18
- innodb_buffer_pool_size=80% of available RAM
- Test duration is 5 minutes for each thread and then 90 seconds warm down before the next iteration.
- Tests were run 3 times (to smooth outliers / to have more reproducible results). Then results were averaged for graphs.
- We are going to use a “high-concurrency” scenario definition for scenarios when the number of threads would be bigger than the number of vCPU. And “low-concurrent” scenario definition with scenarios where the number of threads would be less or equal to a number of vCPU on EC2.
- We are comparing MySQL behavior on the same class of EC2, not CPU performance.
Test Case:
Prerequisite:
1. Create DB with 10 tables with 10 000 000 rows each table
1 | sysbench oltp_read_only --threads=10 --mysql-user=sbtest --mysql-password=sbtest --table-size=10000000 --tables=10 --db-driver=mysql --mysql-db=sbtest prepare |
2. Load all data to LOAD_buffer
1 | sysbench oltp_read_only --time=300 --threads=10 --table-size=1000000 --mysql-user=sbtest --mysql-password=sbtest --db-driver=mysql --mysql-db=sbtest run |
3. Test:
Run in a loop for same scenario but different concurrency THREAD (1,2,4,8,16,32,64,128) on each EC2
1 | sysbench oltp_read_only --time=300 --threads=${THREAD} --table-size=100000 --mysql-user=sbtest --mysql-password=sbtest --db-driver=mysql --mysql-db=sbtest run |
Results:
Result reviewing was split into three parts:
- For “small” EC2 with 2, 4, and 8 vCPU
- For “medium” EC2 with 16 and for “large” EC2 with 48 and 64 vCPU (AWS does not have C5 EC2 with 64 vCPU )
- For all scenarios to see the overall picture.
There would be four graphs for each test:
- Throughput (queries per second) that EC2 could perform for each scenario (amount of threads).
- Latency 95 percentile that EC2 could perform for each scenario (amount of threads).
- Relative comparing Graviton and Intel, Graviton, and AMD.
- Absolute comparing Graviton and Intel, Graviton, and AMD.
Validation that all load goes to CPU, not to DISK I/O, was done also using PMM (Percona Monitoring and Management).

pic 0.1. OS monitoring during all test stages (picture is for example)
Result for EC2 with 2, 4, and 8 vCPU:

plot 1.1. Throughput (queries per second) for EC2 with 2, 4 and 8 vCPU for scenarios with 1,2,4,8,16,32,64,128 threads

plot 1.2. Latencies (95 percentile) during the test for EC2 with 2, 4 and 8 vCPU for scenarios with 1,2,4,8,16,32,64,128 threads

plot 1.3.1 Percentage comparison Graviton and Intel CPU in throughput (queries per second) for EC2 with 2, 4 and 8 vCPU for scenarios with 1,2,4,8,16,32,64,128 threads

plot 1.3.2 Percentage comparison Graviton and AMD CPU in throughput (queries per second) for EC2 with 2, 4 and 8 vCPU for scenarios with 1,2,4,8,16,32,64,128 threads

plot 1.4.1. Numbers comparison Graviton and Intel CPU in throughput (queries per second) for EC2 with 2, 4 and 8 vCPU for scenarios with 1,2,4,8,16,32,64,128 threads

plot 1.4.2. Numbers comparison Graviton and Intel CPU in throughput (queries per second) for EC2 with 2, 4 and 8 vCPU for scenarios with 1,2,4,8,16,32,64,128 threads
OVERVIEW:
- Based on plot 1.1, we could say that EC2 with Intel has an absolute advantage compared with Graviton and AMD.
- This advantage in most scenarios fluctuates between 10% – 20%.
- In numbers, it is over 3,000 requests per second.
- There is one scenario when Graviton becomes better EC2 with 8 vCPU (c6g.2xlarge). But the advantage is so tiny (near 2%) that it could be a statistical error. So we can’t say that benefits are relevant.
Result for EC2 with 16, 48 and 64 vCPU:
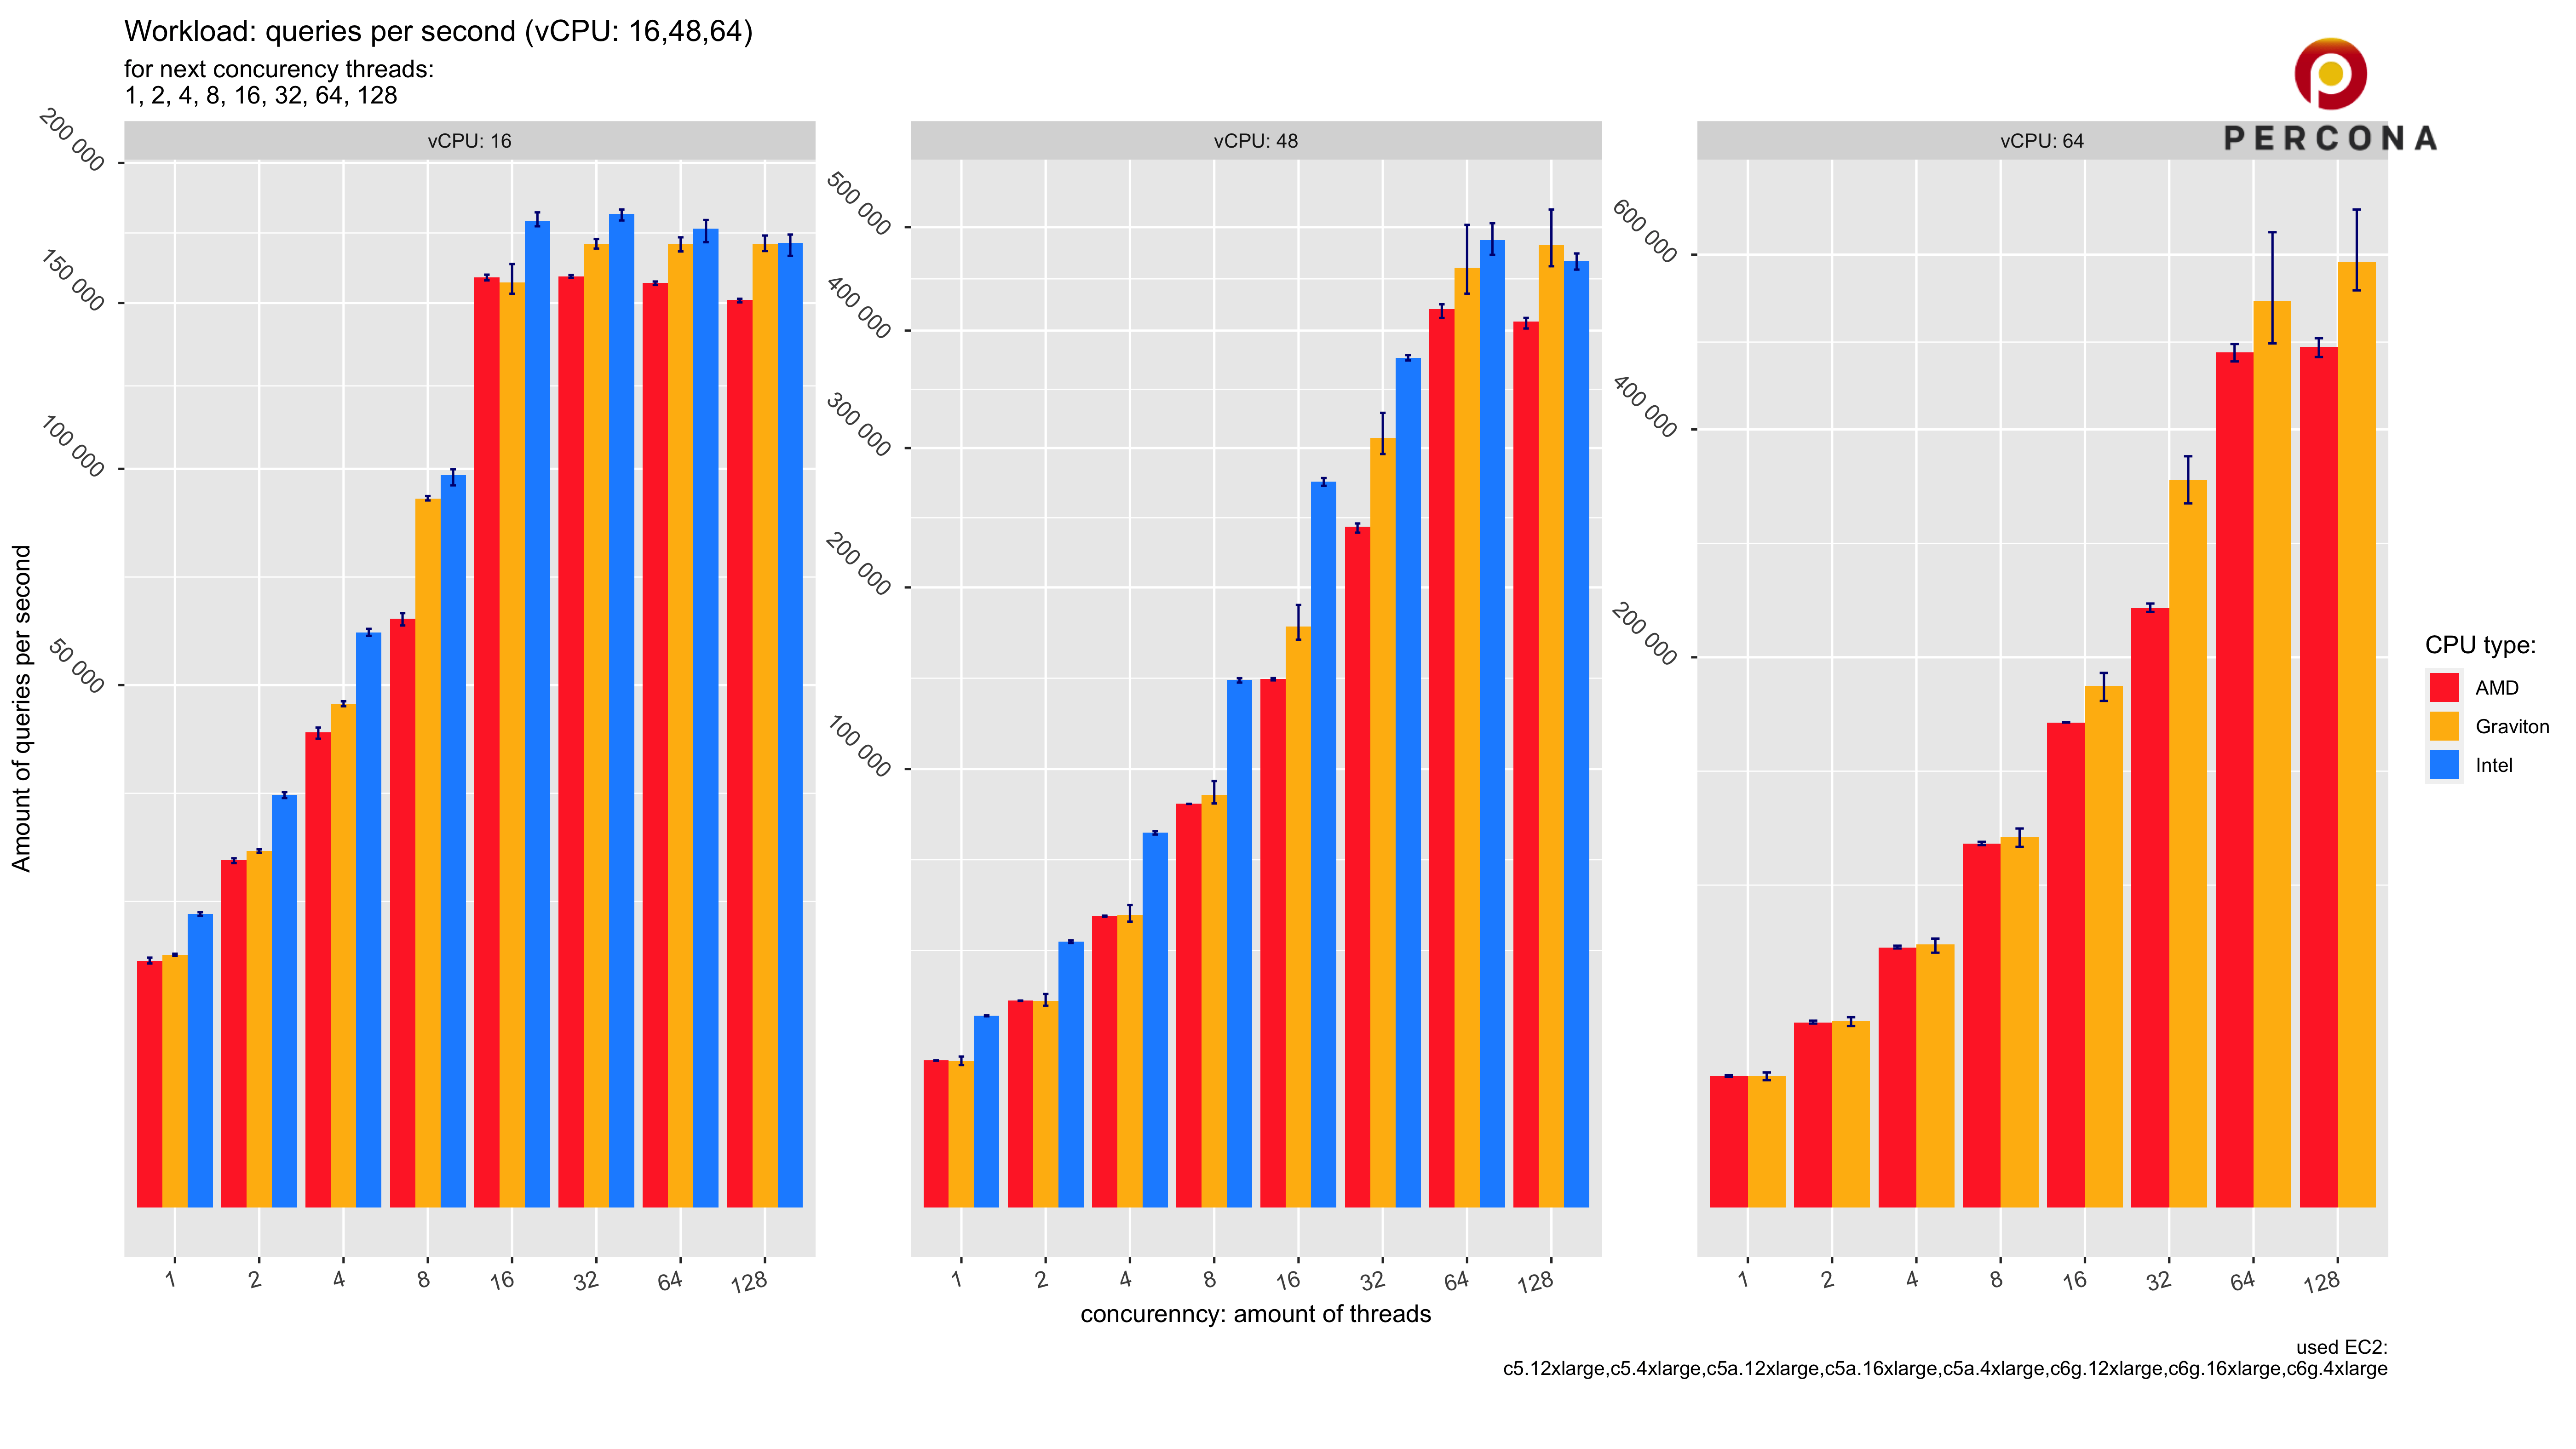
plot 2.1. Throughput (queries per second) for EC2 with 16, 48 and 64 vCPU for scenarios with 1,2,4,8,16,32,64,128 threads

plot 2.2. Latencies (95 percentile) during the test for EC2 with 16, 48 and 64 vCPU for scenarios with 1,2 4,8,16,32,64,128 threads

plot 2.3.1 Percentage comparison Graviton and Intel CPU in throughput (queries per second) for EC2 with 16, 48 vCPU for scenarios with 1,2,4,8,16,32,64,128 threads

plot 2.3.2 Percentage comparison Graviton and AMD CPU in throughput (queries per second) for EC2 with 16, 48 and 64 vCPU for scenarios with 1,2,4,8,16,32,64,128 threads

plot 2.4.1. Numbers comparison Graviton and Intel CPU in throughput (queries per second) for EC2 with 16, 48 vCPU for scenarios with 1,2,4,8,16,32,64,128 threads

plot 2.4.2. Numbers comparison Graviton and AMD CPU in throughput (queries per second) for EC2 with 16, 48 and 64 vCPU for scenarios with 1,2,4,8,16,32,64,128 threads
OVERVIEW:
- Plot 2.1 shows that it has an advantage over the other vCPU in our conditions (there are no EC2 with 64 Intel’s vCPU to have a full picture of comparison).
- This advantage could be near 20% for EC2 with 16 vCPU and up to 40% for EC2 with 48 vCPU. However, it is possible to see that this advantage decreases with an increasing amount of threads.
- In real numbers, Intel could execute up to 100 k read transactions more than other CPUs (plot 2.1. , plot 2.4.1).
- On the other hand, in one high-performance scenario, we could see a small advantage (3%) of Graviton. However, it is so small that it could be a statistical error again (plot 2.3.1.).
- In most cases, Graviton shows better results than AMD (plot 2.1, plot 2.3.2, plot 2.4.2).
Whole Result Overview:

plot 3.1. Throughput (queries per second) for EC2 with 2, 4, 8, 16, 48 and 64 vCPU for scenarios with 1,2,4,8,16,32,64,128 threads

plot 3.2. Latencies (95 percentile) during the test for EC2 with 2, 4, 8, 16, 48 and 64 vCPU for scenarios with 1,2,4,8,16,32,64,128 threads

plot 3.3.1. Percentage comparison Graviton and Intel CPU in throughput (queries per second) for EC2 with 2, 4, 8, 16 and 48 vCPU for scenarios with 1,2,4,8,16,32,64,128 threads

plot 3.3.2. Percentage comparison Graviton and AMD CPU in throughput (queries per second) for EC2 with 2, 4, 8, 16, 48 and 64 vCPU for scenarios with 1,2,4,8,16,32,64,128 threads

plot 3.4.1. Numbers comparison Graviton and Intel CPU in throughput (queries per second) for EC2 with 2, 4, 8, 16 AND 48 vCPU for scenarios with 1,2,4,8,16,32,64,128 threads

plot 3.4.2. Numbers comparison Graviton and AMD CPU in throughput (queries per second) for EC2 with 2, 4, 8, 16, 48 and 64 vCPU for scenarios with 1,2,4,8,16,32,64,128 threads
Final Thoughts
- We compare compute-optimized ec2 (c5, c5a, c6g) instances from the AWS platform and their behavior for MySQL.
- It is still an open question regarding the economic efficiency of all this EC2. We will research this topic and answer this question a little bit later.
- In these tests, AMD does not provide any competitive results for MySQL. It is possible that in other tasks, it could show much better and competitive results.
APPENDIX:
List of EC2 used in research:
| CPU type | EC2 | Amount vCPU | Memory GB | EC2 price per hour (USD) |
| AMD | c5a.large | 2 | 4 | 0.077 |
| AMD | c5a.xlarge | 4 | 8 | 0.154 |
| AMD | c5a.2xlarge | 8 | 16 | 0.308 |
| AMD | c5a.4xlarge | 16 | 32 | 0.616 |
| AMD | c5a.12xlarge | 48 | 96 | 1.848 |
| AMD | c5a.16xlarge | 64 | 128 | 2.464 |
| Intel | c5.large | 2 | 4 | 0.085 |
| Intel | c5.xlarge | 4 | 8 | 0.170 |
| Intel | c5.2xlarge | 8 | 16 | 0.340 |
| Intel | c5.4xlarge | 16 | 32 | 0.680 |
| Intel | c5.12xlarge | 48 | 96 | 2.040 |
| Graviton | c6g.large | 2 | 4 | 0.068 |
| Graviton | c6g.xlarge | 4 | 8 | 0.136 |
| Graviton | c6g.2xlarge | 8 | 16 | 0.272 |
| Graviton | c6g.4xlarge | 16 | 32 | 0.544 |
| Graviton | c6g.12xlarge | 48 | 96 | 1.632 |
| Graviton | c6g.16xlarge | 64 | 128 | 2.176 |
my.cnf:
1 2 3 4 5 6 7 8 9 10 11 12 13 14 15 16 17 18 19 20 21 22 23 24 25 26 27 28 29 30 31 32 33 34 35 36 37 | [mysqld] ssl=0 performance_schema=OFF skip_log_bin server_id = 7 # general table_open_cache = 200000 table_open_cache_instances=64 back_log=3500 max_connections=4000 join_buffer_size=256K sort_buffer_size=256K # files innodb_file_per_table innodb_log_file_size=2G innodb_log_files_in_group=2 innodb_open_files=4000 # buffers innodb_buffer_pool_size=${80%_OF_RAM} innodb_buffer_pool_instances=8 innodb_page_cleaners=8 innodb_log_buffer_size=64M default_storage_engine=InnoDB innodb_flush_log_at_trx_commit = 1 innodb_doublewrite= 1 innodb_flush_method= O_DIRECT innodb_file_per_table= 1 innodb_io_capacity=2000 innodb_io_capacity_max=4000 innodb_flush_neighbors=0 max_prepared_stmt_count=1000000 bind_address = 0.0.0.0 [client] |


Hi Nik,
thanks for sharing results 🙂
I believe would be worth to perform tests running with BottleRocket OS or Amazon Linux 2,
optimized for AWS infrastructure.
Could you please share list of packages
Ubuntu 20 LTS generic kernel likely has been optimized for Intel and AMD, not Graviton 2.
Also link to github is broken, should be
https://github.com/Percona-Lab-results/2021_10_arm_cpu_comparison
link on the top is right
https://github.com/Percona-Lab-results/2021_10_arm_cpu_comparison_c5.
we run 2 researches for m5 and for c5 instances.
I think, in next iteration we would also compare same scenarios but for not-optimized Ubuntu and other optimized OS.
list of packages you could find on github
https://github.com/Percona-Lab-results/2021_10_arm_cpu_comparison_c5/tree/main/test_scripts/analysis
Thank you!
I hope to see RDS performance, Intel vs Graviton, in your next posts…
Vitaly