Introduction
We are all aware of the advantages of DevOps in the software development lifecycle (SDLC). It continuously assesses the SDLC to provide high-quality software in a distributed computing and orchestration environment.
There are a lot of different solutions available for DevOps engineers to minimize their manual tasks in their day to day work. These solutions help in troubleshooting and monitoring Kubernetes and its resources by automating these processes. Thus, IT teams can refine their teamwork and save time, effort, and money.
Let us discuss some tools here that add more power to the Kubernetes.
Komodor
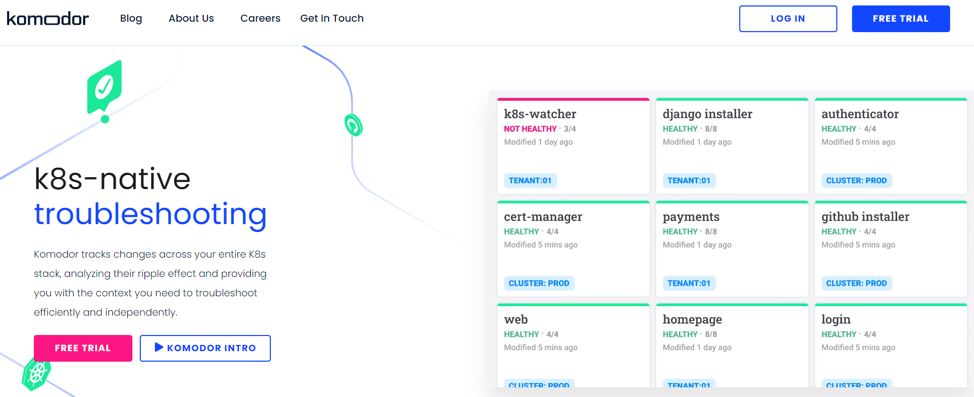
Komodor is a one-stop solution for all your Kubernetes troubleshooting work. It’s the missing link in your DevOps toolkit, providing a unified platform from which you can acquire a comprehensive view of all of your systems, as well as the changes made and their consequences.
It presents a unified view of important installations, configuration changes, and alarms. As a result, you’ll be able to find blind places that would otherwise be impossible to find. You’ll also get the full timeline, which includes code and configuration changes, deployments, and alarms.
Since environment dependencies are constantly changing in Kubernetes, Komodor helps you understand how the changing dependencies are going to affect your system as a whole. You can integrate it with Slack to get alerts in real-time. You can also view your data from your Git or Infra, which makes the data centralized and easy to display and understand.
Helm
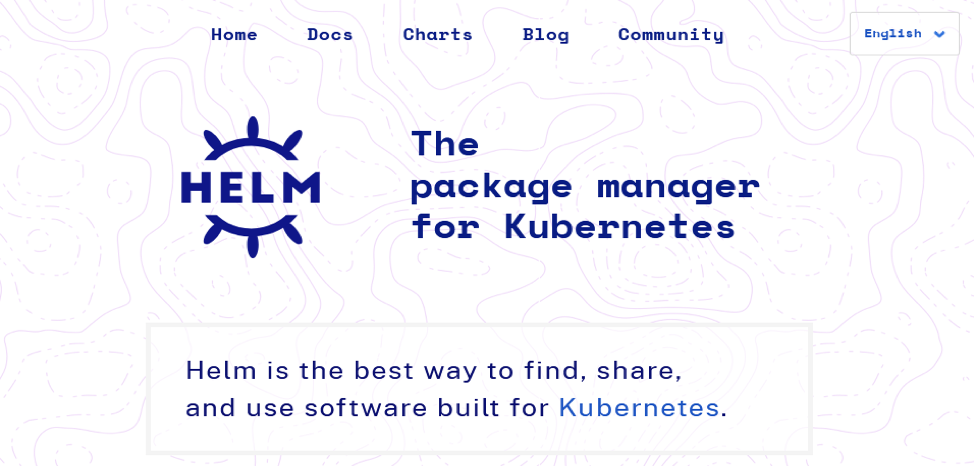
Kubernetes works in clusters that seem to be a single resource but are a set of independent nodes with multiple services connected to them. Helm is a complete packet manager that easily deploys applications in the Kubernetes cluster. Helm works by taking applications that are repeatable in the Kubernetes environment or may be used in different environments and deploys them.
It provides a chart-type user interface that is easy to understand. These charts are known as Helm Charts. On these, the Kubernetes administrator can see all their running applications. These charts can be shared publicly or privately on the servers.
If a wrong command is given to the servers, Helm provides the easy rollback functionality. With a single command, users can revert all the changes. It has an upgrade functionality also where administrators can customize Helm as per their needs. Helm has many functionalities that improve developer productivity and operational readiness.
Kubewatch
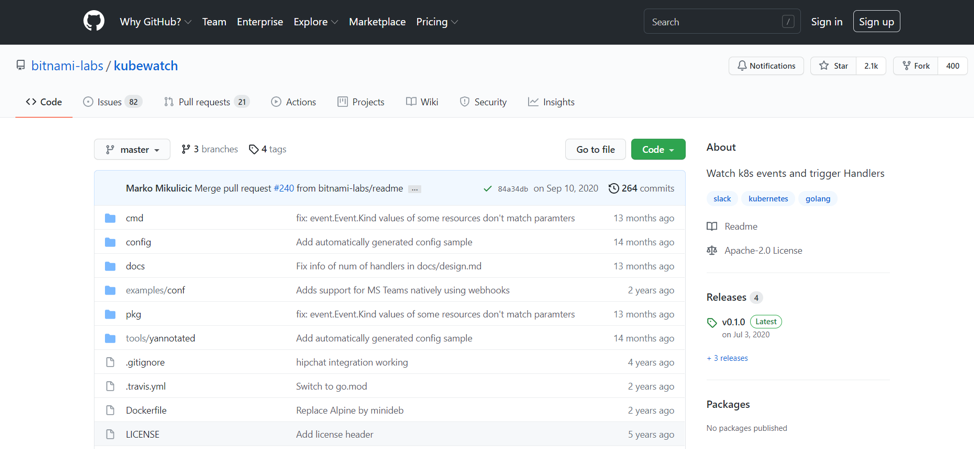
Kubewatch is an open source tool written in Golang that provides Kubernetes notifications. Notifications can be received through a Slack channel, webhook, Mattermost, or a configured SMTP. Its basic task is to monitor your Kubernetes resources. Then, if there are any changes in the resources, Kubewatch will notify the registered user.
It can be installed easily with a kubectl command or by using Helm charts. It provides a friendly interface so novice users can work with it too. It has a ConfigMap file where the administrator can set the visibility of Kubernetes’ resources.
As soon as the administrator sets the resource to True in the ConfigMap file, it will start sending notifications to the registered user so that the administrator can also set which resource they want to monitor. This is a simple YAML file where the admin can select resources, such as daemon sets, deployments, pods, services, replication controller, etc.
Gitkube
When an end-user wants to deploy Docker images on Kubernetes, they can use Gitkube. It uses GIT push for the deployment of ideas, which is very easy to install. It provides a GIT remote URL for upgrading or updating the Kubernetes resources.
Gitkube can build the Docker image when the source code and Dockerfile are pushed to this GIT remote. It not only builds the image but also updates the Kubernetes deployment with a new image. It does not require any CLI or local Docker for performing tasks. It can provide role-based access control to the user, and users can authenticate themselves with the help of a public key.
To install it, the admin only needs Kubectl and GIT. It has three main components:
i. Remote: It consists of all the custom resources that are managed by Gitkube-controller.
ii. Gitkube-controller: If any changes are made to the setup of Remote, it will send them to Gitkubed.
iii. Gitkubed: It monitors the changes sent by Gitkube-controller. It builds the Docker image on that basis and then deploys that image.
Prometheus
The Prometheus tool is also used for monitoring Kubernetes. This was developed by SoundCloud, and CNCF performed its development thereafter. It is used to store data but as a time series. Users and Kubernetes administrators can fetch that data via the PromQL query language. Users can see it on the built-in expression browser also.
Other Kubernetes tools, such as Kubernetes Ecosystem, use it as a built-in adapter to provide generated metrics. It’s easy to install, and the installation only needs a Docker container or your host. Prometheus Operator also helps a lot in running or fetching desired output from Prometheus. Prometheus Operator helps in the native deployment of Kubernetes, in the management of Kubernetes, and in monitoring related components.
Conclusion
DevOps tools play a significant role in the success of DevOps administrators. We discussed some good troubleshooting tools for Kubernetes. They are all great tools. However, the ultimate choice you make will depend on your business needs. Select a tool that provides a good amount of monitoring and stats for your Kubernetes resources. Some tools on this list also help with management and troubleshooting. I hope this article has helped you choose which one you want to use.