What is an OLAP Cube? An Exhaustive Explainer
The definitive explainer for OLAP cubes, where we cover every single possible definition for the phrase.

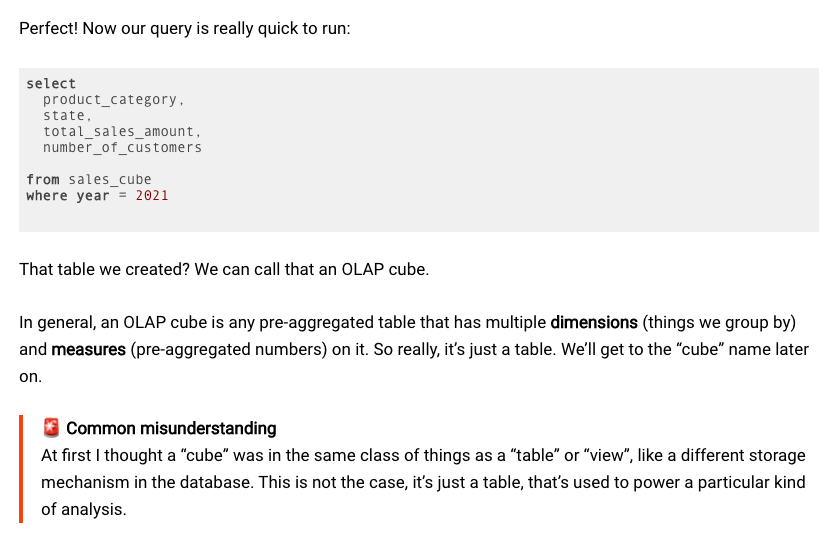
It’s 2021 and I guess we should settle this once and for all.
Last week I wrote a piece about reading data papers. I said that this was a good way to understand foundational data concepts as a beginner, especially when you can’t find a good explanation on the web.
That wasn’t an accident.
Two weeks ago, I read a piece titled What’s an OLAP Cube by Claire Carroll, and then proceeded to get rather confused. Carroll basically argued that pre-aggregated tables are an OLAP cube, and that also OLAP cubes were ‘just a table’, not ‘a different storage mechanism in the database’, and that it is very bad that we have complicated jargon as a gatekeeper, and that this is Not Good because it keeps out new people and makes everyone very confused.
I thought: “I can find other usages of the term” and also, on jargon as a gatekeeper: “well, that’s one way of looking at it.” A different way of looking at it is that etymology is a thing, and that names can mean different things to different people depending on how events play out in history.
For instance: Judo is an Olympic combat sport where fighters throw each other and sometimes grapple on the ground. Judo is descended from Jujitsu, which was a martial art developed for close combat in feudal Japan. But today, Jujitsu also refers to ‘Brazilian Jujitsu’, which is a modern sport that mostly sees players fighting on the ground. Why the confusion? The short answer is that some of the earliest Judo students went to Brazil, called their art ‘Kano’s Jujitsu’ instead of ‘Judo’ (because they hadn’t read the memo or something), and then the locals said “Ahh! Jujitsu! Ok we’ll learn it from you and call it that!” and it became ‘Brazilian Jujitsu’. Much later the UFC became hugely popular in the US, causing BJJ to rise in popularity along with it; people started saying ‘Jujitsu’ instead of ‘Brazilian Jujitsu’ because ‘Brazilian Jujitsu’ is frankly a mouthful to say, and anyway now Jujitsu means two different things and Judo is descended from one but not the other and that’s how we ended up with this confusing sorry mess. (And you may read more about this confusing story in Wikipedia here).
Something similar has almost certainly happened with OLAP Cubes. As far as I can tell, over the past 30 years, OLAP cubes have meant:
- A type of user interface for browsing data
- A type of data structure that may be called an ‘aggregation table’ (Or, more accurately, a view of data within a relational database (Gray, Bosworth, Lyaman & Pirahesh, 1995))
- A highly optimised data structure/data engine that serves as an alternative product to databases and data warehouses.
- Or just … OLAP; sometimes people conflate OLAP and OLAP cube together, which is … sigh.
It’s safe to say that OLAP cubes are confusing. Carroll’s blog post asserts that OLAP cubes are simply a ‘type of table’. This is correct depending on the definition you buy (and depending on the definition of OLAP you want to stick to).
But if you buy only this definition, you will be incredibly confused when you are approached by an OLAP cube provider like Kyligence (which provides support for the open source OLAP cube product Kylin), or when you hear older data folk talk about their experience with Cognos cubes, or when you stumble across Microsoft’s Multidimensional Expressions (MDX) language, which was a query language that was designed for OLAP cubes.
So let’s settle this once and for all.
I said in my previous post that one way of cutting through the bullshit is to read the academic papers. I argued that academic papers are a relatively trustworthy source of information, because a) papers are usually peer reviewed, which means going through a nitpicky and annoying process that forces paper writing to be precise, and that b) researchers are usually writing for an audience of their peers, not programmers or analysts or data marketing folk. This in turn means they are incentivised to speak plainly, and not look like fools.
This essay will explain — with citations from academic papers whenever possible — what an OLAP cube is, and how the definitions have drifted over the years.
(Note: you may also read this as a howto on reading data papers to get to the bottom of things; I’ll end the piece with some bits that I’m not sure about).
Building the Timeline
When reading academic papers, the first thing you should know is that you’re looking to build a timeline of ideas.
For instance, Dr. E. F. Codd and associates published a white paper for Arbor Software (now Hyperion Solutions) in 1993, titled “Providing OLAP (On-line Analytical Processing) to User-Analysts: An IT Mandate.” This paper introduced the term ‘OLAP’ and a set of abstract rules somewhat like his rules for RDBMS.
From this paper we know that the term ‘OLAP cube’ did not exist before 1993, since the term ‘OLAP’ was only coined in that year. The one thing that I’m not able to pin down is when the term ‘data cube’ was first used — as far as I know, data cubes and hypercubes were used sporadically going back to the late 80s, mostly in computer programming contexts.
I looked for implementation papers close to 1993. The next major paper that I found was Data Cube: a relational aggregation operator generalizing Group-BY, CROSS-TAB and SUB-TOTALS by (Gray, Bosworth, Lyaman and Pirahesh, 1995) This paper was published in 1995, just two years after Codd defined ‘OLAP’, and explains how to add CUBE functionality as an SQL operator. It’s likely that the authors of this paper were in correspondence with the next paper we’re going to talk about, since both papers referenced each other. We’ll talk about the significance of this paper in a second.
In 1996, Harinarayan, Rajaraman and Ullman published Implementing Data Cubes Efficiently. It remains one of the most highly cited papers in any paper about OLAP cubes today, and remains in the top 500 most cited computer science papers over the past 25 years.
This paper had the following to say about data cubes:
Users of data warehouses work in a graphical environment and data are usually presented to them as a multidimensional ‘data cube’ whose 2-D, 3-D, or even higher-dimensional sub cubes they explore trying to discover interesting information.
From this we know that by 1996, people were using graphical user interfaces to explore multidimensional ‘data cubes’. But what are these data cubes that they speak of? The paper has a description that goes like this:
As an example consider the TPC-D decision-support benchmark. The TPC-D benchmark models a business warehouse. Parts are bought from suppliers and then sold to customers at a sale price SP. The database has information about each such transaction over a period of 6 years.
There are three dimensions we are interested in: part, supplier, and customer. The ‘measure’ of interest is the total sales. So for each cell (p, s, c) in this 3-D data cube, we store the total sales of part p that was bought from supplier s, and sold to customer c. We use the terms dimension and attribute interchangeably in this section. (…)
Users are also interested in consolidated sales: for example, what is the total sales of a given part p to a given customer c? (Gray, Bosworth, Layman & Pirahesh, 1995) suggest adding an additional value ‘ALL’ to the domain of each dimension to achieve this. In the question above we want the total sales of a given part p to a given customer c for ‘ALL’ suppliers. The query is answered by looking up the value in cell(p, ALL, c).
What a data cube is in this context is that it’s essentially a multi-dimensional table with aggregated data. In this particular example (the TPC-D benchmark), the aggregation that we care about is total sales and consolidated sales. In fact, Carroll’s article on OLAP Cubes does a pretty good job of describing this data access pattern — it is ‘essentially a pivot table (like from Excel), but with more than two dimensions’.
Where things get complicated is that circa 1995, the OLAP Cube refers to both the user interface as well as this usage pattern. This has to do with the way OLAP was originally defined in Codd’s 1993 paper. Here’s what database expert Joe Celko had to say about Codd’s original definition (from Joe Celko’s Analytics and OLAP in SQL — note that each ‘F’ number is a feature number as laid out by Codd, but the explanation is Celko’s):
F1: Multidimensional Conceptual View. This means that data is kept in a matrix in which each dimension of the matrix as an attribute. This is a grid of spreadsheet model of data. This includes the ability to select subsets of data based on restrictions on the dimensions.
F2: Intuitive Data Manipulation. Intuition is a vague term that every vendor claims for its product. This is usually taken to mean that you have a graphical user interface (GUI) with the usual ‘drag-and-drop’ feature and other graphic interfaces. This does not exclude a written programming language, but it does not give you any help with the design of it.
F3: Accessibility: OLAP as a Mediator. The OLAP engine is middleware between possibly heterogeneous data sources and an OLAP front end. You might want to compare this to the model for SQL, where the SQL engine sits between the user and the database.
F4: Batch Extraction versus Interpretive Extraction. The OLAP has to have its own staging database for OLAP data as well as offer live access to external data. This is hybrid OLAP (HOLAP), which we will discuss shortly. Live access to external data is a serious problem, because it implies some kind of connection—and possibly huge and unexpected data flows into the staging database.
(…) F6: Client/Server Architecture. This pretty well speaks for itself. The goal was to allow the users to share data easily and to be able to use any front-end tool.
There are 18 features in total, and you may read the original paper here. I’ve quoted from Celko’s book because his comments are clearer, and written with the benefit of hindsight.
What does this tell us? It tells us that OLAP, as it was originally defined, was very prescriptive with what and how the system was supposed to look like. And what it was supposed to look like was something that looked a lot like a spreadsheet client, with data presented in a grid, connected to a backing data store that acted as the server. The main difference between an OLAP system and a spreadsheet was that the OLAP system was supposed to allow users the ability to analyse many dimensions, above and beyond what a spreadsheet program of the era could do.
Perhaps we should paint a picture of the era. I want you to imagine that you were a data analyst during this period. Windows 95 was released on August 24, 1995, and was Microsoft’s blockbuster graphical user interface OS. Excel finally became the dominant spreadsheet application with version 5 in 1993. If you were doing business intelligence, you would likely be most familiar with spreadsheets; it made sense that your business intelligence software looked like a spreadsheet system on steroids.
So it’s important to know that data analysts of the time used OLAP Cube as a shorthand for both the user interface, as well as the ‘pre-aggregated multi-dimensional table’ concept that underpinned it.
And then things got complicated.
Gray, Bosworth, Lyaman and Pirahesh’s paper tells us that the CUBE operator was in the process of being added to the SQL standard circa 1995. This meant that various SQL-compliant databases of the time were incentivised to add a new ‘CUBE’ aggregation operator, in order to enable OLAP workloads for their databases.
Around the same time, Ralph Kimball published The Data Warehouse Toolkit, which argued that you should organize your data warehouse into what we now call the snowflake schema. If you wanted to run your analysis directly on your data warehouse — then, well, Kimball’s modeling techniques would make your life easier. But a major benefit of the pattern was that it also made it easier to ‘materialize’ your OLAP cubes. This activity of organizing your data warehouse was called ‘dimensional data modeling’ — a paradigm that continues to this day. And it fit into the OLAP system paradigm pretty well: remember that OLAP systems were — as Codd defined it — supposed to have a staging database from which the cube would be materialized. Every time the underlying data changed, you were supposed to ‘rematerialize’ the cube — that is, update the aggregations. Kimball’s proposed data modeling techniques made it much easier to deal with data organization whenever you wanted to materialize new cubes.
Now, at this point we haven’t talked about what these OLAP systems looked like. Were they ‘a type of table in an SQL database’? Or were they completely separate, proprietary systems? And that brings us to …
The OLAP Cube Landscape of the 90s
Materializing the OLAP cube was the main technological challenge of the 90s. Computer memory and storage was as expensive as cars. In fact, Harinarayan, Rajaraman and Ullman’s Implementing Data Cubes Efficiently was about exactly this question! They wrote:
We have only discussed the presentation of the the user. The following implementation alternatives are possible:
1. Physically materialize the whole data cube. This approach gives the best query response time. However, precomputing and storing every cell is not a feasible alternative for large data cubes, as the space consumed becomes excessive. It should be noted that the space consumed by the data cube is also a good indicator of the time it takes to create the data cube, which is important in many applications. The space consumed also impacts indexing and so adds to the overall cost.
2. Materialize nothing. In this case In this case we need to go to the raw data and compute every cell on request. This approach punts the problem of quick where the raw data is stored. No extra space beyond query response to the database system that for the raw data is required.
3. Materialize only part of the data cube. We consider this approach in this paper. In a data cube, the values of many cells are computable from those of other cells in the data cube. This dependency is similar to a spreadsheet where the value of cells can be expressed as a function of the values of other cells.
Remember, this was at a time when 1GB of RAM cost $32,300, a ridiculous sum of money for an amount of RAM we take for granted today. I remember using a PC with 64MB of RAM in 1998 and thinking that it was the best thing I’d ever seen. My point: these research papers weren’t for fun — the majority of OLAP systems on the market were working with what we now consider small amounts of memory.
The paper also gives us an idea of the data cube tool landscape of the time:
The problem of what cells of the data cube to materialize, is a very real one. There are different commercial systems which pick one of the different strategies given above. Clearly, each strategy has its benefits. For example, for applications where performance is of paramount importance and scalability is not important we can go with the materialize-everything strategy. The Essbase system, for example, materializes the whole data cube, while BusinessObjects materializes nothing, and the MetaCube system materializes part of the cube.
There is also the issue of where the materialized data cube is stored: in a relational system or a proprietary MDDB (multi-dimensional database) system (emphasis added). In this paper, we assume that the data cube is stored in ‘summary’ tables in a relational system.
This is likely when ‘OLAP cube’ began to mean ‘a highly optimised data structure/data engine that serves as an alternative product to databases and data warehouses.’
You can sort of imagine the business intelligence stacks of the time:
- You would do ETL to a staging area.
- You would ETL to your data warehouse, and have it transformed into a dimensional data model.
- You would then either connect a BI client to the data warehouse directly, or do ETL yet again to materialize the data into an OLAP cube. This materialization step could either occur inside the data warehouse (with built-in OLAP cube capabilities), or with a separate OLAP cube system.
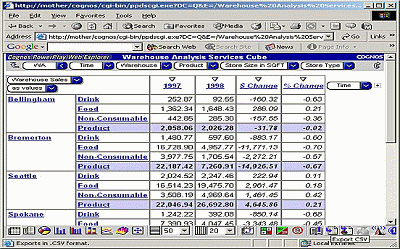
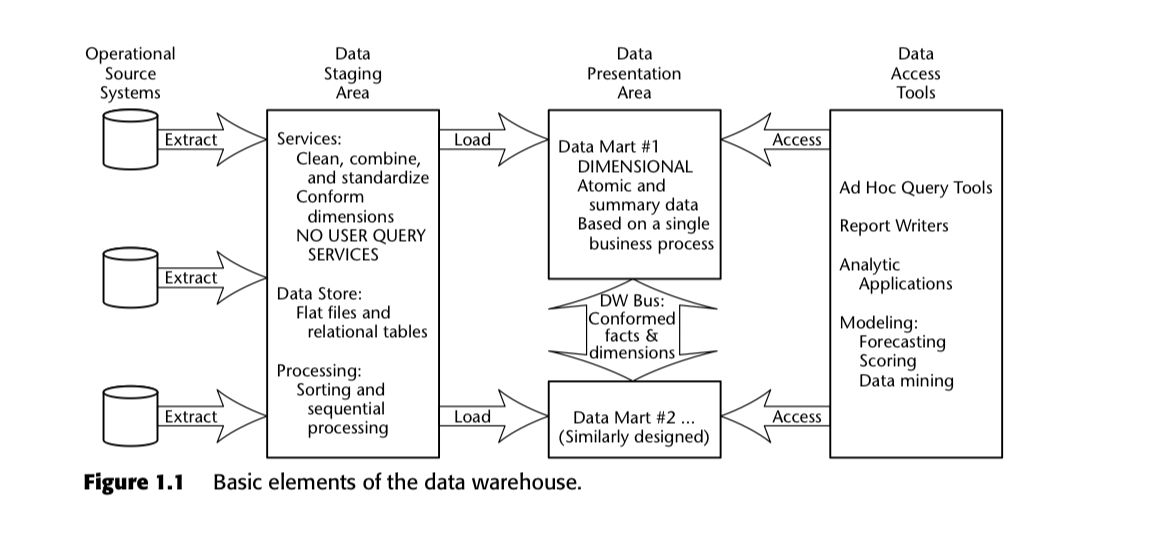
Kimball himself called this the ‘Enterprise Data Warehouse Bus Architecture’, and gave an example of a generic data warehousing project in his book. He used the following diagram:
The fact was that there were many OLAP cube systems on the market at the time. The dominant player was Microsoft, with OLAP Services released in 1996, as part of the SQL Server 7 product. This was essentially OLAP cube functionality within a relational database system. Microsoft then released a new language called MultiDimensional Expressions, or MDX, for OLAP cubes, marketed as ‘the language for analytics’. Joe Celko tells us what occurred next:
SQL is the standard query language for transactional databases. Other than a few OLAP features added to SQL-99, there is no such language for analytics. The closest thing is the MDX (Multi-Dimensional Expressions) language from Microsoft, which has become the de facto standard by virtue of Microsoft’s market domination.
This is not because MDX is a technically brilliant language, but because Microsoft makes it so much cheaper than other products. The syntax is a confusing mix of SQL and an object-oriented (OO) dialect of some kind. Compared with full statistical packages, it is weak as well.
But other players included Cognos, Micro Strategy, and Hyperion. Many of these alternative systems adopted MDX, used proprietary data stores, and were not built on top of a relational database. They were designed to be used alongside a data warehouse. Some started running their operations within memory, to gain huge speedups during exploratory analysis. Alfred Cuzzocrea’s OLAP Data Cube Compression Techniques: A Ten-Year-Long History gives us an idea of some of the developments that occurred during this period.
It’s safe to say that while data warehouses evolved to meet disparate needs in the 90s (like being the system of record), OLAP cube systems took on straight-line innovation to become extremely fast, easily-consumable, exploratory tools.
And that brings us to the last two decades.
What Happened Next
Over the course of the 2000s, two things happened:
- Cube interfaces began to fall to the wayside. As computers became more powerful, and computer graphics became more sophisticated, data cubes ceased to be the primary interface for Business Intelligence. In many ways we have to thank Tableau for that, because Tableau made data visualization a thing in our industry. As a result, the term ‘OLAP cube’ began to be disassociated from a particular user interface. We are more likely to say ‘dashboard’, ‘report’, and ‘table’ today.
- Data warehouses started becoming more powerful. Columnar data warehouses allowed users to perform OLAP workloads without materializing an OLAP cube, and massively parallel processing architectures in cloud data warehouses began to make these OLAP workloads runnable within a single (if distributed) data warehouse.
The upshot of these changes meant that the term ‘OLAP cube’ increasingly took on the connotations of ‘multi-dimensional data engine that is not a database or a data warehouse’ instead of ‘a certain type of data user interface’ or ‘a certain type of aggregated data structure’. When someone says “we use OLAP cubes”, they are more likely to mean “we have an OLAP cube system we purchased from a vendor in our stack” and not “we materialized this special table in our data warehouse.” This is the account that I gave in The Rise and Fall of the OLAP Cube.
It’s also worth asking if the term ‘OLAP’ still applies today. If we strictly follow Codd’s definition of OLAP, most modern MPP columnar data warehouses don’t fulfil all 18 of the requirements Codd laid out in his 1993 paper. Some people insist that this matters. But by and large, people just take ‘OLAP’ to mean ‘analytical system’, and go on as if this were the case. My stance is that if enough people use the term differently, then eventually you can just assume the term means something different; this was the definition I used in The Rise and Fall of the OLAP Cube.
I’ve spent about 3000 words on a story about a phrase. I constructed most of this story from reading papers from the 90s, followed by a dive into columnar data warehouses, and a dive into OLAP cube data engines. But I’ve had to piece together the market shifts in the 2000s and the 2010s on my own. If you find nuances to this story that I haven’t already included, please feel free to reach out to me.
Empirically, a big chunk of the data professionals that I talk to think of ‘OLAP Cube’ as ‘this alternative tool that I can use to get good analytical performance’. OLAP cubes tend to come up when the data team cares deeply about performance. While my biases are that modern columnar cloud data warehouses are good enough for most analytical workloads, certain professionals I know say that their data is so terribly large that the only way to get decent analytical performance is to materialize cubes. “MPP columnar data warehouses are good and all” they say, “But my analysts want performance. Also they want to go home on time.” And maybe they have a point. So today, when someone asks “can we do OLAP cubes in Holistics”, my question is always “what do you mean by OLAP, and what do you mean by OLAP cube?”
Let’s wrap this up. The term ‘OLAP cube’ has come to mean many things over the past three decades:
- A type of user interface for browsing data.
- A type of data structure that may be called an ‘aggregation table’ (that may or may not be materialized in a relational database system)
- A highly optimised data tool that serves as an alternative product to databases and data warehouses.
- The only way to implement Codd’s OLAP pattern, or, OLAP = OLAP cube.
While most of the data people I talk to take OLAP cube to mean the third thing, some people do continue to think of an OLAP cube as a ‘user interface for exploring data’. Others, like Carroll, argue that an OLAP cube is a ‘multi-dimensional aggregation table’ in a database. Still others think that the OLAP cubes are the only real way to implement Codd’s original articulation of OLAP.
Who is correct?
Obviously I’m biased, and I think some definitions are more valid than others. (I’ve been on the record for saying that OLAP != OLAP Cube, after all!) But perhaps the right answer is that we shouldn’t care. I think you should take whatever definition your counter-party is using.
If someone tells you that an OLAP cube is tied to a particular user interface, you may choose to argue with them. Or you may choose to ask for war stories. And I happen to think one is more fun than the other.
What's happening in the BI world?
Join 30k+ people to get insights from BI practitioners around the globe. In your inbox. Every week. Learn more
No spam, ever. We respect your email privacy. Unsubscribe anytime.