
Increasing experimentation accuracy and speed by using control variates

At Etsy, we strive to nurture a culture of continuous learning and rapid innovation. To ensure that new products and functionalities built by teams — from polishing the look and feel of our app and website, to improving our search and recommendation algorithms — have a positive impact on Etsy’s business objectives and success metrics, virtually all product launch decisions are vetted based on data collected via carefully crafted experiments, also known as A/B tests.
With hundreds of experiments running every day on limited online traffic, our desire for fast development naturally calls for ways to gain insights as early as possible in the lifetime of each experiment, without sacrificing the scientific validity of our conclusions. Among other motivations, this need drove the new formation of our Online Experimentation Science team: a team made of engineers and statisticians, whose key focus areas include building more advanced and scalable statistical tools for online experiments.
In this article, we share details about our team’s journey to bring the statistical method known as CUPED to Etsy, and how it is now helping other teams make more informed product decisions, as well as shorten the duration of their experiments by up to 20%. We offer some perspectives on what makes such a method possible, what it took us to implement it at scale, and what lessons we have learned along the way.
Is my signal just noise?
In order to fully appreciate the value of a method like CUPED, it helps to understand the key statistical challenges that pertain to A/B testing. Imagine that we have just developed a new algorithm to help users search for items on Etsy, and we would like to assess whether deploying it will increase the fraction of users who end up making a purchase, a metric known as conversion rate.
A/B testing consists in randomly forming 2 groups — A and B — of users, such that users in group A are treated (exposed to the new algorithm, regarded as a treatment) while users in group B are untreated (exposed to the current algorithm). After measuring the conversion rates Y[A] and Y[B] from group A and group B, we can use their difference Y[A] - Y[B] to estimate the effect of the treatment.
There are essentially two facets to our endeavour — detection and attribution. In other words, we are asking ourselves two questions:
- Does the observed difference reflect the existence of a real effect?
- If there is a real effect, is it caused by the treatment?
Since our estimated difference is based only on a random sample of observations, we have to deal with at least two sources of uncertainty.
The first layer of randomness is introduced by the sampling mechanism. Since we are only using a relatively small subset of the entire population of users, attempting to answer the first question requires the observed difference to be a sufficiently accurate estimator of the unobserved population-wide difference, so that we can distinguish a real effect from a fluke.
The other important layer of randomness comes from the assignment mechanism. Claiming that the effect is caused by the treatment requires groups A and B to be similar in all respects, except for the treatment that each group receives. As an illustrative thought experiment: pretend that we could artificially label each user as either “frequent” or “infrequent” based on how many times they have visited Etsy in the previous month. If, by chance, or rather mischance, a disproportionately large number of “frequent” users were assigned to group A (Figure 1), then it would call into question whether the observed difference in conversion rate is indeed due to an effect from the treatment, or whether it is simply due to the fact that the groups are dissimilar.

One solution to the attribution question is to exploit the randomization of the assignments, which guarantees that — except for the treatments received — groups A and B will become more and more similar in every way, on average, as their sample sizes increase. Going one step further, if we somehow understood how the type of a user (e.g. “frequent” or “infrequent”) informs their buying habit, then we could attempt to proactively adjust for group dissimilarities, and correct our naive difference Y[A] - Y[B] by removing the explainable contribution coming from apparent imbalances between groups A and B. This is where CUPED comes into play.
What is CUPED?
CUPED is an acronym for Controlled experiments Using Pre-Experiment Data [1]. It is a method that aims to estimate treatment effects in A/B tests more accurately than simple differences in means. As reviewed in the previous section, we traditionally use the observed difference between the sample means
Y[A] - Y[B]
of two randomly-formed groups A and B to estimate the effect of a treatment on some metric Y of interest (e.g. conversion rate). As hinted earlier, one of the challenges lies in disentangling and quantifying how much of this observed difference is due to a real treatment effect, as opposed to misleading fluctuations due to comparing two subpopulations made of non-identical users. One way to render these latter fluctuations negligible is to increase the number of users in each group. However, the required sample sizes tend to grow proportionally to the variance of the estimator Y[A] - Y[B], which may be undesirably large in some cases and lead to prohibitively long experiments.
The key idea behind CUPED is not only to play with sample sizes, but also to explain parts of these fluctuations away with the help of other measurable discrepancies between the groups. The CUPED estimator can be written as
Y[A] - Y[B] - (X[A] - X[B]) β
which corrects the traditional estimator with an additional denoising term. This correction involves the respective sample means (X[A] and X[B]) of a well-thought-out vector of user attributes (so-called covariates and symbolized by X), and a vector β of coefficients to be specified. Our earlier example (Figure 1) involved a single binary covariate, but CUPED generalizes the reasoning to multidimensional and continuous variables. Intuitively, the correction term aims to account for how much of the difference in Y is not due to any effect of the treatment, but rather due to differences in other observable attributes (X) of the groups.
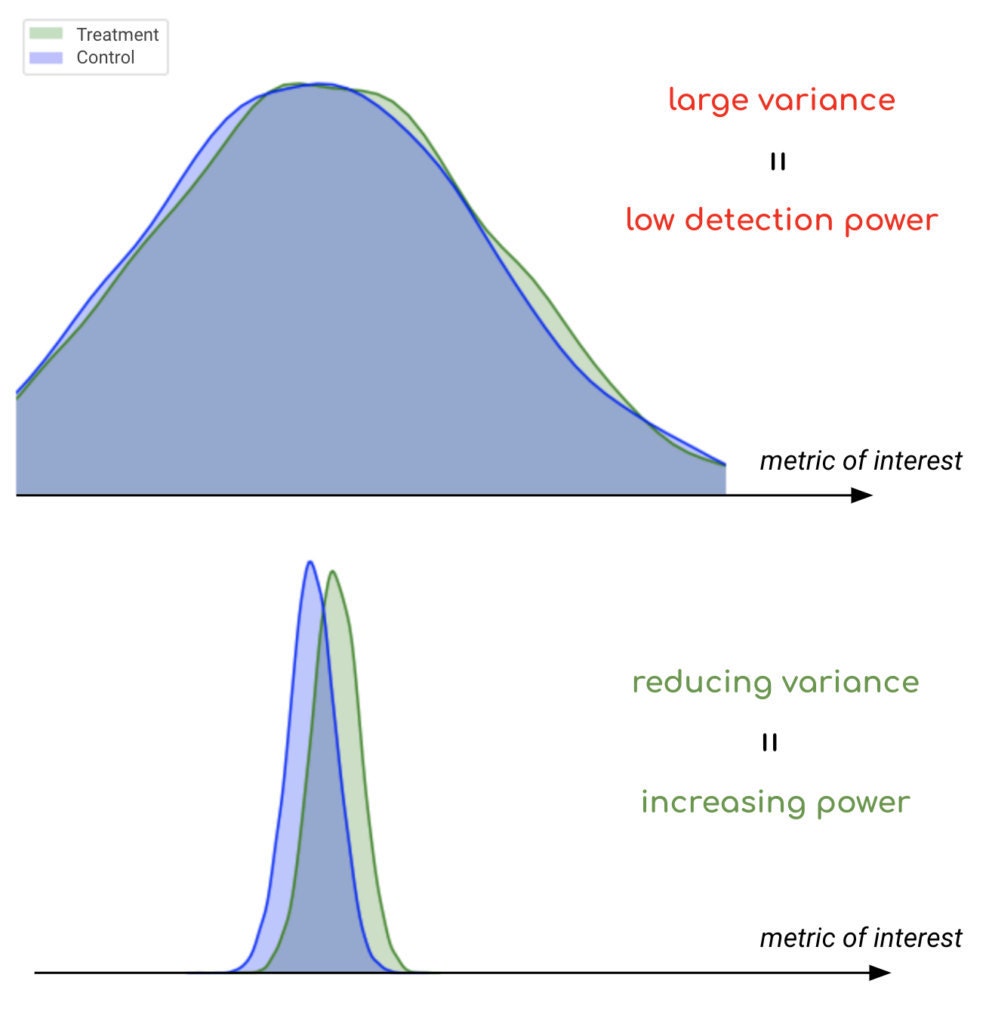
By choosing X as a vector of pre-experiment variables (collected prior to each user’s entry into the experiment), we can ensure that the correction term added by CUPED does not introduce any bias. Additionally, the coefficient β can be judiciously optimized so that the variance of the CUPED estimator becomes smaller than the variance of the original estimator, by a reduction factor that relates to the correlation between Y and X. In simple terms, the more information on Y we can obtain from X, the more variance reduction we can achieve with CUPED. In the context of A/B testing, smaller variances imply smaller sample size requirements, hence shorter experiments. Correspondingly, if sample sizes are kept fixed, smaller variances enable larger statistical power for detecting effects (Figure 2).
The benefits and accessibility of CUPED (especially its quantifiable improvement over the traditional estimator, its interpretability, and the simplicity of its mathematical derivation) explain its popularity and widespread adoption by other online experimentation platforms [2, 3, 4, 5].
Implementing CUPED at Etsy
The implementation of CUPED at scale required us to construct a brand new pipeline (Figure 3) for data processing and statistical computation. Our pipeline consists of 3 main steps:
- Retrieving (or imputing) pre-experiment data for all users.
- Computing CUPED estimators for each group.
- Performing statistical tests (t-test) using CUPED estimators.
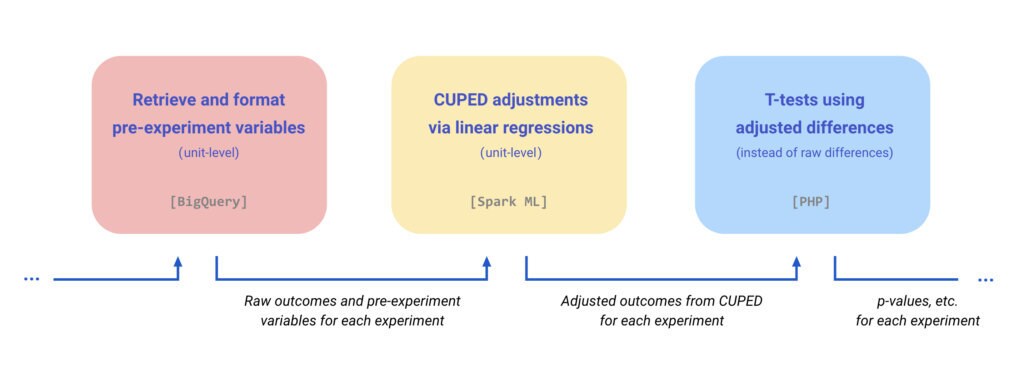
When a user enters into an experiment for the first time, we attempt to fetch the user’s most recent historical data from the preceding few weeks. The window length was chosen to hit a sweet spot between looking far enough back in time for historical data to exist, but not as far as to render such pre-experiment data unpredictive of the in-experiment outcomes. This step involves some careful engineering in order to retrieve (and possibly reconstruct) the historical data from the pre-experiment period at the level of each individual user.
Once the pre-experiment variables are retrieved and formatted, we may proceed with the CUPED adjustments. As it turns out, the optimal choice of coefficient β coincides with the ordinary-least-squares coefficient of a linear regression of Y on X. This relationship enables the efficient computation of CUPED estimators as residuals from linear regressions, which we implemented at scale using Apache Spark’s MLlib [6]. The well-established properties of linear regressions also allowed us to design non-trivial and interpretable simulations for unit testing.
Since CUPED estimators can be expressed as simple differences in means (albeit using adjusted outcomes instead of raw outcomes), we were able to leverage our existing t-testing framework to compute corresponding p-values and confidence intervals. Besides the adjusted difference between the two groups, our pipeline also outputs the group-level estimates Y[A] - (X[A] - X[B]) β and Y[B] for further reporting and diagnosis. Note the intentional asymmetry of the expressions, as Y[A] - X[A] β and Y[B] - X[B] β would generally be biased estimators of the group-level means, unless the covariates were properly centered.
Impact and food for thought
Overall, CUPED leads to meaningful improvements across our experiments. However, we observe varying degrees of success, e.g. when comparing different types of pages (Figure 4). This can be explained by the fact that different pages may have different amounts of available pre-experiment data, with different degrees of informativeness (e.g. some pages may be more prone to be seen by newer users, on whom we may not have much historical information).

In favorable cases, our out-of-the-box CUPED implementation can reduce variances by up to 20%, thus leading to narrower confidence intervals and shorter experiment durations (Figure 5). In more challenging cases where pre-experiment data is largely missing or uninformative, the correction term from CUPED becomes virtually 0, making CUPED estimators revert to their non-CUPED counterparts and hence yield no reduction in variance — but no substantial increase either.

On the engineering side of things, one of the lessons we learned from implementing CUPED is the importance of producing and storing experiment data at the appropriate granularity level, so that the retrieval of pre-experiment data can be done efficiently and in a replicable fashion. Scalability also becomes a key desideratum as we expand the application of CUPED to more and more metrics.
Another challenge we overcame was ensuring a smooth delivery of CUPED, both in terms of user experience and communication. To this end, we conducted several user research interviews at different stages of the project, in order to inform our implementation choices and make certain that they aligned with the needs of our partners from the Analytics teams. Integrating new CUPED estimators to Etsy's existing experimentation platform — and thus discontinuing their long-established non-CUPED counterparts — was done after careful UX and UI considerations, by putting thoughts into the design and following a meticulous schedule of incremental releases. Our team also invested a lot of effort into creating extra documentation and resources to anticipate possible concerns or misconceptions, as well as help users better understand what to expect (and equally importantly, what not to expect) from CUPED.
Finally, from a methodological standpoint, an interesting reflection comes from noticing that CUPED estimators can achieve smaller variances than their non-CUPED counterparts, at essentially no cost in bias. The absence of any bias-variance trade-off may make one feel skeptical of the seemingly one-sided superiority of CUPED, as one may often hear that there is no such thing as a free lunch. However, it is insightful to realize that … this lunch is not free.
In fact, the conceptual dues that we are paying to reap CUPED’s benefits are at least two-fold. First, we are borrowing information from additional data. Although the in-experiment sample size required by CUPED is smaller compared to its non-CUPED rival, the total amount of data effectively used by CUPED (when combining both in-experiment and pre-experiment data) may very well be larger. That cost is somewhat hidden by the fact that we are organically collecting pre-experiment data as a byproduct of our natural experimentation cycle, but it is an important cost to acknowledge nonetheless. Second, CUPED estimators are computationally more expensive than their non-CUPED analogues, since their linear regressions induce additional costs in terms of execution time and algorithmic complexity.
All this to say: the increased accuracy of CUPED is the fruit of sensible efforts that warrant thoughtful considerations (e.g. in the choice of covariates) and realistic expectations (i.e. not every experiment is bound to magically benefit). We hope that our work on CUPED can serve as an inspiring illustration of the valuable synergy between engineering and statistics.
Acknowledgements
We would like to give our warmest thanks to Alexandra Pappas, MaryKate Guidry, Ercan Yildiz, and Lushi Li for their help and guidance throughout this project.
References
[1] A. Deng, Y. Xu, R. Kohavi, T. Walker (2013). Improving the sensitivity of online controlled experiments by utilizing pre-experiment data.
[2] H. Xie, J. Aurisset (2016). Improving the sensitivity of online controlled experiments: case studies at Netflix.
[3] S. Jackson (2018). How Booking.com increases the power of online experiments with CUPED.
[4] R. Kohavi, D. Tang, Y. Xu (2020). Trustworthy online controlled experiments: a practical guide to A/B testing.
[5] J. Li, Y. Tang, J. Bauman (2020). Improving experimental power through control using predictions as covariate.
[6] Apache Spark. MLlib [spark.apache.org/mllib].