You need to dig into old blogs I wrote before to fully understand how interesting this new extension is.
On Saving Money with Log Analytics I mentioned how important log analytics is for azure clouds. This deserves more in depth analysis, which probably will be broken down in blog articles.
On Connecting to Log Analytics using Azure Data Studio and KQL I introduced a solution to make Log Analytic queries in Python notebooks using Azure Data Studio. Comparing to the new feature I’m about to show this will seems like something from stone age.
On Using Power BI to Query Log Analytics I made demonstrations with Power BI, bringing log analysis to another level.
The news: A new extension is in preview to allow connecting Azure Data Studio to Log Analytics as if you were connecting to a SQL database.
The extension is in preview, so you need to install it on Azure Data Studio Insiders version, which brings preview features in advance for us. If you are lost in space and don’t have the Insiders version installed yet, you can get it here
Once you installed Azure Data Studio Insiders, let’s follow the steps you need to start querying Azure Log Analytics.
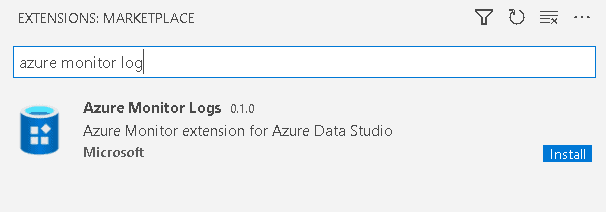
Install the Extension
This is easy and with no mystery: Use the extensions tab, look for Azure Monitor Log extension and install it.
Create a Connection
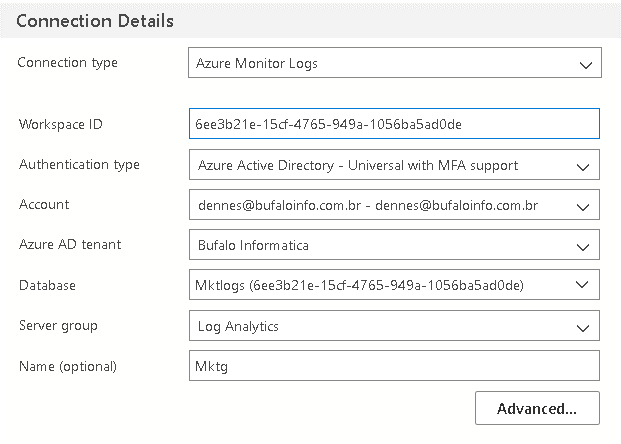
The regular Create Connection window has one additional option, Azure Monitor Logs. We will need to fill some specific log analytics details:
Connection Type: Azure Monitor Logs
Workspace Id: You can find this information on your Azure portal, on your Log Analytics workspace.
Authentication: You will need to authenticate against the Active Directory where your Log Analytics is. You will need to provide an account and Azure AD Tenant and the authentication will be made using this account
Database: There is only one option. It will only be filled after you provide the authentication
Server Group: This is an ADS detail about how you organize your connections. You can create a group for all your log analytics connections.
Name: the name of this connection on the UI
Look Around
Take a look around and check the result of your connection.
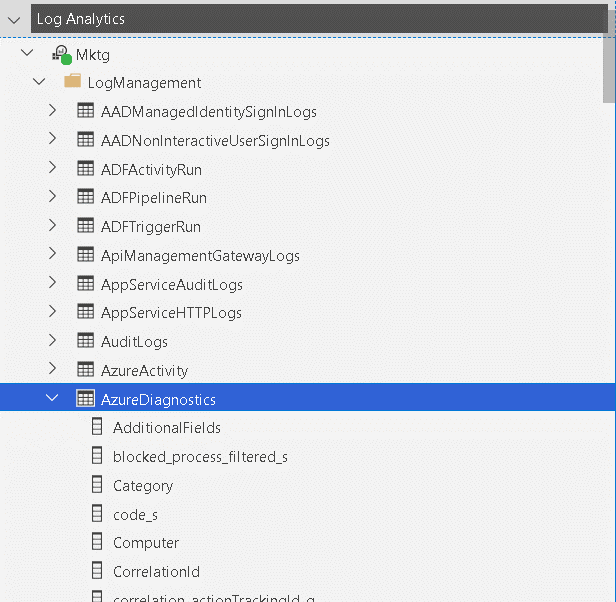
- In the Connections panel you are able to navigate the tables inside log analytics down to the level of fields. Only a few tables are shared across many services, while others are specific to one azure service.
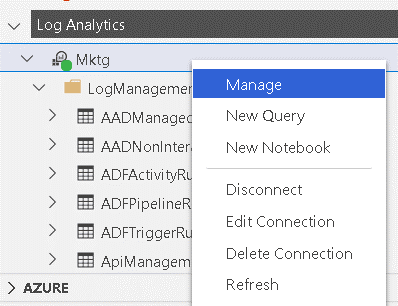
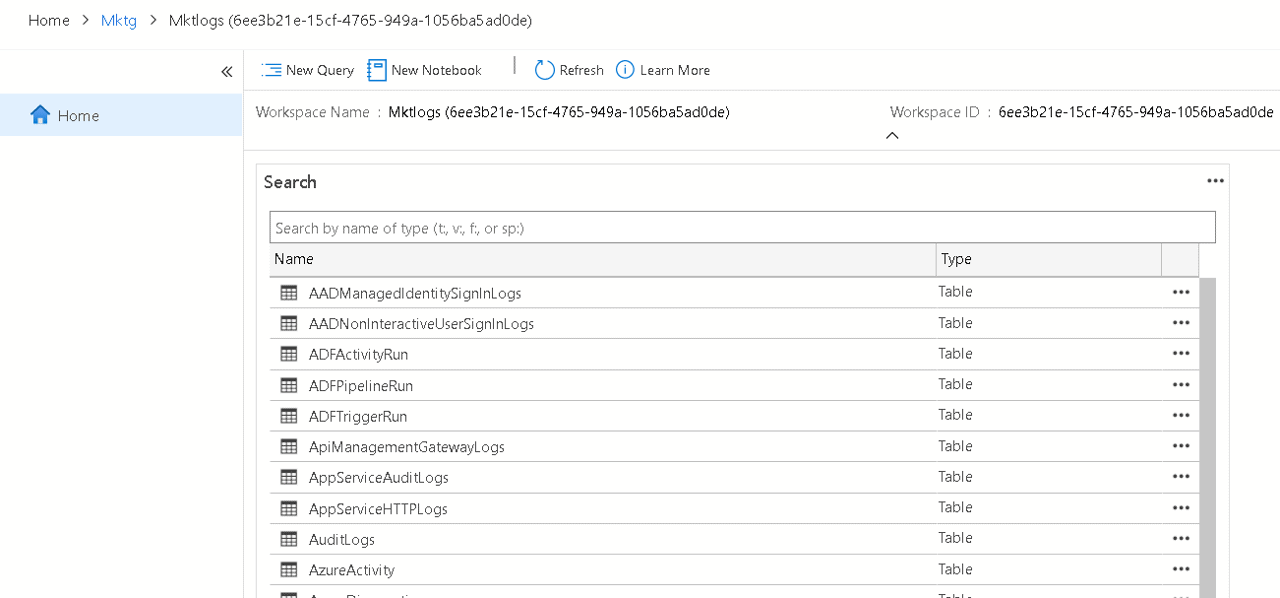
- Right click the log analytics connection in the Connections panel and select Manage. The tab that will open will show you the tables once again, but here you have the option to create a new query or a new notebook.
Creating a new Notebook
Once you created a new Notebook, it will be connected to your Log Analytics. The kernel will be Log Analytics and not Kusto. Yes, I know Kusto is the Log Analytics language, but Azure Data Explorer already uses Kusto as Kernel. The kernel needs to be Log Analytics.
![]()
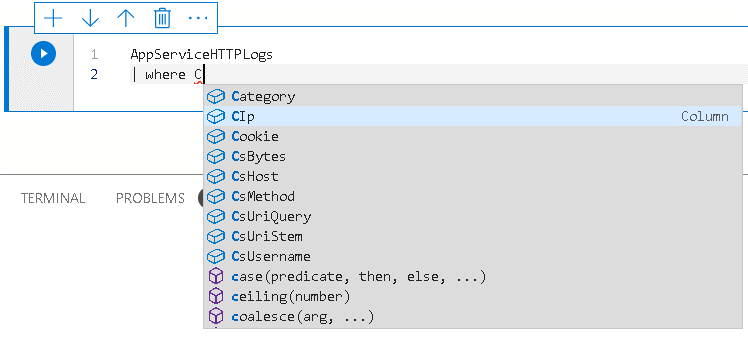
The notebook provides intellisense while you type your query, but doesn’t provide coloring options for the statements yet, the entire query is black, a boring black.
As we would expect from an ADS notebook, we can create graphics from the query results. For example, this is a graphic of weekly access on a website, by day of week:
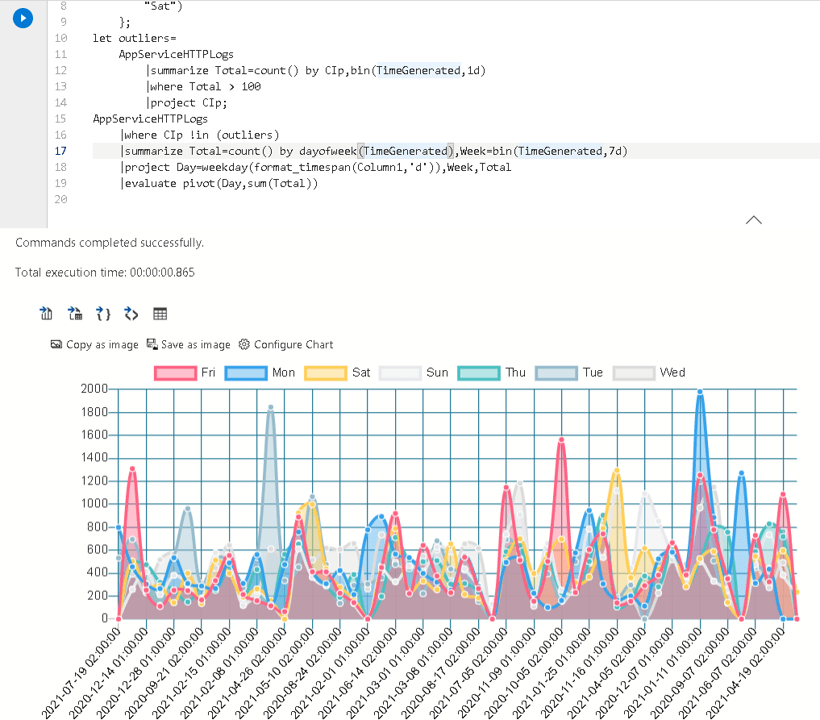
The graphics in a notebook are not the same as a Log Analytics workbook. In order to achieve this line graphic I had to include a PIVOT function on the query, otherwise the graphic would not show this data, while on the workbook we could configure for this data.
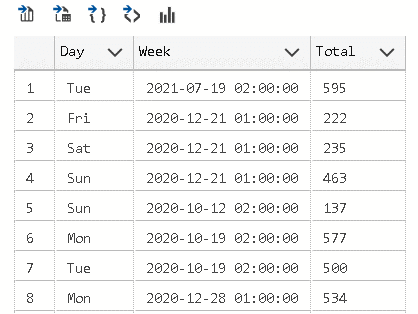
Without the PIVOT function, this would be the result of the query:
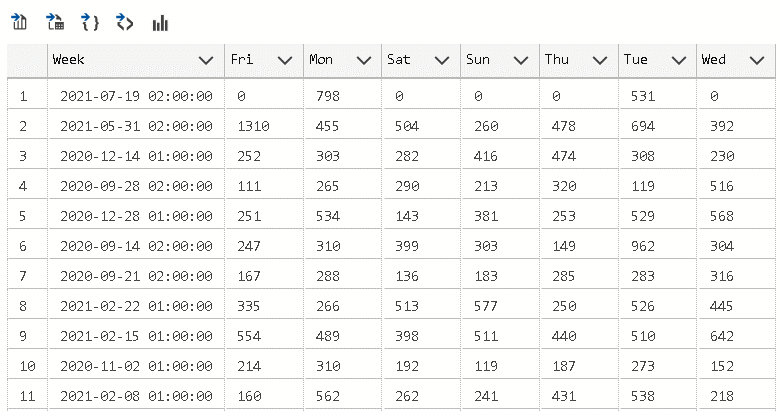
Using the EVALUATE statement and the PIVOT function, we turn the content of the column Day into columns, allowing us to create the line graphic above:
Small Pending Problems
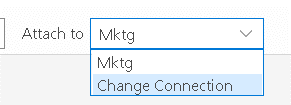
- The Azure Connection is lost from time to time. We need to refresh the connection. On the notebook, we can use the Change Connection for that. On the Connections panel, we can disconnect and connect again.
- The code doesn’t use any different color for the statements
- The graphic features on a notebook may be more difficult to handle than on log analytics workbook. However, I don’t think this is really an issue, it’s more about different usages of the tools.
Conclusion
Each day we get new tools to access Log Analytics, increasing the importance of this great tool for Azure Clouds.
Load comments